Master Discusses Hot Topics:
Last night's GDP and PCE data came out and at first glance, it looked quite explosive. The first quarter GDP fell by 0.3% year-on-year, far below expectations, and PCE was ridiculously high, a clear script of recession + inflation! One would think this data is scary enough, but the market only dipped slightly.
In fact, the market isn't foolish; although the data looks weak, it hasn't reached the point of confirming a recession, so it can't drop too much. In plain terms, the support below is still strong.
Moreover, Trump has been actively pushing for negotiations recently. As long as the uncertainty around tariffs and policies doesn't fully explode, market sentiment won't be too bad.
Looking at the GDP data, it's a bit complex. If we say it's bearish, it did indeed drop by 0.3%, and the market followed suit; but to say the American economy is very poor isn't quite right either, as consumption is still quite stable, rising by 3%, which is around the average line.
There's not much to pay attention to in the PCE data, but the American wage and consumption data for March should be noted. Wages have dropped, but consumption has still increased, which means people are struggling even when they have no money. How can that be good?
If the unemployment rate in the U.S. rises again tomorrow night, the economic outlook will look even worse. However, as long as Trump doesn't cause trouble, this week's earnings reports should be fine, and the market should be able to maintain a recovery in the short term. The key will be tomorrow night's non-farm payroll data.
Back to Bitcoin, yesterday the short position set at 2000 points was taken down, and another 1600 points were captured. The daily line has been sideways for about eight or nine days, and based on experience, a change usually occurs on the 10th to 11th day, just in time for tomorrow night's non-farm data. The critical moment has arrived! If the news is good, it will directly surge to 98 to 100K.
If it leans bearish, it will first drop to around 92.7K. If it can rebound and close above 94.6K, it will still lean bullish; if it can't close above that and drops below 92K, it will turn bearish.
Therefore, in terms of operations based on news, one must be prepared for both scenarios. A second breakthrough at 95.7K would indicate a new high, and for short positions, remember to defend at 96K. For low long positions, keep it simple with a stop loss at or around 93.6K; if it drops below 93.6K, look to buy low between 93.3K and 92.8K.
The support around 9.3K is quite strong, and it would only trigger a daily level adjustment if it breaks below the middle track of the 12-hour Bollinger Bands. If it retraces to 92 to 90K, holding the rebound would indicate the end of the adjustment and a move upwards. Currently, the daily line does not show a top divergence, so don't chase shorts casually; in the short term, just take a small short position at highs.
Master Looks at Trends:
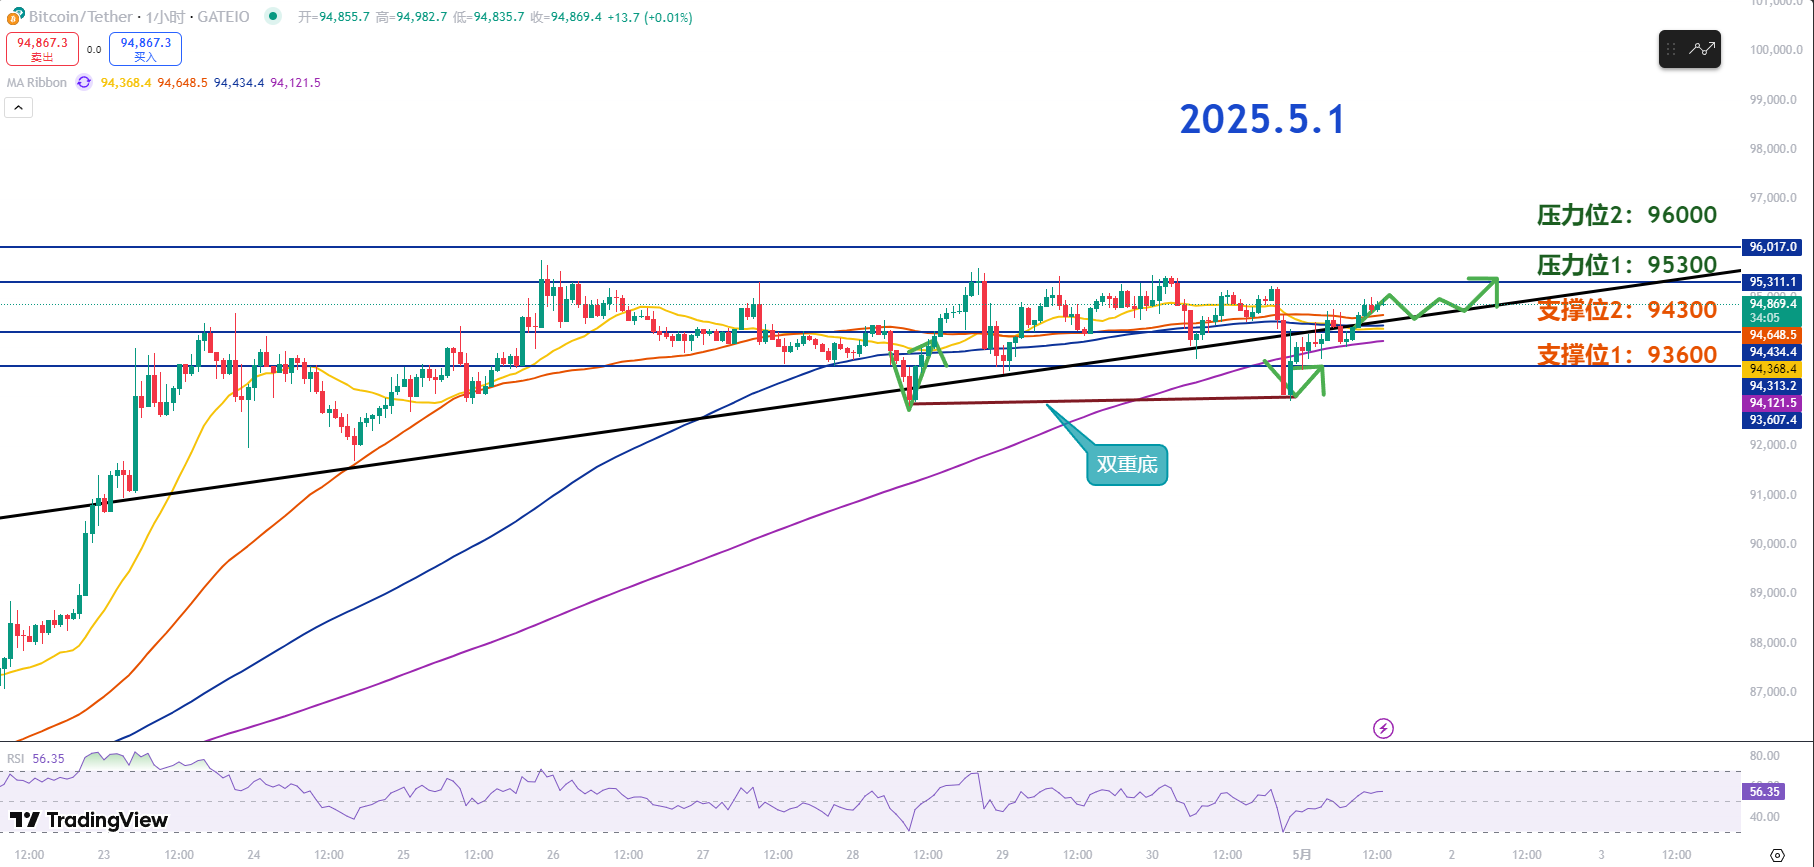
Resistance Levels Reference:
First Resistance Level: 96000
Second Resistance Level: 95300
Support Levels Reference:
First Support Level: 94300
Second Support Level: 93600
Today's Suggestions:
Bitcoin experienced a significant drop after the GDP data was released last night, but then formed a double bottom pattern and entered a rebound phase. The reason to pay attention to the previous low is that if it can hold during a sharp price drop, it will form a double bottom pattern, providing support for the subsequent rebound.
Bitcoin has tested the resistance level of 95.3K multiple times but has not been able to break through, indicating strong resistance. Once it successfully breaks through, a rapid rise may occur in the short term.
If it breaks the first resistance, the price could reach 96K in the short term. The range of 94 to 94.3K is an important support level, as it coincides with the 20, 60, 120, and 200-day moving averages. If the price holds these moving averages and begins to diverge after overlapping, it will continue to open up a bullish trend.
Conversely, if the price drops below the first support, one must pay attention to whether it can hold the 200-day moving average. If the price continues to make new lows, further adjustments will occur. However, even if adjustments happen, don't rush to go bearish; the focus should still be on previous low points to find ultra-short-term entry opportunities.
5.1 Master’s Swing Positioning:
Long Entry Reference: Accumulate in the 93600-94300 range, Target: 95300-96000
Short Entry Reference: Accumulate in the 96000-95300 range, Target: 94300-93600
This article is exclusively planned and published by Master Chen (WeChat public account: Coin God Master Chen). For more real-time investment strategies, solutions, spot trading, short, medium, and long-term contract trading techniques, operational skills, and knowledge about candlesticks, you can join Master Chen for learning and communication. A free experience group for fans has been opened, along with community live broadcasts and other quality experience projects!

Warm reminder: This article is only written by Master Chen on the official account (as shown above), and any other advertisements at the end of the article or in the comments are unrelated to the author!! Please be cautious in distinguishing authenticity, thank you for reading.
免责声明:本文章仅代表作者个人观点,不代表本平台的立场和观点。本文章仅供信息分享,不构成对任何人的任何投资建议。用户与作者之间的任何争议,与本平台无关。如网页中刊载的文章或图片涉及侵权,请提供相关的权利证明和身份证明发送邮件到support@aicoin.com,本平台相关工作人员将会进行核查。


