Source: Cointelegraph
Original: “Bitcoin (BTC) Next Key Resistance Level: $95,000 - What Will Trigger the Breakout?”
Key Points:
On April 23, the price of Bitcoin (BTC) rose to a new high of $94,700, the highest since March 2.
Several analysts stated that the next psychological resistance level remains at $95,000, and the price may drop to test below the support level.
“The $94,000 to $95,000 price range is clearly a difficult resistance level to break through,” Swissblock stated in a post on X on April 24.
On-chain data providers claim that the next logical move for Bitcoin will be a pullback to the $90,000 area to gain upward momentum.
“The $89,000 to $90,000 range may be the next area to test the bulls, but given Bitcoin's structural advantages, these dips are all buying opportunities.”
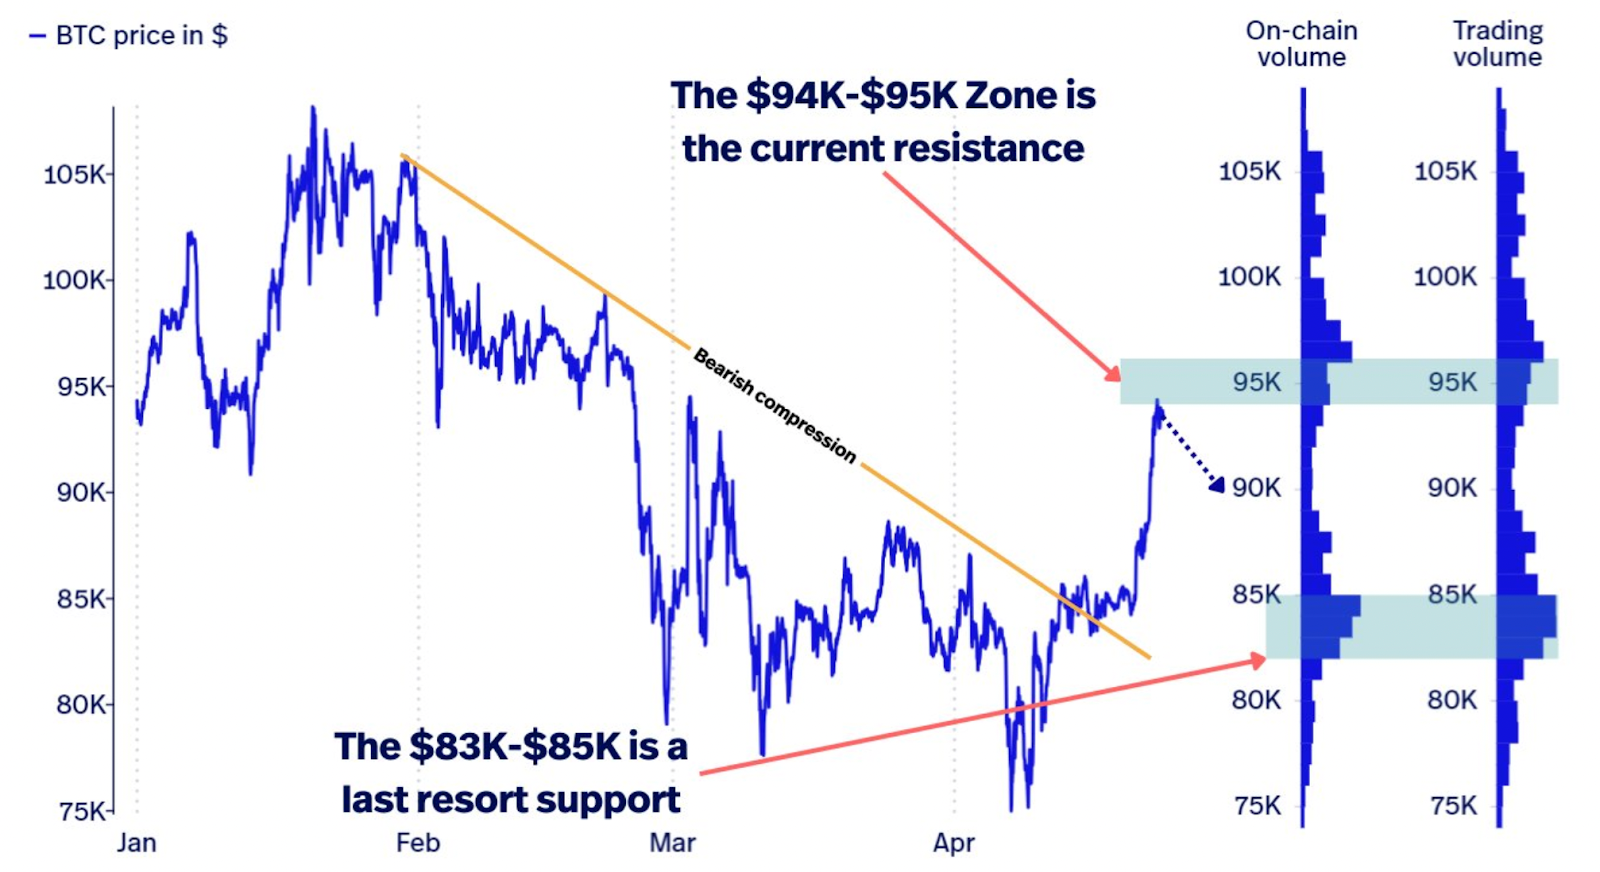
BTC/USD Chart Source: Swissblock
Popular Bitcoin analyst AlphaBTC believes that the asset may consolidate in the $93,000 to $95,000 range, “before pushing up to above $100,000 liquidity.”
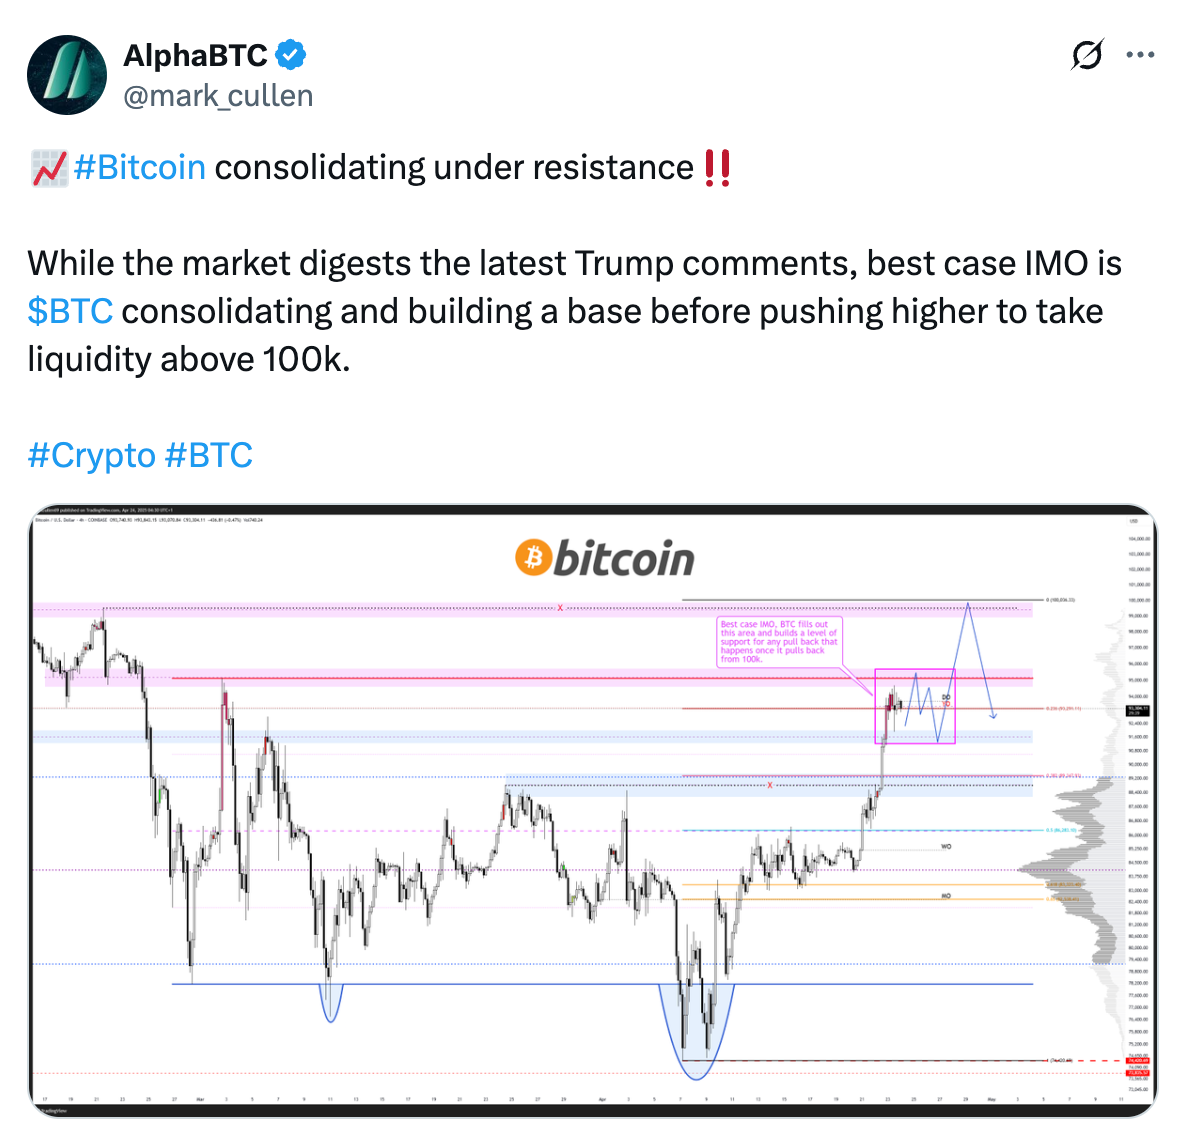
Source: AlphaBTC
Several bullish signs indicate that BTC is expected to break through $95,000 in the coming days or weeks.
Bitcoin ETF Demand Rebounds
One factor supporting the bullish argument for Bitcoin is the resurgence of institutional demand, reflected in significant inflows into Bitcoin spot exchange-traded funds (ETFs).
According to SoSoValue, the net inflow for Bitcoin spot ETFs reached $936 million and $917 million on April 22 and April 23, respectively.
As reported by Cointelegraph, these inflows are the highest levels since January 2025, over 500 times the daily average for 2025.
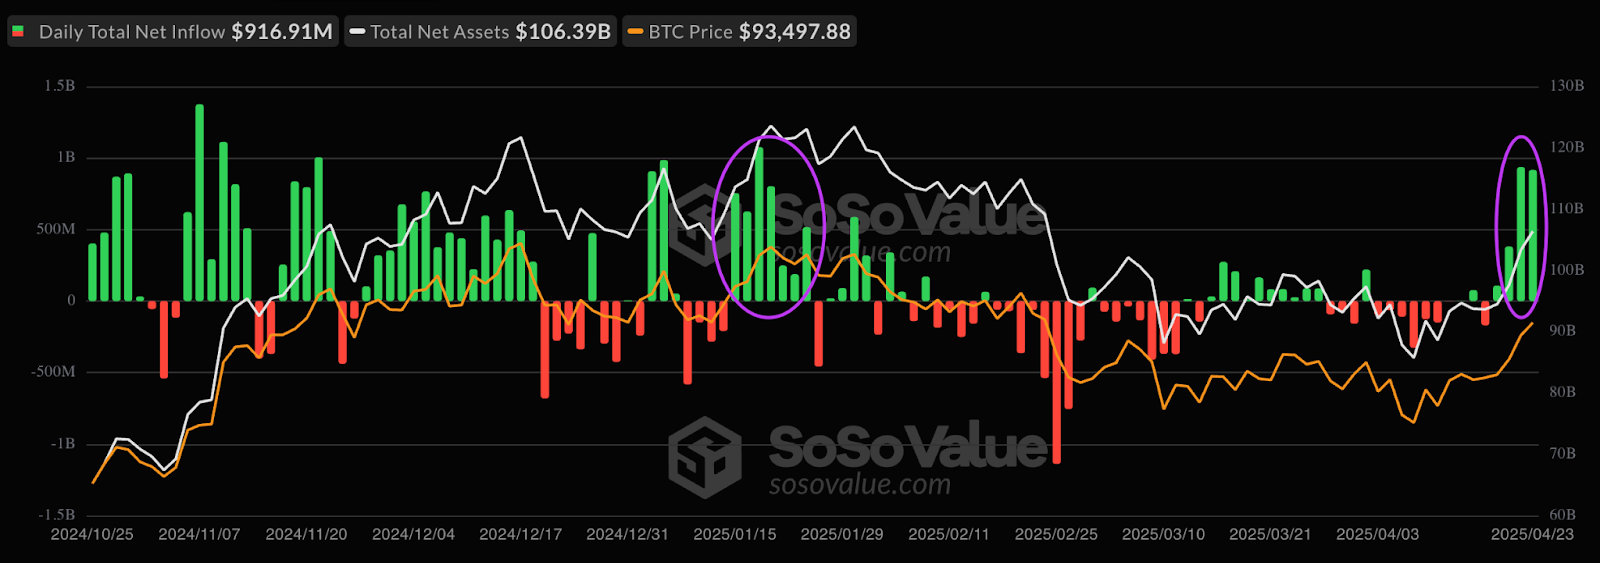
Spot Bitcoin ETF Flows Source: SoSoValue
This trend reflects an increasing confidence among traditional financial participants, as noted by market analyst Jamie Coutts, who pointed out that global liquidity has reached an all-time high, historically driving asset prices up.
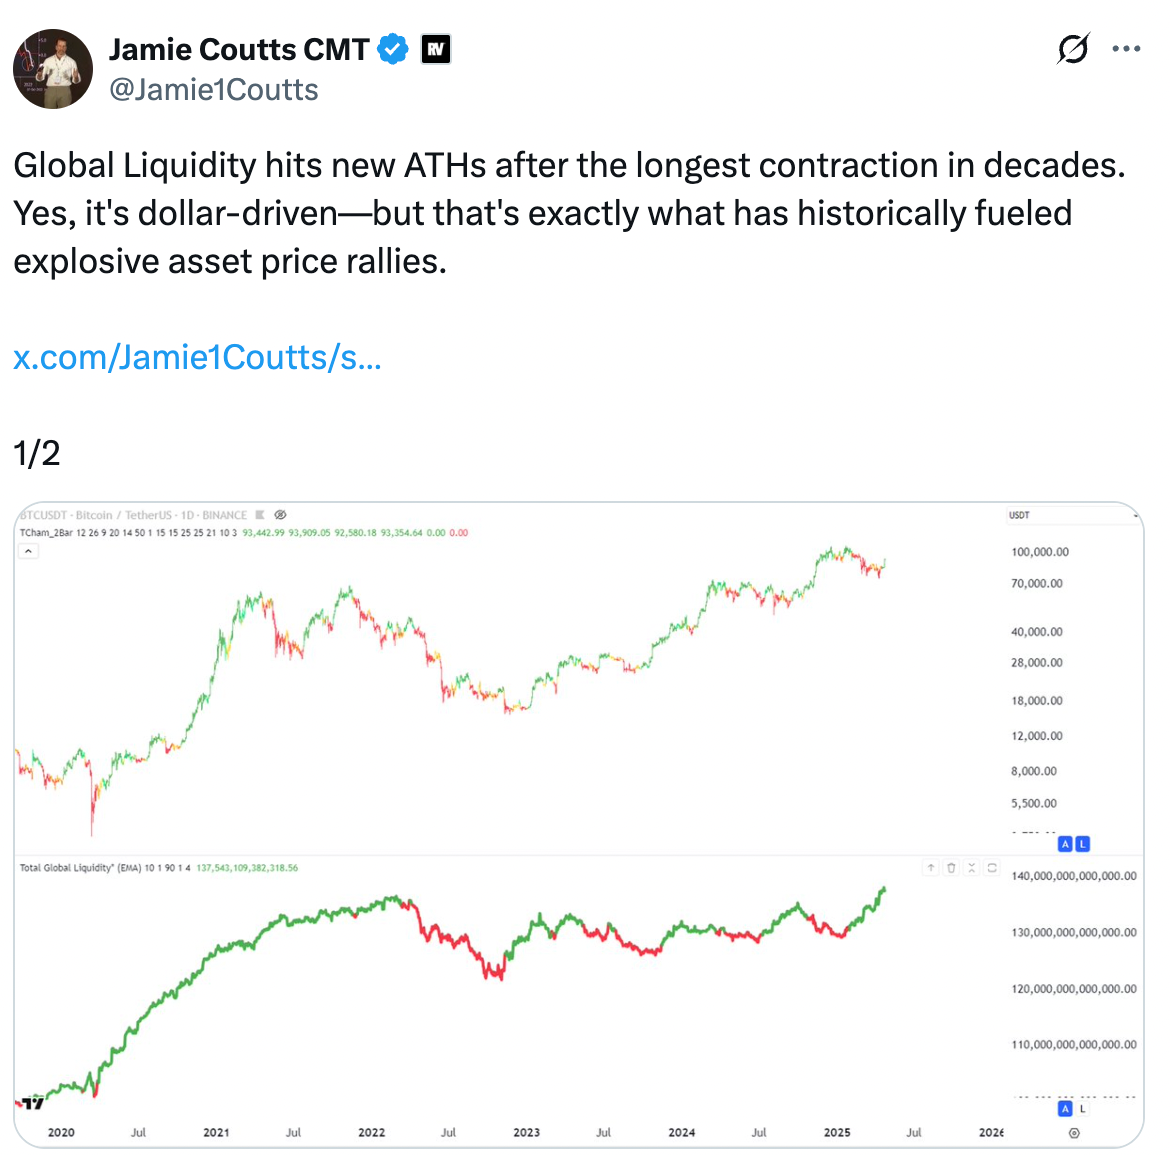
Source: Jamie Coutts
Institutional buying creates sustained upward pressure on Bitcoin's price by absorbing available supply.
Declining Bitcoin Supply on Exchanges
The trend of declining Bitcoin inflows to exchanges continues, indicating that selling pressure may be easing.
According to CryptoQuant, the total amount of Bitcoin transferred to exchanges has decreased from a year-to-date high of 97,940 BTC per day on February 25 to 45,000 BTC per day on April 23.
According to CryptoQuant analyst Axel Adler Jr, the number of addresses depositing Bitcoin into exchanges has also decreased, reinforcing this point, as the number of such addresses “has been steadily declining since 2022.”
He emphasized that the 30-day moving average of this metric has dropped to 52,000 BTC, the lowest level since December 2016.
“This trend itself is bullish,” as it represents a fourfold decrease in coin sales over the past three years, the analyst said, adding:
“Essentially, this represents a growth in HODL sentiment, significantly reducing selling pressure and laying the groundwork for further growth.”
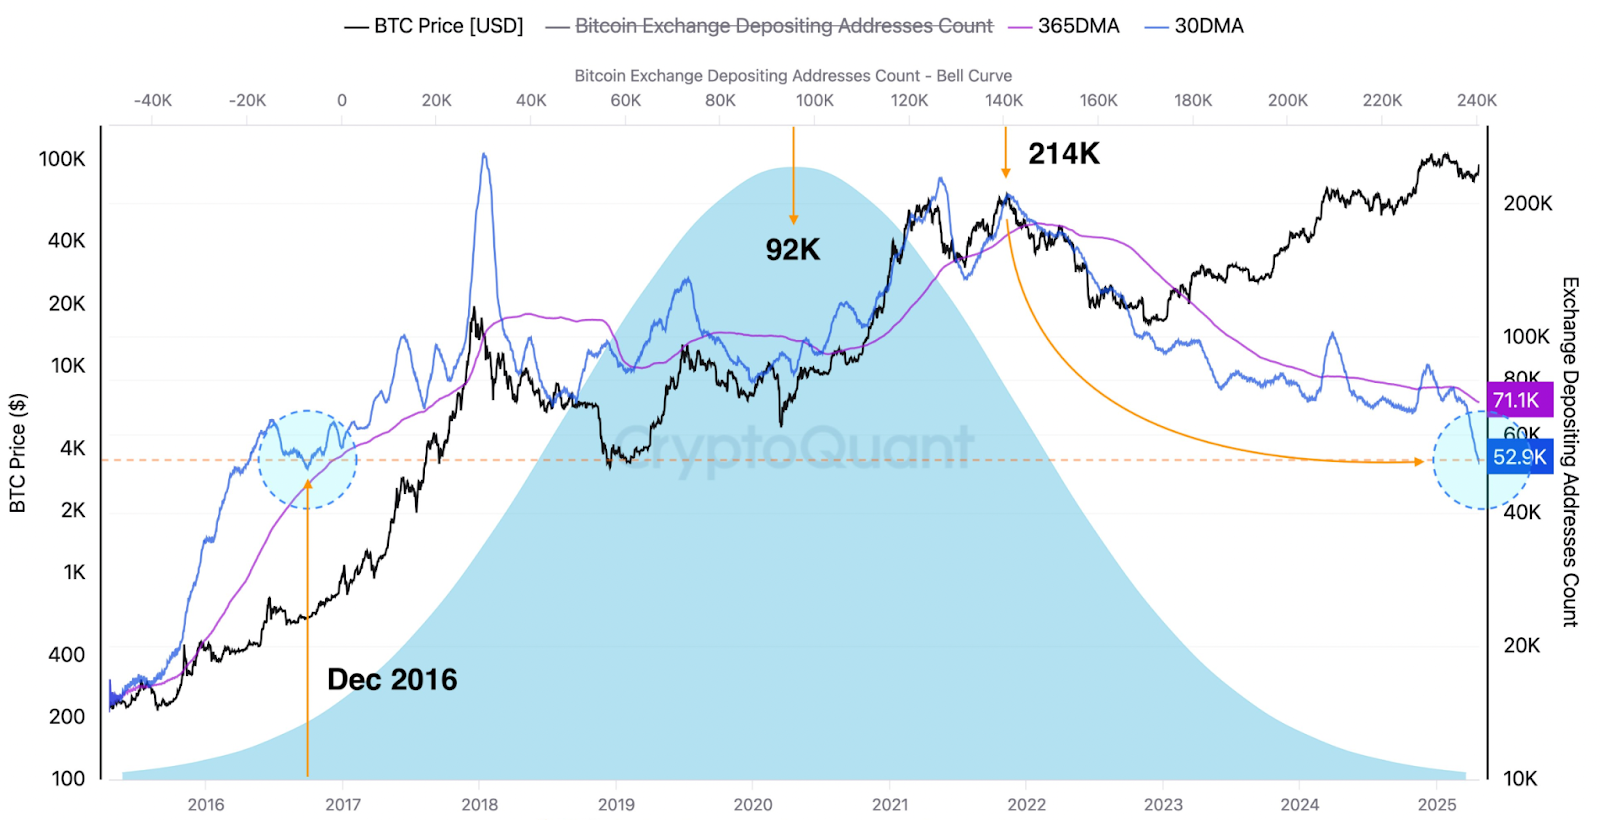
Bitcoin Exchange Deposit Address Count Source: CryptoQuant
Negative Funding Rates May Drive Bitcoin Rebound
Bitcoin prices have rebounded to early March levels, but futures trading has not fully materialized.
Glassnode data shows that despite an 11% increase in Bitcoin prices between April 22 and April 23, the perpetual futures funding rate for Bitcoin remains negative.
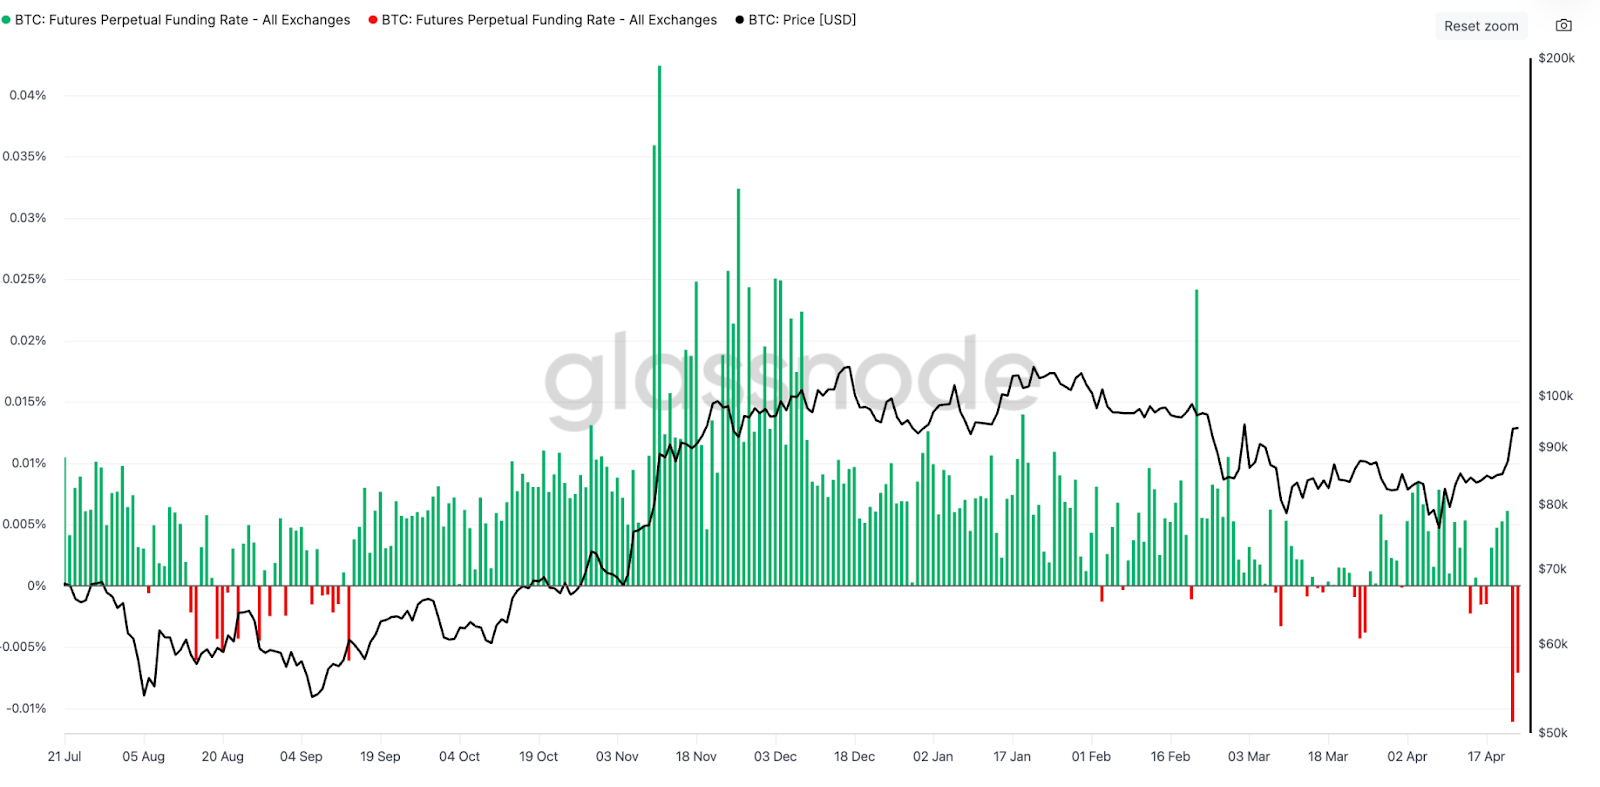
Bitcoin Perpetual Futures Funding Rate Source: Glassnode
A negative funding rate means that shorts are paying longs, reflecting a bearish sentiment that may fuel short squeezes as prices rise.
In a post on X on April 22, CryptoQuant contributor Darkfost highlighted the similar divergence between Bitcoin prices and Binance funding rates.
“Despite BTC continuing to climb, Binance's funding rate has turned negative, around -0.006 at the time of writing,” Darkfost explained.
He added that this situation is rare and has historically led to significant rebounds, such as Bitcoin soaring from $28,000 to $73,000 in October 2023 and from $57,000 to $108,000 in September 2024.
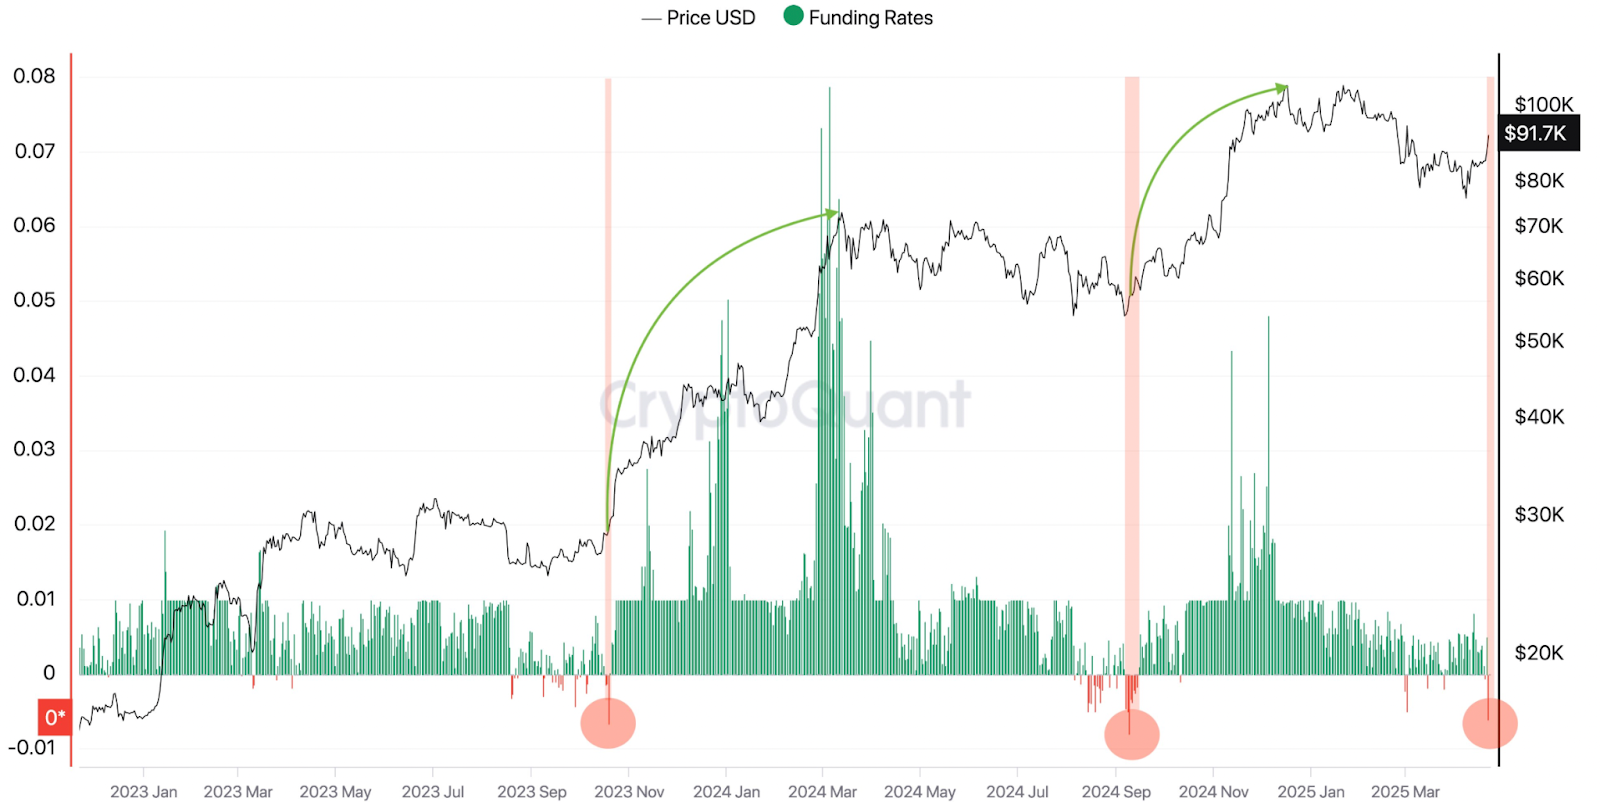
Binance Bitcoin Funding Rate Source: CryptoQuant
If history repeats itself, Bitcoin may rebound from current levels, breaking through the $95,000 resistance level and reaching $100,000.
Bitcoin Trading Above 200-Day SMA
On April 22, Bitcoin prices broke through a key level: the 200-day simple moving average (SMA), currently at $88,690, driving a market-wide recovery.
The last time Bitcoin prices broke above the 200-day simple moving average, it experienced a parabolic rise, increasing 80% from $66,000 on October 14, 2024, to an all-time high of $108,000 on December 17.
When Bitcoin trades above this key trend line, this level should provide significant support. However, if it fails to hold, the next levels to watch may be $84,379, the 50-day simple moving average (SMA), and the psychological level of $80,000.
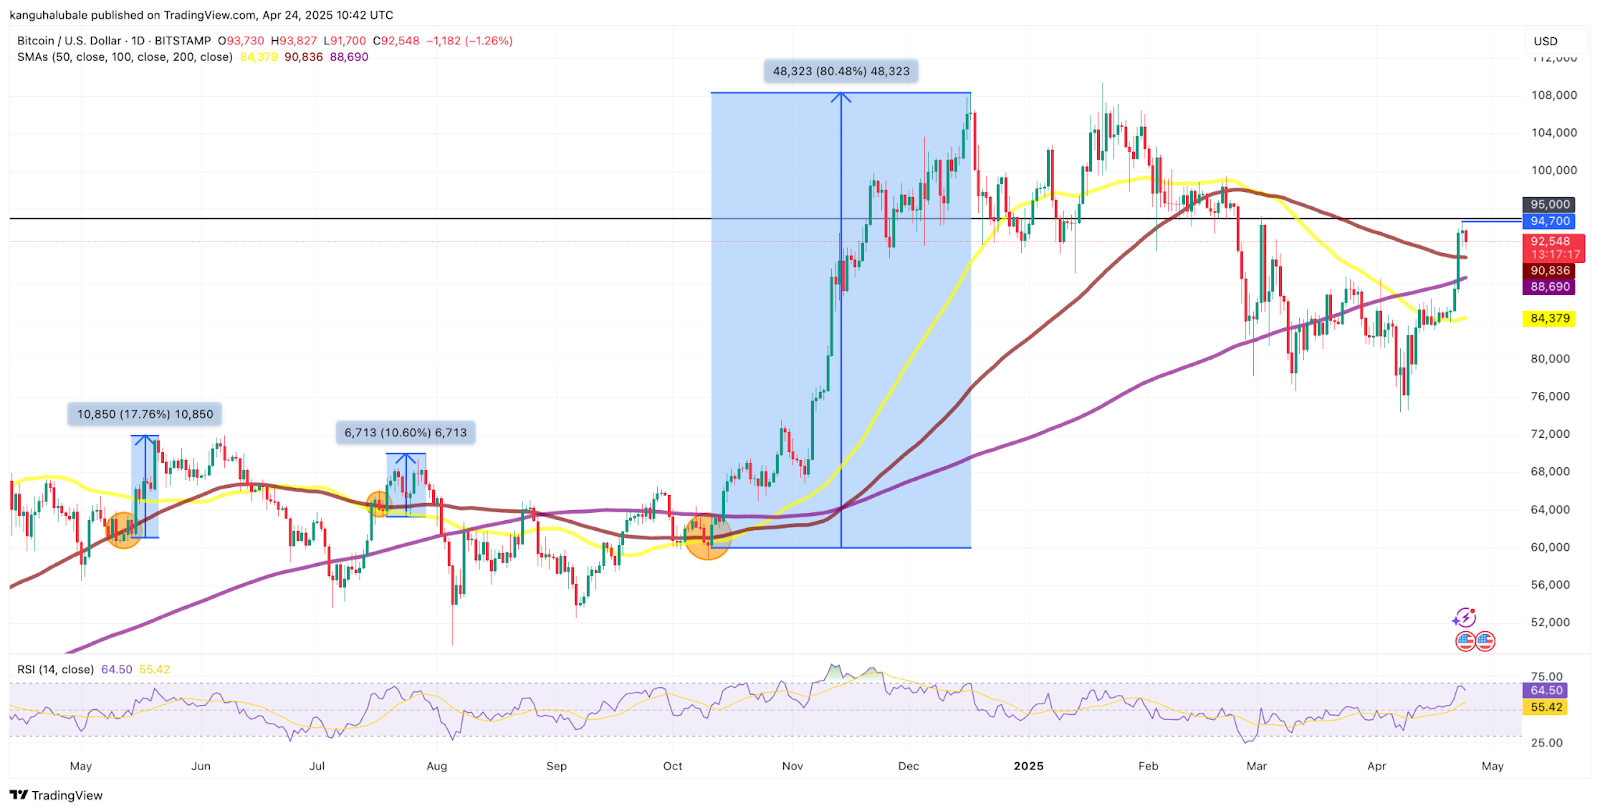
BTC/USD Daily Chart Source: Cointelegraph/TradingView
For bulls, the resistance levels at $95,000 and $100,000 are the main focus. Breaking through this level would pave the way for a new all-time high above $109,000 set on January 20.
This article does not contain investment advice or recommendations. Every investment and trade involves risk, and readers should conduct their own research before making decisions.
Related Articles: Trump Tariff Cuts Boost Bitcoin Price Above $86,000
免责声明:本文章仅代表作者个人观点,不代表本平台的立场和观点。本文章仅供信息分享,不构成对任何人的任何投资建议。用户与作者之间的任何争议,与本平台无关。如网页中刊载的文章或图片涉及侵权,请提供相关的权利证明和身份证明发送邮件到support@aicoin.com,本平台相关工作人员将会进行核查。


