First, look at the larger cycle to determine direction.
Daily level (long-term trend): Overall, it is still in a broad fluctuation structure building a bottom. After the sharp decline at the end of January, the price has been oscillating repeatedly in the range of 60,000 to 70,000. The MA moving average system (MA5, MA10, MA20) has tightly converged, and the price is traversing through the cluster of moving averages, indicating that the bullish and bearish forces are very stalemated in the long-term dimension. The MACD is below the zero axis, but the green bars (macd_bar) are slowly shortening, showing that the downward momentum is diminishing. The RSI is around 41, which is neutral but slightly weak. Therefore, the long-term trend is oscillation, the direction is unclear, waiting for a decision.
4-hour level (medium-term trend): This is where it gets interesting. After a large bullish candle on February 25, the price has formed a high-level oscillation platform in the last few days, roughly between 65,000 and 68,000. However, note that the MA20 moving average (purple line) has begun to flatten and slightly tilt upward, which is a preliminary signal for a potential stabilization in the medium term. However, the MACD has repeatedly crossed above and below the zero axis, and today the latest DIF and DEA have converged again, with the green bars very short, indicating insufficient momentum for upward movement in the medium term, causing fierce competition between bulls and bears.
Then, look at the smaller cycle to find rhythm and key levels.
1-hour level (short to medium-term trend): This is essentially a textbook case of “geopolitical conflict market”. Let’s look at the data: early this morning (UTC time), the price quickly plunged from above 67,000, dipping to around 65,000, which directly corresponds to the news of “Iran firing missiles at US aircraft carriers” and “Trump claiming Khamenei is dead” as the conflict escalated. Subsequently, the price saw a quick rebound in the Asian morning session (around UTC 08:00), recovering most of the lost ground, which again corresponds to news of “conflict possibly seeing a turnaround” and “Gulf countries possibly intervening”. The 1-hour chart clearly shows a “V-shaped” violent oscillation. Currently, the price is around 66,300, constrained by MA5 and MA10, but standing above MA20, forming a pattern of oscillation with resistance above and support below.
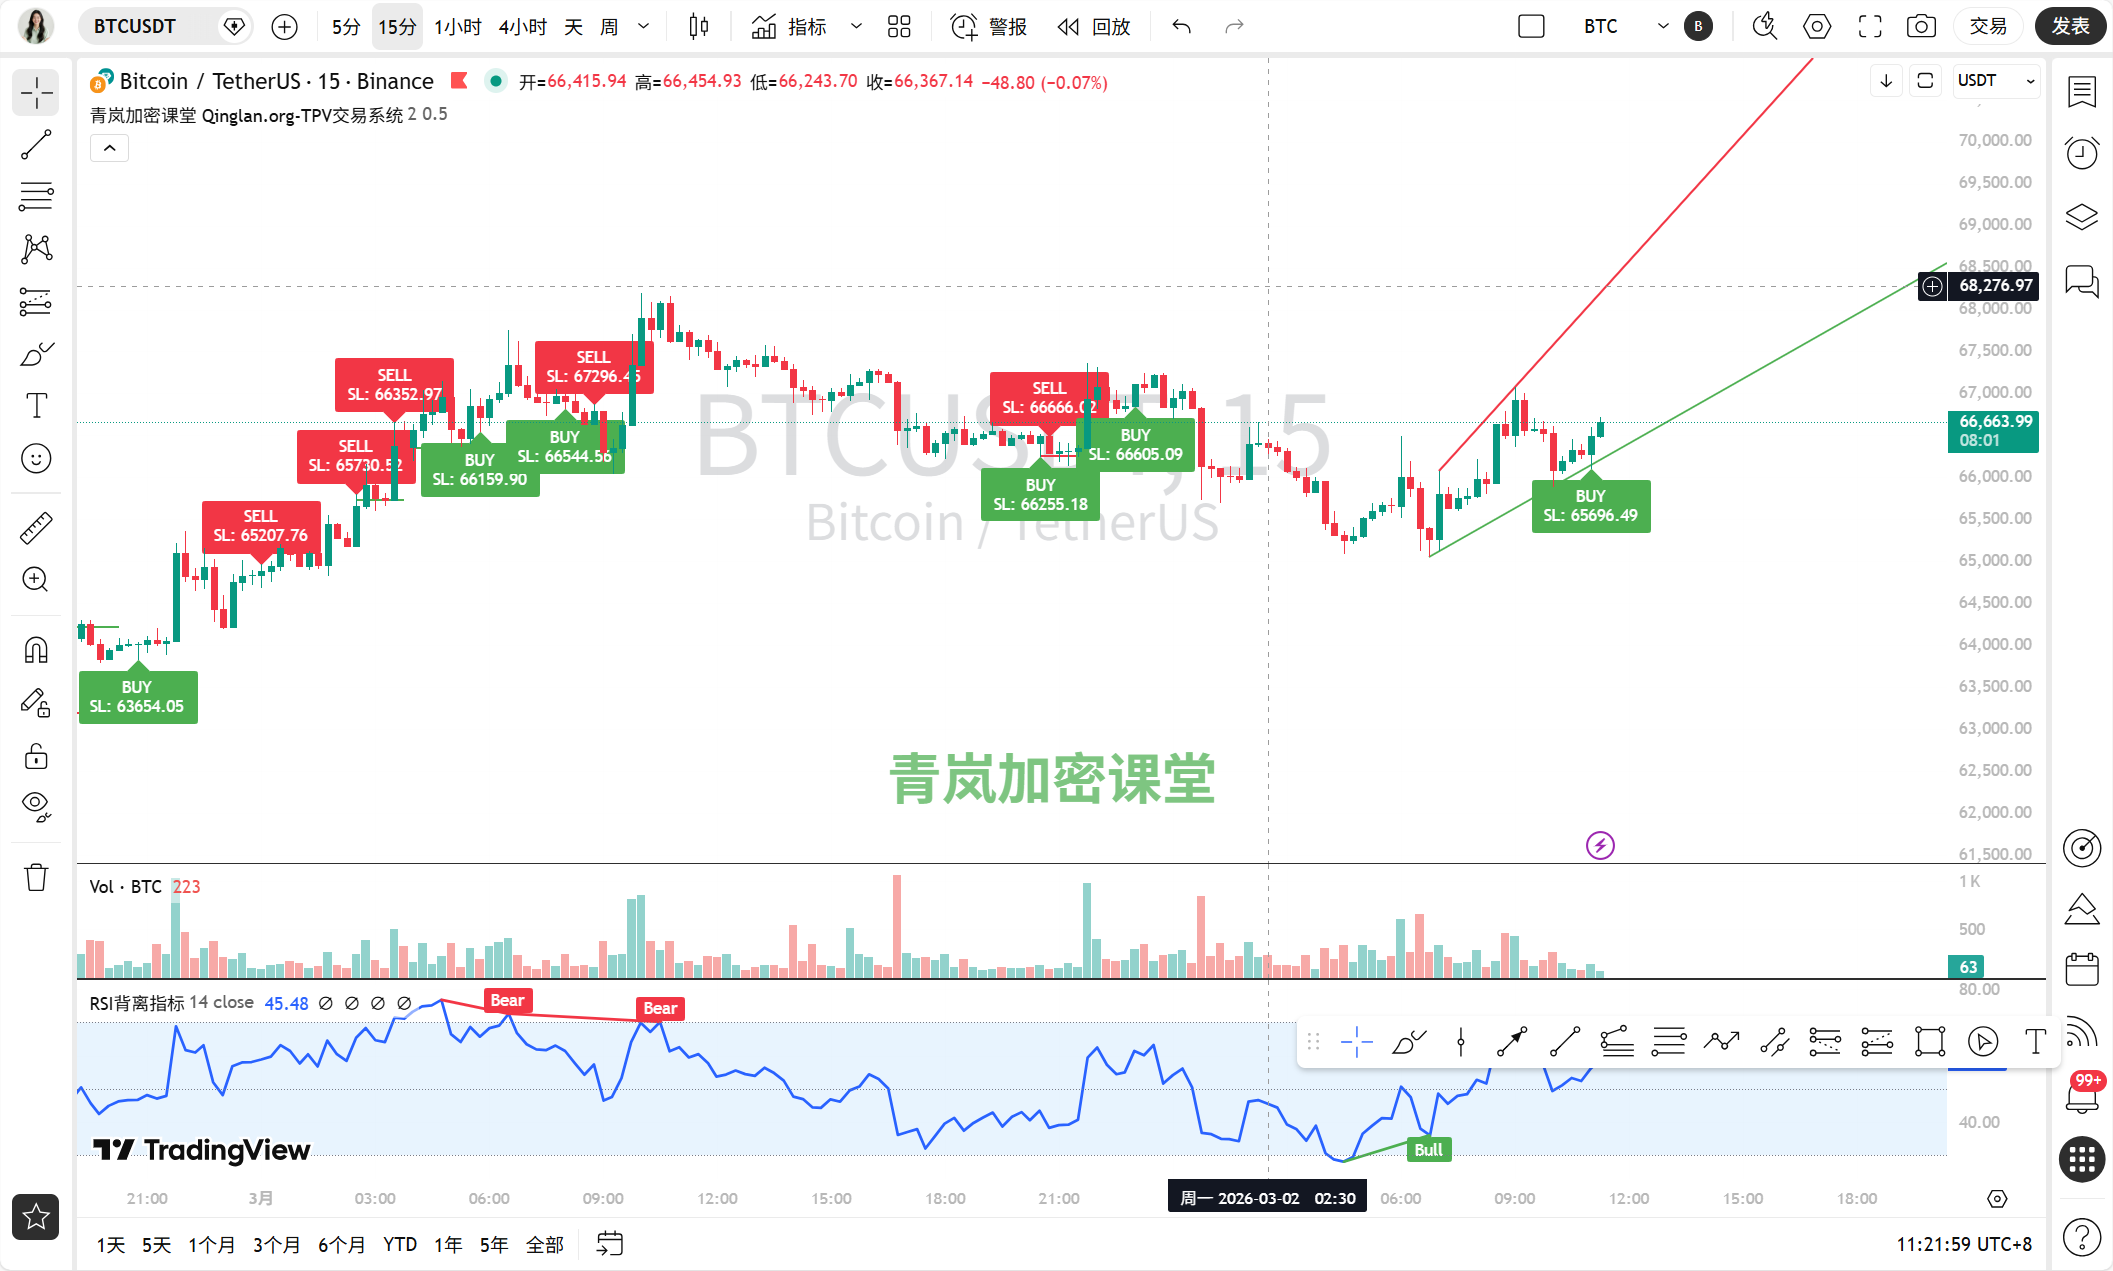
15-minute level (short-term trading rhythm): This is the battlefield under a magnifying glass. It can be observed that during the sharp decline and sharp rise, trading volume (volume) significantly increased, especially with the K line that has a long upper shadow, indicating that there was significant selling pressure encountered during the rise. Currently, the short-term moving averages (MA5, MA10) have again crossed downward, the MACD has formed a death cross above the zero axis and is retreating towards the zero axis, and the RSI is hovering below the 50 midline. Short-term momentum has clearly weakened, leaning towards a correction.
Key support and resistance levels:
Core support area: 65,000 - 65,200 USD. This is the low point area of the sharp drop early this morning and also the lower edge of the oscillation platform in the 4-hour chart. If it breaks, the short-term structure will be damaged, and it may test 64,000 again.
Recent strong resistance: 66,800 - 67,200 USD. This is the high point area of the rebound early this morning and also the cluster of multiple previous small high points at the 1-hour MA60 level.
Upper key resistance: 68,000 USD. This is the upper edge of the 4-hour oscillation platform and is the key threshold determining whether the medium-term can become stronger.
Core impact of news events:
Today's 50 news items, more than one-third are directly related to the US-Iran conflict. This injects tremendous uncertainty and risk-averse sentiment into the market. On one hand, the escalation of the conflict may trigger a global sell-off of risk assets (Bitcoin was once implicated); on the other hand, if the conflict leads to a shift in the Federal Reserve's monetary policy (news 15 mentions “may be forced to cut interest rates”), it could be favorable for assets like Bitcoin in the medium to long term. This contradictory psychology is directly reflected in the market as huge, non-trending fluctuations. Large whales taking profits on long positions (news 5), and changes to a negative funding rate (news 29), all indicate that market sentiment has shifted from previous exuberance to caution, with some bulls even departing.
Comprehensive prediction and trading thoughts:
Based on the above analysis, our prediction is: driven by significant geopolitical events, the market will shift from a "trend-driven rise" to a "high volatility oscillation" phase. In the short term (a few hours to a couple of days), it is highly probable that it will continue to oscillate up and down within the core range of 65,000 - 67,200.
The trading thoughts must be very clear:
Abandon trend trades and embrace oscillation strategies. Near the key support level (65,000-65,200), if a stop-loss signal appears on a smaller time frame (like 15 minutes) (for example, long lower shadows, RSI divergence), a small long position can be taken to bet on a rebound, with a stop-loss set below 64,800, and a target looking at 66,000-66,500.
Near the key resistance level (66,800-67,200), if there is weakness in the upward momentum, shrinking volume, or MACD divergence, a small short position can be attempted, with a stop-loss set above 67,500, and a target looking to pull back to 65,500-66,000.
Be sure to use small positions, as the volatility is extreme, and the stop-loss should be set wider than usual to prevent being stopped out by spikes.
Closely monitor news developments; any major news regarding easing or escalating conflict can instantly break the current oscillation range, requiring quick responses, either to stop-loss or to follow the trend.
In summary: The stormy impact of news has temporarily caused a loss of directional sense in the technical aspect. What we need to do now is not to predict when the storm will end, but to learn how to surf safely in the storm.
More quantifiable breakdowns of the impact of real-time information on market sentiment have been updated in my Qinglan Crypto Class: www.qinglan.org
Today's trading golden sentence for you:
“Maintaining orderly discipline in chaotic fluctuations is the only moat for quantitative traders to navigate through noise and protect their capital.”
免责声明:本文章仅代表作者个人观点,不代表本平台的立场和观点。本文章仅供信息分享,不构成对任何人的任何投资建议。用户与作者之间的任何争议,与本平台无关。如网页中刊载的文章或图片涉及侵权,请提供相关的权利证明和身份证明发送邮件到support@aicoin.com,本平台相关工作人员将会进行核查。