Next, let's combine the technical and news aspects:
Short term (15-minute & 1-hour chart): Oversold rebound, but heavy pressure above
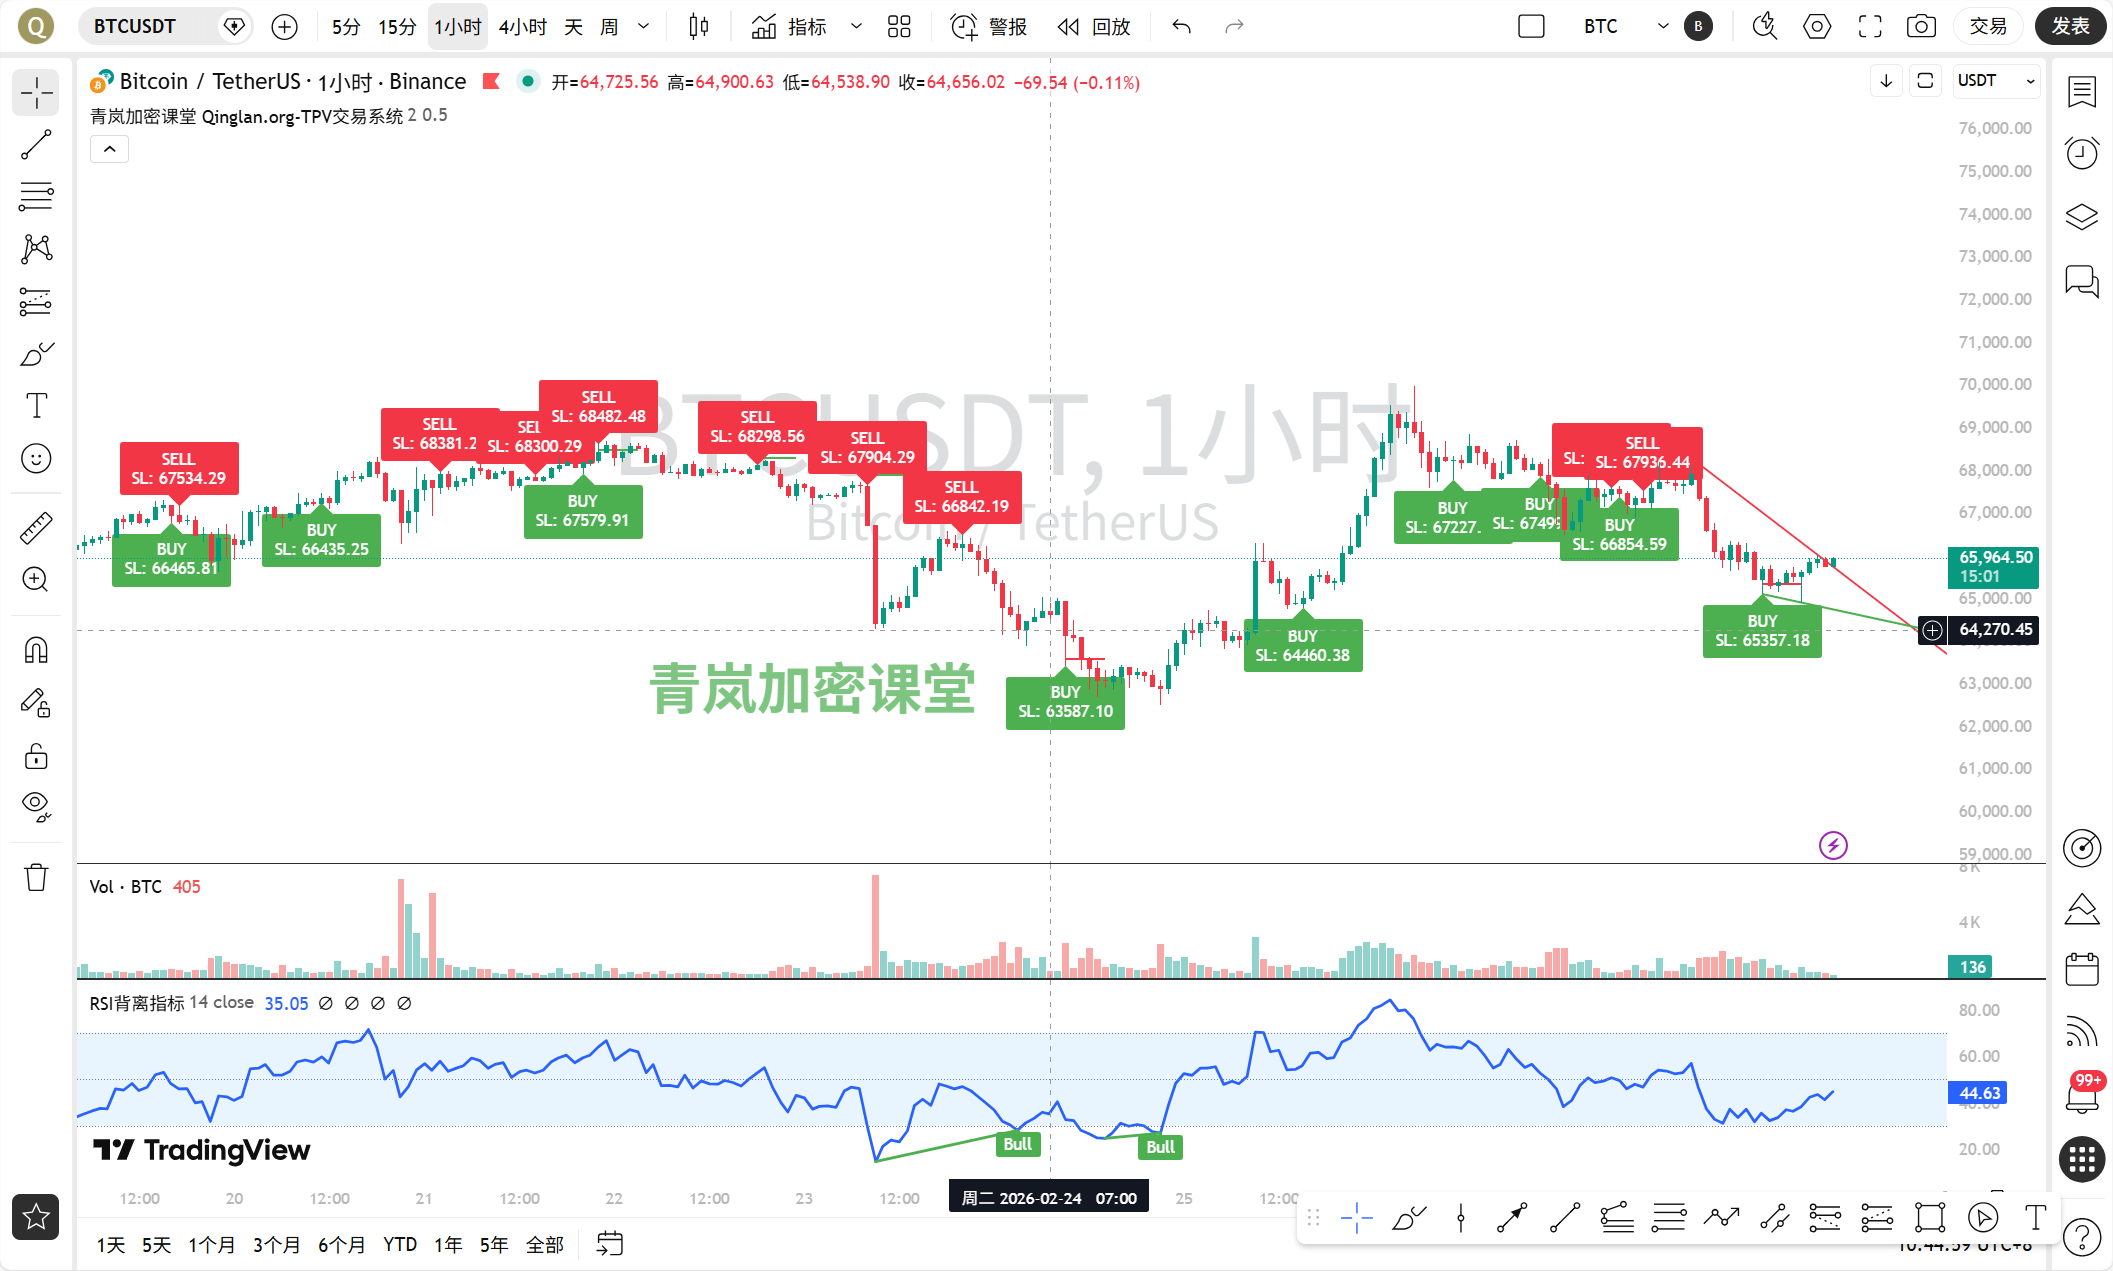
Trend: The 15-minute chart shows that after the price fell to around 65100 last night (the 27th), it started a weak rebound, currently (morning of the 28th) oscillating in the 65800-66000 range. The 1-hour chart is more evident; this rebound hasn't even stabilized above MA10 (around 65800), indicating extreme weakness.
Technical indicators: The RSI for both periods has climbed back from the oversold zone (20-30) to the neutral weak area of 40-50. The MACD shows signs of a golden cross below the zero line, but the momentum bars are still weak. This indicates that the bearish momentum has temporarily exhausted, but the bullish counterattack is insufficient; it belongs to a technical pullback.
Key levels: Short-term resistance is at 66000-66200 (previous small platform and 1-hour MA10), with strong resistance at 66800-67000 (1-hour MA20 and previous dense trading area). The support below is at 65500, followed by the low point of 65100 from last night; the most critical psychological and technical support is at 64500-65000. If this breaks, panic selling may emerge.Medium term (4-hour chart): Weak consolidation in a downtrend
Trend: The 4-hour chart provides clearer insight; the price has been declining from the high of 69500 on February 26 to form a clear descending channel. Currently, the price is struggling near the lower bound of the channel, without any significant rebound.
Technical indicators: The moving average system (MA5, MA10, MA20) shows a perfect bearish arrangement, with price being suppressed by all moving averages. The MACD has continued to diverge after a death cross below the zero line, and although the green bars (negative values) have shortened, they are far from turning positive. The RSI is hovering around 35, belonging to a weak area. The medium-term trend is clearly dominated by the bears.
Key levels: Medium-term strong resistance is at 67500-68000 (4-hour MA20 and upper channel line). The key support below is the extended position of the lower channel line, around 64500-65000, which resonates with short-term support and is crucial.Long term (daily chart): Large cycle adjustment has not ended
Trend: The daily chart shows that BTC has adjusted for one and a half months since the mid-January high of 97000. Currently, the price is operating below all major moving averages (MA5, MA10, MA20) and is in a clear downtrend. The large bullish candlestick on February 25 attempted to reverse the situation but was subsequently engulfed by consecutive bearish candlesticks, indicating that selling pressure remains heavy.
Technical indicators: The daily MACD operates below the zero line, in a death cross state, with long green bars (negative values). The RSI is around 38, still leaving some room before reaching oversold (30). This indicates insufficient long-term buying confidence, and the market is still in the process of seeking a bottom.News interpretation: Bearish sentiment looms
The 50 pieces of news we examined show that the majority reflect a bearish or cautious market sentiment:
Macro bearish: The US PPI data exceeded expectations (news 12, 18), and persistent inflation suppresses interest rate cut expectations, which puts pressure on all risk assets (including Bitcoin).
Market sentiment is low: Headlines like “Bearish bombardment,” “Can it still rise with trend line pressure?” (news 2), “Bitcoin has fallen for five consecutive months” (news 29) reflect market pessimism. The decline of U.S. stocks and cryptocurrency concept stocks (news 10, 24) also dragged down sentiment.
Capital outflows and risks: Large net outflows of BTC from exchanges like Binance (news 34), whale long positions falling below cost price (news 30, 49), and the expiration of large options (news 37) have increased uncertainty in the market.
Scattered bullish news is drowned out: News such as OpenAI receiving massive investments (news 13, 14, 15, 21) and Block increasing BTC holdings (news 25) have a very limited positive impact on prices in the current downtrend.
Overall judgment and trading strategy:
In summary, the short, medium, and long-term trends currently resonate downwards. Although there is a need for oversold rebounds in the short term, the strength is too weak and resembles consolidation in a downtrend. The medium-term descending channel is intact. The long-term is still in a significant adjustment cycle.
Therefore, our forecast is: The market overall leans bearish, and rebounds present opportunities to reduce positions or short. The key focus is whether the 64500-65000 support zone can hold. If it cannot hold, the next target may look towards 62000 or even lower.
Trading strategy (for reference only, strict risk control!):
Aggressive short position: If the price rebounds to the 66500-67000 area (4-hour MA10 or channel midline pressure), and there are signs of stagnation (such as long upper shadows, indicator divergence), consider taking a light short position with a stop loss above 67500, targeting 65500 and 65000.
Key level speculation: Pay close attention to the 64500-65000 support area. If there are clear signs of stopping the decline and stabilizing here (such as a daily candle with a long lower shadow, bullish engulfing on the 4-hour chart, etc.), aggressive traders can consider a light position for a rebound, but must enter and exit quickly with a stop loss below 64000. The cautious ones can wait for the price to effectively stabilize at 67000 (breaking the descending channel) before considering a turn.
Wait-and-see strategy: In the current intense battle between bulls and bears, with an unclear direction (referring to an effective breakout of key levels), holding assets and observing or maintaining low positions is the most prudent choice. Do not casually catch the “falling knife.”
More quantitative breakdowns of the real-time news impact on market sentiment have been updated in my Qinglan Crypto Classroom: www.qinglan.org
Finally, here's a trading quote for everyone:
“The trend is your friend, but do not get overly sentimental and embrace it before it clearly turns.” Currently, the trend's friend clearly does not intend to shake hands with us. Let’s be patient and wait for the market to reveal itself.
免责声明:本文章仅代表作者个人观点,不代表本平台的立场和观点。本文章仅供信息分享,不构成对任何人的任何投资建议。用户与作者之间的任何争议,与本平台无关。如网页中刊载的文章或图片涉及侵权,请提供相关的权利证明和身份证明发送邮件到support@aicoin.com,本平台相关工作人员将会进行核查。


