Let’s first look at the technical aspect, blending the four cycles together for a clearer context.
Short-term (15-minute chart): Fluctuating repair, but lacking momentum.
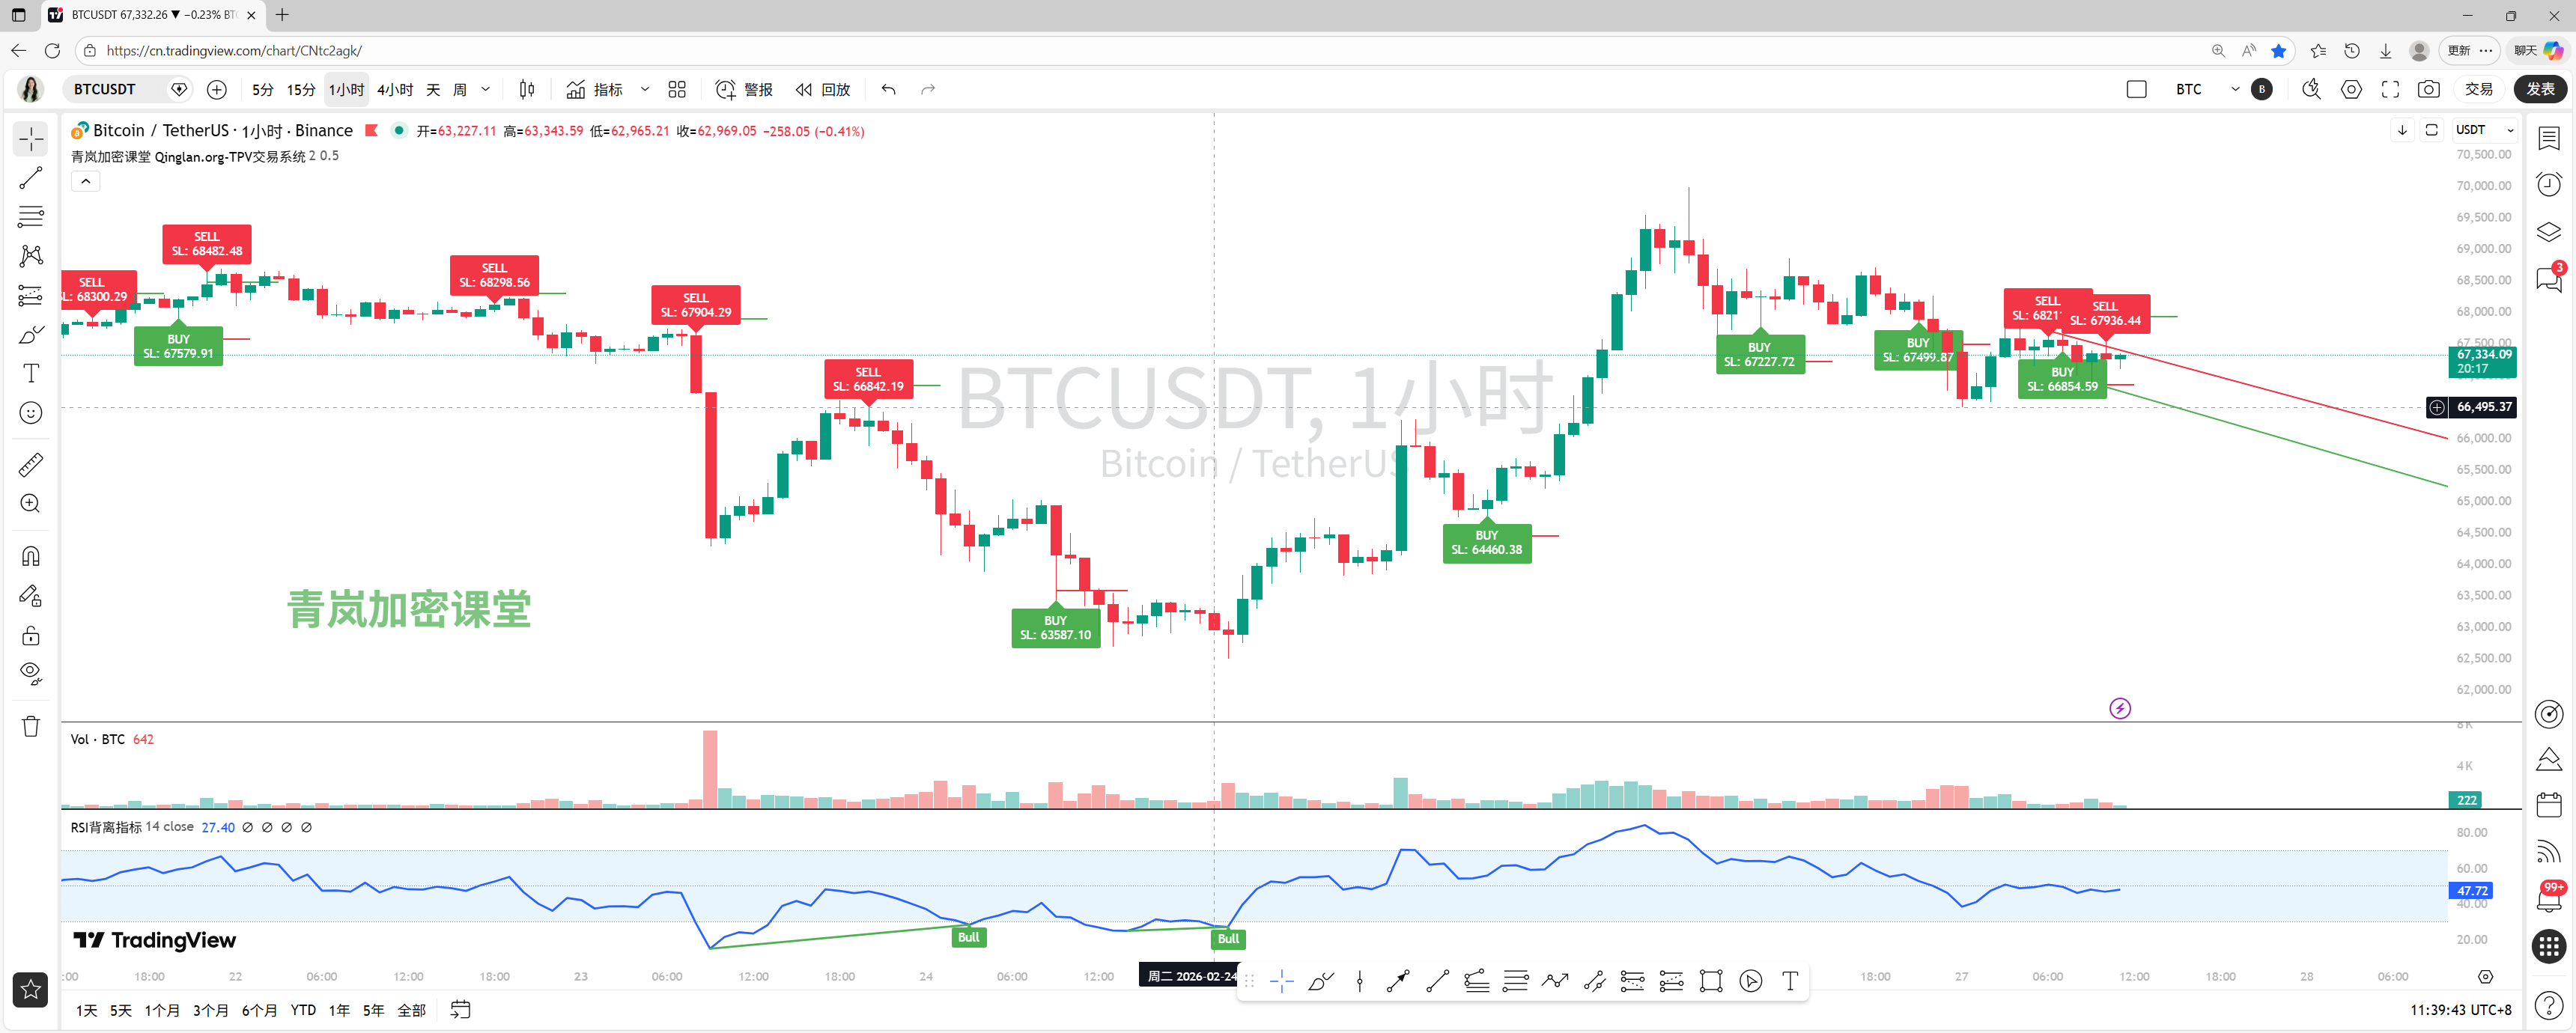
After the sharp drop last night (26th, hitting a low around 66500), the price has entered a slow climbing channel, currently fluctuating within a narrow range of 67200-67600. The MACD formed a golden cross below the zero axis, and the green bars are shortening, indicating a weakening of the downward momentum and a demand for a rebound. However, the RSI has been hovering below 50 (latest at 47.22), indicating a weak rebound. The MA moving averages (5, 10, 20) are converging around 67400, forming short-term resistance. In simple terms, the 15-minute level is a weak consolidation after an oversold condition, with no strong reversal signals observed yet.
Mid-term (1-hour & 4-hour charts): Rebound against the trend of pullback.
The story in these two cycles is quite consistent: both experienced a strong upward rise (peaking at over 69500 on the 25th-26th), followed by a quick retreat. Currently, the MA moving averages on the 1-hour chart are in a bearish arrangement (price below all moving averages), after the MACD formed a dead cross above the zero axis, with the fast and slow lines now crossing below the zero axis. Although the green bars (in fact negative) are shortening, they are still expanding, clearly indicating a bearish trend. The 4-hour chart shows slightly better conditions, with the price above the MA20 moving average (around 65800), but the MACD's red bars are also shortening, and the fast and slow lines are converging at a high position, indicating an adjustment after the exhaustion of upward momentum. Key resistance is in the 68500-69000 range (previous highs and moving average pressure), and key support is at 66500 (recent lows) and 65800 (4-hour MA20 lifeline).
How to interpret the news aspect?
The news aspect is very lively, with a mix of bulls and bears, but overall it tends towards “cautious sentiment” and “structural adjustment”.
Positive factors: Traditional big institutions like Morgan Stanley are laying out BTC custody and lending services (news 2, 22), there is continued inflow of funds into Bitcoin ETFs in the US (news 49), and potential benefits from blockchain regulatory bills (news 17, 18) are all fundamental supports in the medium to long term.
Negative factors and risks: Short-term market sentiment is clearly under pressure. Funding rates have fully turned bearish (news 10), and the Crypto Fear Index is at “extreme fear” (news 12), indicating pessimistic sentiment among retail and leveraged markets. Meanwhile, the actions of whales and large holders show divergence, with large-scale BTC long positions (news 13), as well as ETH whales cashing out for repayments (news 25), plus insider trading exposures (news 1, 41) undermining market confidence. The most concerning issue is the discussions about warnings of large-scale short liquidations (news 5, 6) and price discovery black box (news 4), which indicate that the market structure is weak and susceptible to sharp fluctuations due to large orders or ETF fund flows.
Comprehensive prediction and trading thoughts:
Now, by combining both the technical and news facets, my conclusion is: the upward structure in the medium to long term (daily, 4-hour) has not been disrupted, but in the short term (1-hour, 15-minute) we are clearly in a pullback and fluctuation period, and market sentiment is weak, making volatility likely to increase.
Therefore, our prediction is: in the short term (next 1-3 days), it is highly probable to continue fluctuating within the large range of 65500-68500, digesting selling pressure and panic sentiment to accumulate energy for the next directional choice. The possibility of a direct V-shaped reversal reaching new highs is low.
The specific trading thoughts can be structured as follows:
Short-term traders (bearish or fluctuation thinking): can focus on the region of 67500-67800. If the 15-minute chart shows signs of stagnation (such as long upper shadows, RSI divergence), combined with the 1-hour moving average resistance, consider light short positions, placing stop loss above 68300, targeting the support zone of 66500-66800. Conversely, if the price stabilizes after dropping to the support zone of 66500-65800, consider light long positions to bet on a rebound.
Medium to long-term traders (bullish thinking): need more patience. The ideal point for adding positions or entry is in the strong support area of 65500-65000 on the daily chart. If the price can pull back to this level and show obvious signs of stop and stabilization (like a long lower shadow on the daily line, 4-hour MACD bottom divergence), it will be a very high risk-reward bullish opportunity. It is not advisable to aggressively chase long positions before the price effectively breaks through and stabilizes above 68500.
For more detailed quantitative dissection of how real-time information impacts market sentiment, it has been updated in my Qinglan Crypto Classroom: www.qinglan.org
Finally, I would like to share a trading quote that has deeply resonated with me today, to encourage everyone: “The market builds a bottom in fear, rises in hesitation, and peaks in enthusiasm. The current mix of bulls and bears along with extreme fear may very well be the prelude to the next market trend.” We must remain calm, and patiently wait for the market to give clearer signals.
免责声明:本文章仅代表作者个人观点,不代表本平台的立场和观点。本文章仅供信息分享,不构成对任何人的任何投资建议。用户与作者之间的任何争议,与本平台无关。如网页中刊载的文章或图片涉及侵权,请提供相关的权利证明和身份证明发送邮件到support@aicoin.com,本平台相关工作人员将会进行核查。


