The oscillation is not over! Over 64,700 is the dividing line for shorts,key market forecast simulation
During this time, our analytical ideas and views have generally aligned with the market trends.
Let's review: After the previous bottom formed a V-rebound, I clearly stated that this kind of V-rebound would not directly reverse all cycles, so it is highly likely that there will be another downward retest. At the same time, the probability of breaking the previous low on this second exploration is small; it is more likely that after not breaking the previous low, the market will move into a period of oscillation upward.
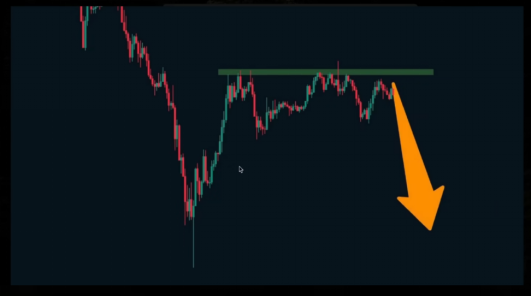
Therefore, on the 10th, we emphasized that after confirming the pressure at this position, we need to look for a new short-term downward segment, pointing out that the market might enter an adjustment period. So far, the market is indeed still in an adjustment phase, which is consistent with our judgment at that time.
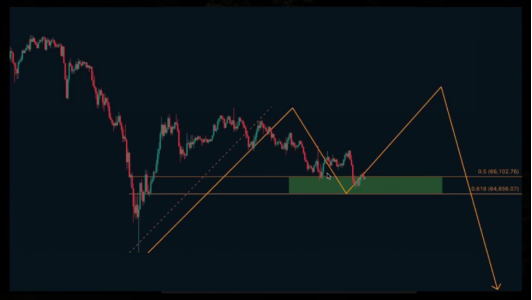
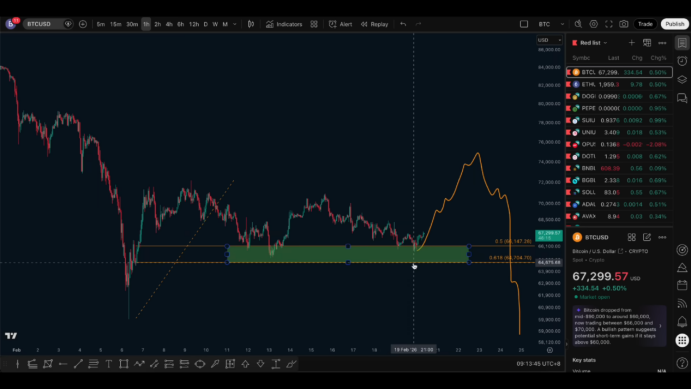
Subsequently, on the 13th, we provided the support range below. In just three days, the price fell back into this support area from the upper pressure level. How was this support judged? The key is to look at the pullback range of the previous upward phase—50% to 0.618 range.
Among them:
50% is considered a medium-axis pullback, usually seen as a healthy pullback.
0.618 is the golden ratio.
Therefore, this area is regarded as a key support range. Generally, this area will provide some support; if it effectively breaks down, there is a high probability that the downward trend will continue and new lows will be created.
The actual trend is: the price received some support within this oscillating range; our expectation at that time was also to see a rebound first and pay attention to whether it breaks the previous high. However, the market did not break the previous high, but formed a lower second high, and then fell back again.
At that time, I also pointed out: If the key support below is retested and stabilized, the market may move into a "two-phase upward" (upward→pullback→re-upward→break previous high→re-fall). But the reality is that this key support was eventually broken, so we see the subsequent standard bearish arrangement—swing highs and lows continuously moving down.
Therefore, since the support was broken, we have maintained a short-term bearish outlook, continuing to seek a move towards previous lows, and this judgement continued until yesterday.
Current Structure Judgment
Yesterday, my core viewpoint was: Bitcoin's oscillation has not yet ended.
Subsequent movements are likely to repeatedly oscillate within the “previous high—previous low” broad range, with possible patterns being:
Divergent oscillation
Convergent oscillation
Or repeated tugging within the range
The overall conclusion is just one: the oscillation is not over.
Two Main Path Expectations
Path One (I think it's more reasonable):
First oscillate upward
Break previous high (liquidate shorts)
Then shift to a new downward phase
Path Two:
First break the previous low
But there won’t be a direct one-sided downward movement
It is likely to first rebound a bit
Then continue the bearish trend
Even if the previous low breaks, it is not recommended to directly chase shorts, because in an oscillating structure, it often bounces back first after breaking.
Two Bearish Layout Ideas
1 After the high is broken, build up short positions in batches
2 After the low is broken, wait for the rebound to go short
Among these, the second option will most likely only form a "second high" rather than breaking the previous high again.
Current Key Positions on the Chart
My core viewpoint continues to remain unchanged.
I still focus on the 0.5—0.618 range of this entire pullback, which is still the most visible effective support zone.
Key price reference:
Around 0.618: approximately 64,700
As long as the price does not effectively break below 64,700, there remains hope to stabilize in this area and create a rebound. After breaking the previous high, it can then begin a new downward trend. This movement would actually be more conducive to the continuation of the bearish trend in the future.
Additionally, it should be noted:
This round of V-rebound has a larger space
Usually indicates that the oscillation cycle will not be too short
Reference for the previous round of oscillation lasted about one and a half months
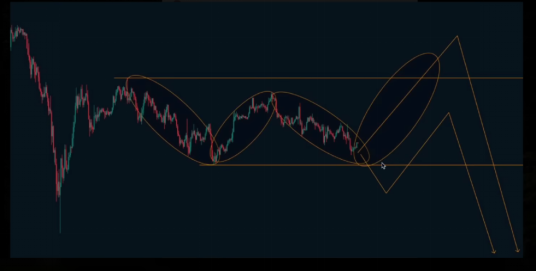
Therefore, I still lean towards:
The probability of a direct one-sided trend continuing is low
Repetitive oscillation is the main tone
The rhythm is highly likely to be:
Oscillate downward → rebound upward → oscillate downward again → rebound again
Short-term Long Position Strategy
The current price has entered the key support area below, and we can consider:
Plan A (aggressive):
Play a short long position in the support zone
Defense position: 64,700
Target: Look for a breakthrough above the previous high
This is a short-long opportunity within a purely oscillating structure.
Two More Robust Entry Plans
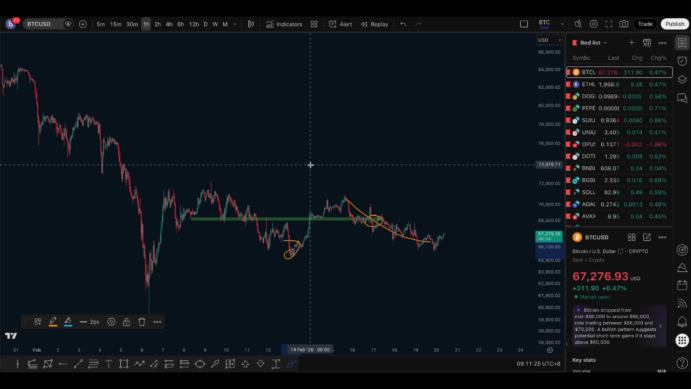
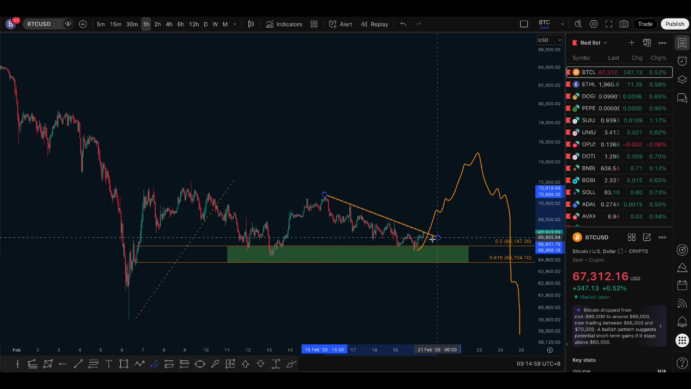
✅ Plan One: Trendline Breakout Long
Currently, it is in a standard downward channel, and the high around 67,300 is testing the downward trendline (the 4th test).
If there is:
An effective upward breakout of the trendline
Then consider entering a long position:
Defense position: previous low
✅ Plan Two: Long Again in the Retracement Support Zone
If pressured near the trendline, the price falls back:
Wait for the price to re-test the support zone
Distribute in batches within the range
Defense position: 64,700
Follow me, join the community , Let's progress together.

免责声明:本文章仅代表作者个人观点,不代表本平台的立场和观点。本文章仅供信息分享,不构成对任何人的任何投资建议。用户与作者之间的任何争议,与本平台无关。如网页中刊载的文章或图片涉及侵权,请提供相关的权利证明和身份证明发送邮件到support@aicoin.com,本平台相关工作人员将会进行核查。


