Author: Frank, PANews
How hard is it to find a profitable "golden key" in prediction markets?
On social media, you often see many people claiming to have discovered a secret for making money with smart money, but in reality, they are without substance. What people can see are just the growth curves of returns from this smart money, rather than the logic behind it.
How should one construct a unique personal trading strategy suitable for prediction markets?
Taking the BTC 15-minute prediction market as an example, PANews analyzed nearly 27.73 million transactions and 3082 window periods over the past month, arriving at some conclusions that may break conventional understanding. In a previous article, we already analyzed the macro data of this market. This time, we will delve deeper to search for that potential "golden key".
Illusion shattered: The complete failure of K-line technical analysis
Have you ever considered a strategy that views prediction markets in the same trade logic as stocks or cryptocurrencies, achieving a trading strategy completely detached from BTC market conditions by purely analyzing different entry points and exit prices combined with position management, profit-taking, and stop-loss elements?
In the traditional crypto market, this trading method is referred to as the "technical analysis" school. In theory, this approach should also work for prediction markets. Therefore, PANews simulated in this direction and created a prediction market backtesting simulation system, which can calculate the actual profit and loss ratios, win rates, and other elements of this strategy from over 3000 markets in the past 30 days by inputting entry points, take-profit points, stop-loss points, timing of entry, and excluding interference prices.
Initially, with incomplete data (Polymarket's historical data provides only 3500 entries per market), the backtesting results could easily find profitable answers, such as entering at 60% of the price, selling at 90%, and setting a stop-loss at 40%, while conducting trades within a certain window period.
But the actual results were vastly different; under real execution, the earnings curve was a slow decline akin to a dull knife cutting meat. Thus, we attempted to fill the data gaps as much as possible, and after experiencing various plans, we ultimately achieved pricing information data for all markets, and this time, the results finally began to align with reality.
Under actual data conditions, PANews simulated 690 combinations of factors including price, take-profit and stop-loss, timing of entry, interference exclusion, and slippage, and the final result was that no strategy could achieve a positive expected return.
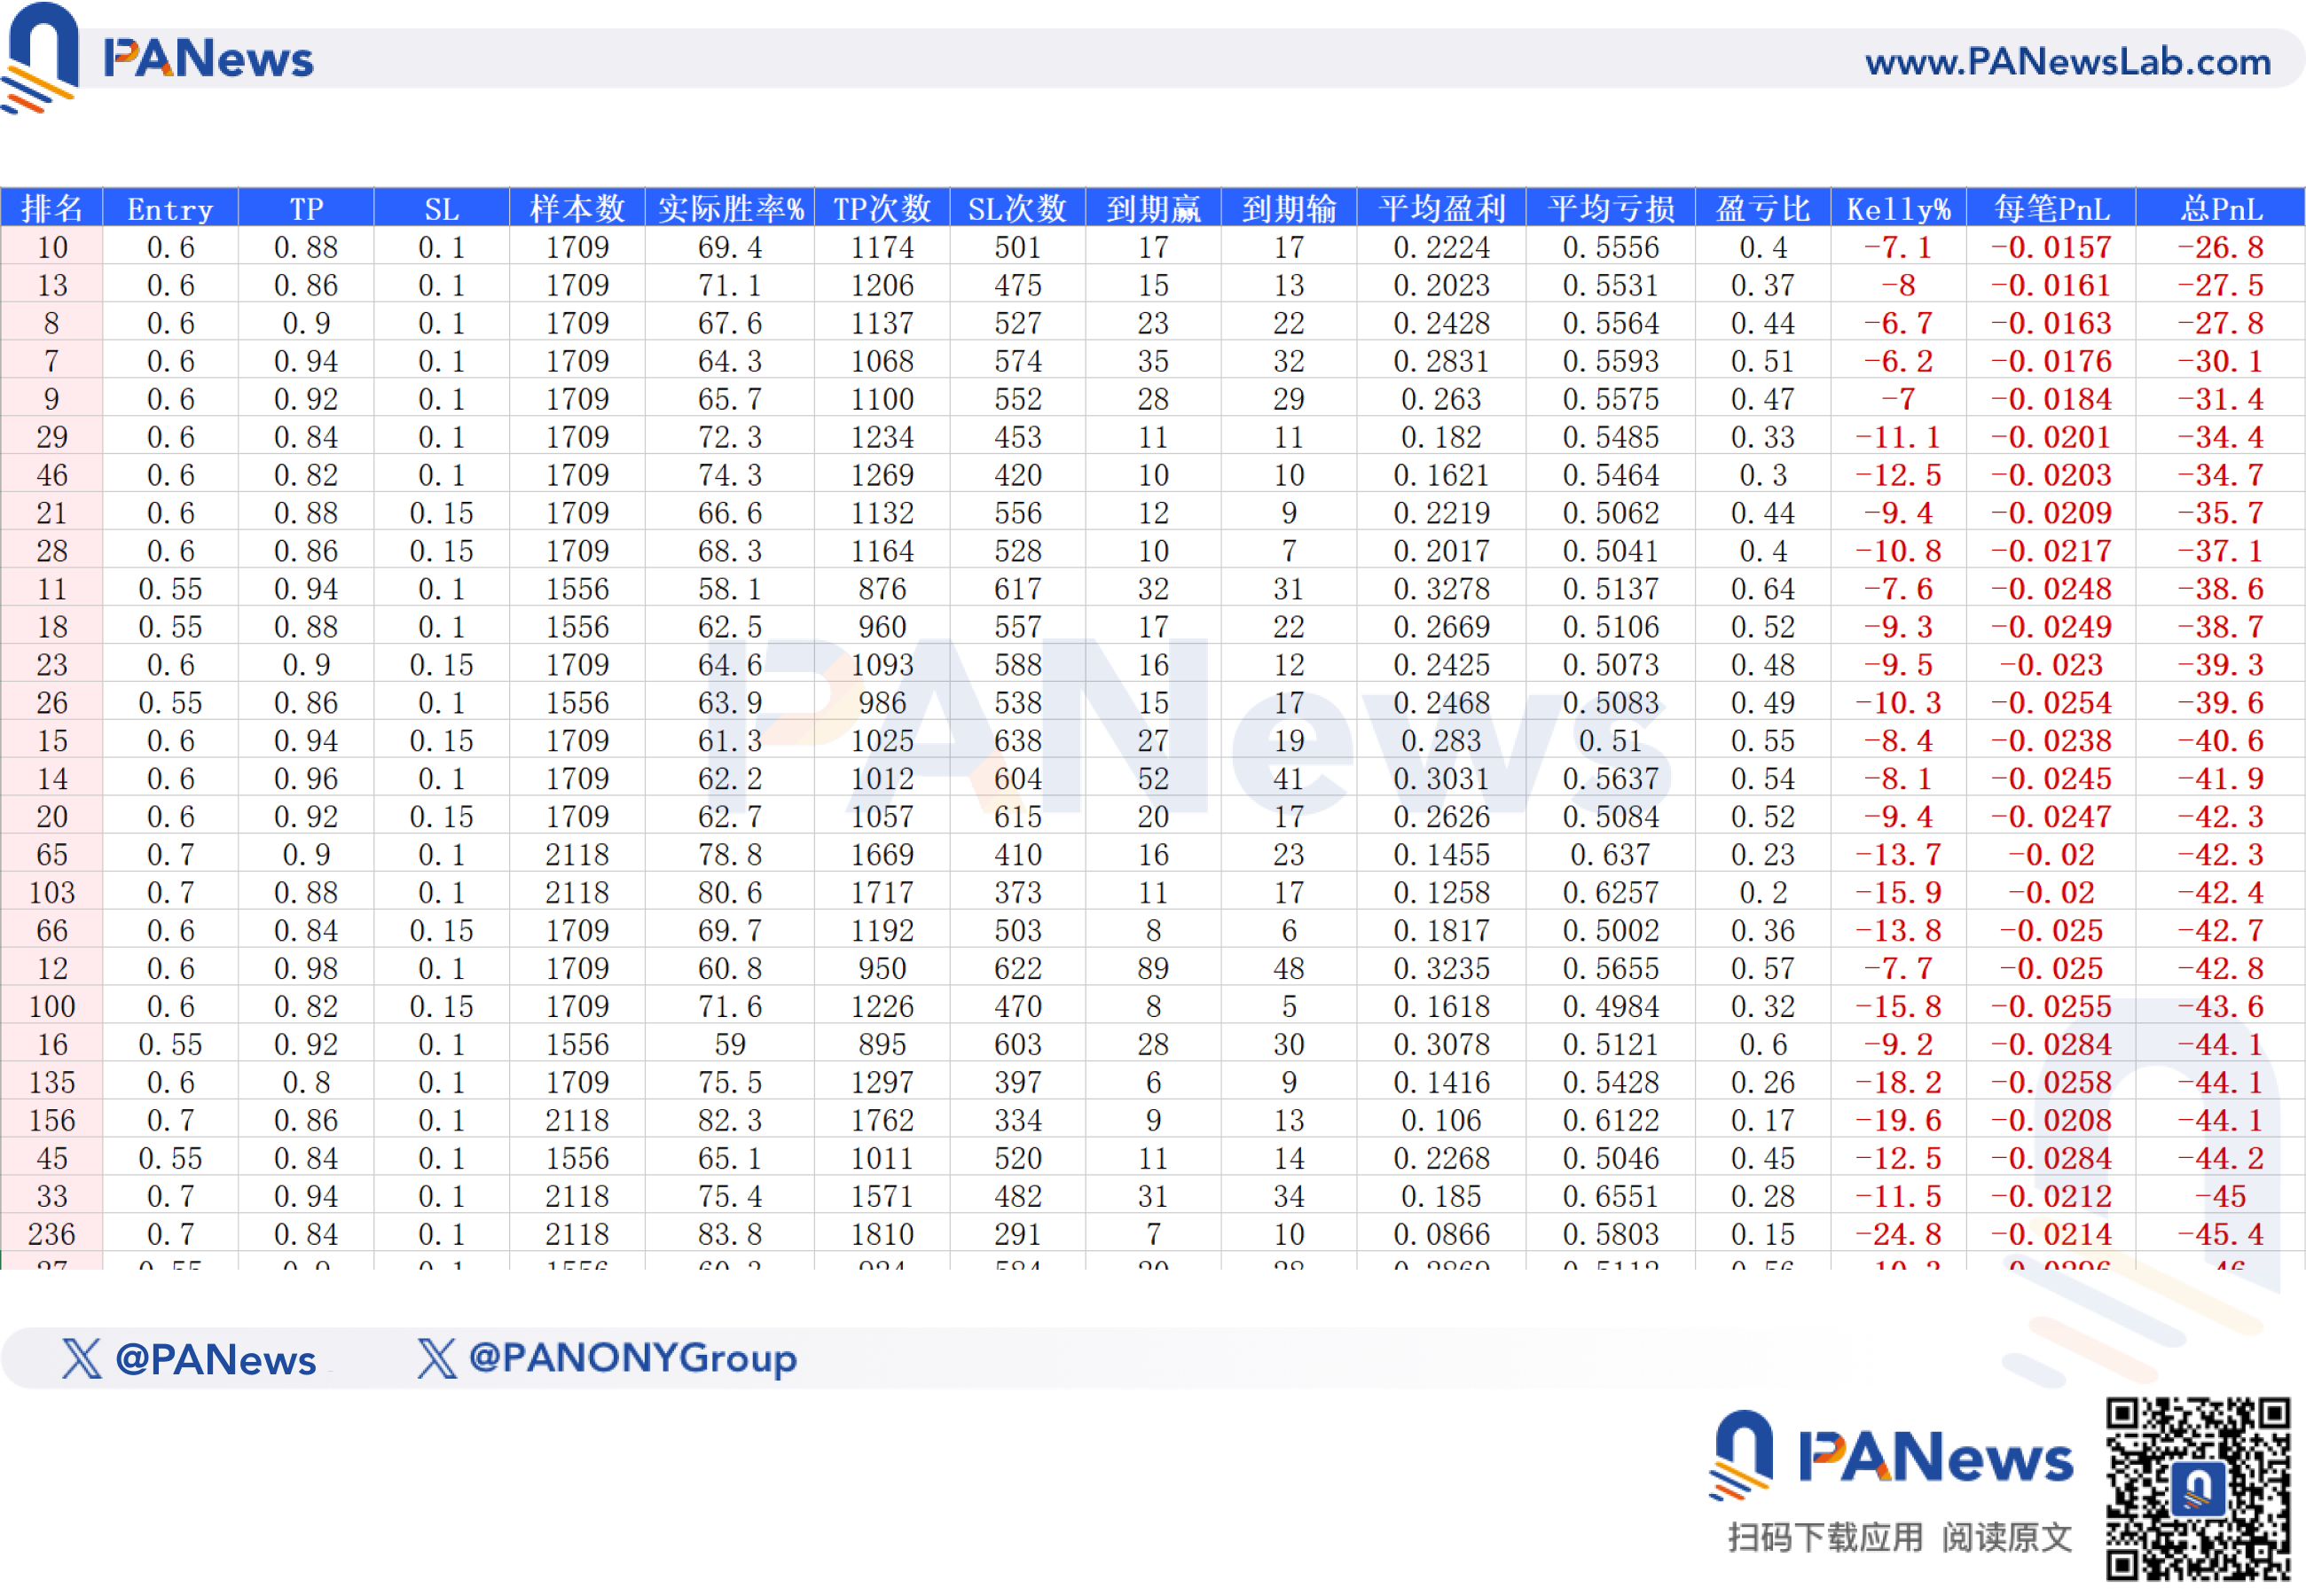
Even the most potential profit possibility resulted in an expected return of -26.8. This result indicates that in prediction markets, pure mathematical predictions that exclude events themselves hardly possess the potential for profitability.
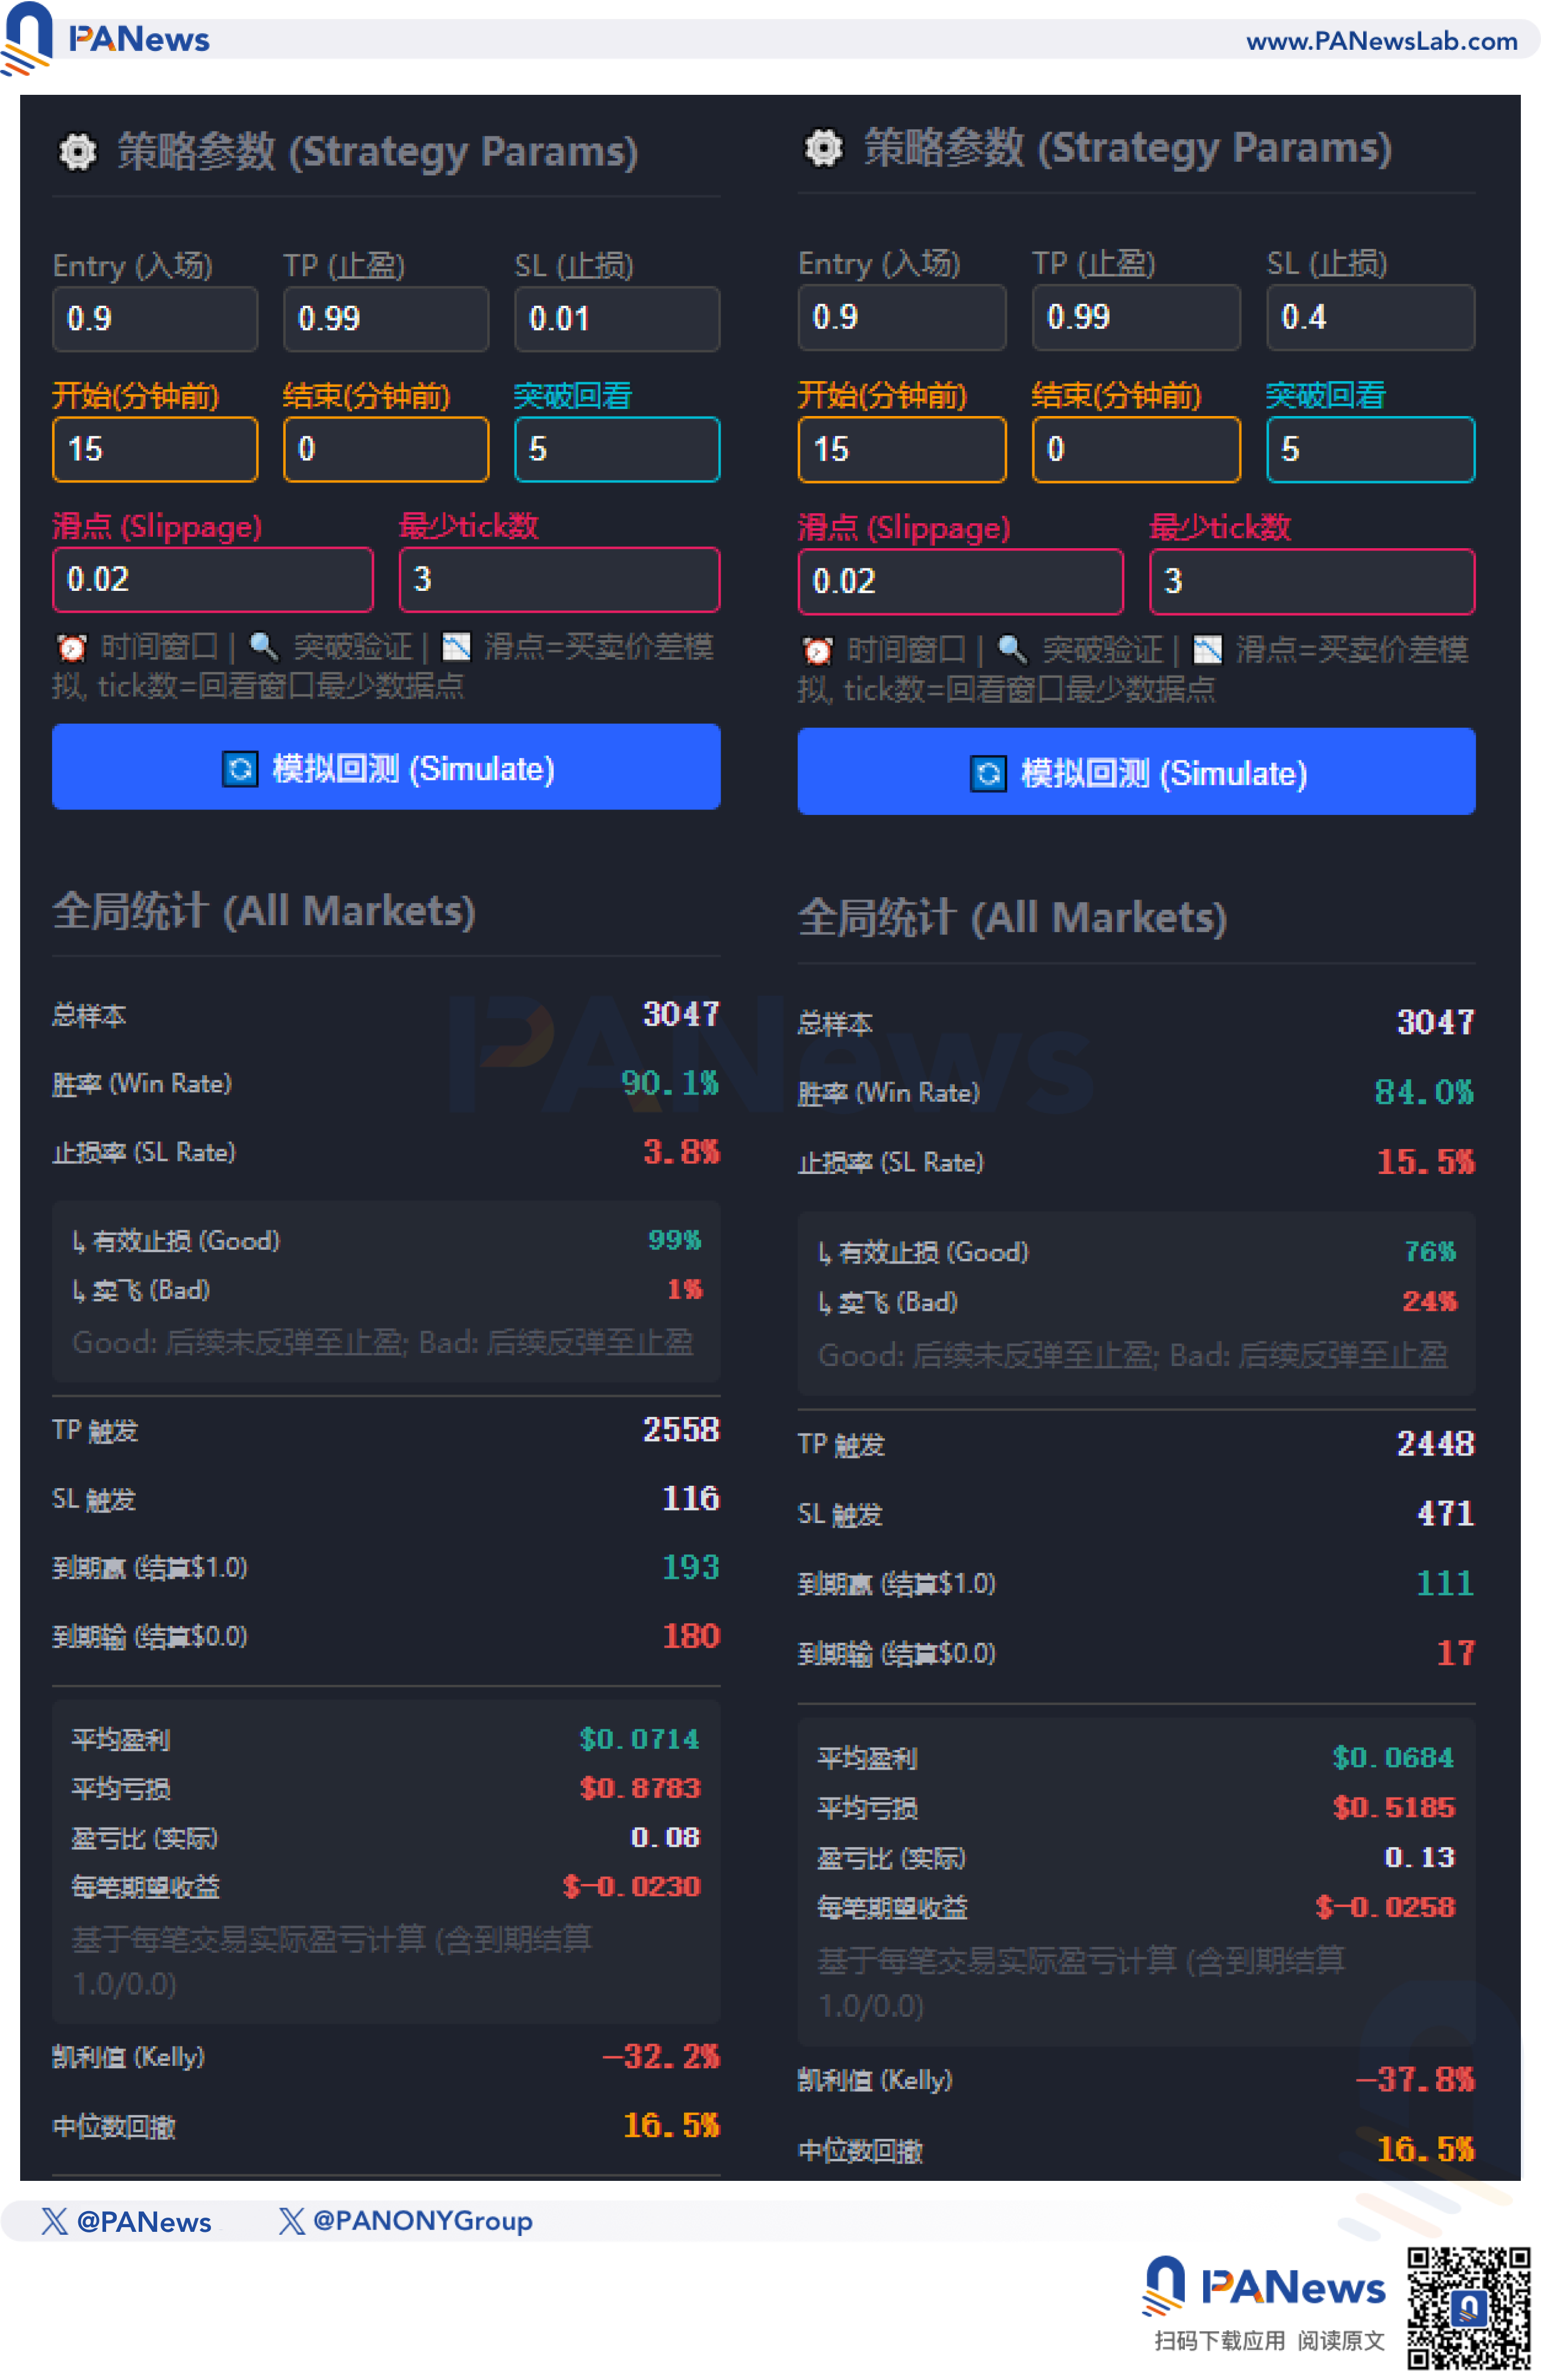
For example, there has been much discussion on social media regarding the "late game strategy," which involves buying at 90% of the time and selling at 99%. This strategy seems to have a very high win rate and would be profitable in the long run. From the actual results, this strategy's win rate was indeed quite high at 90.1%, with 2558 out of 3047 simulations able to achieve profit. But frighteningly, under this strategy, the actual profit and loss ratio was only 0.08, and the expected return according to the Kelly formula was -32.2%, making it unworthy of use.
Perhaps some might say that setting a stop-loss will improve the profit and loss ratio. However, the harsh reality is that while the profit and loss ratio improves, the win rate will correspondingly decrease; for example, setting a stop-loss at 40% will reduce the win rate to 84%, and with the still not-high profit and loss ratio, the final Kelly expected value is -37.8%, still a loss.
On the contrary, the most likely plan close to profitability was to buy a reversal, entering at 1% with the bet that the market will reverse and eventually win. In the simulation, this plan had a win rate of about 1.1%, higher than the price probability, along with a high profit and loss ratio of 94, ultimately achieving an expected return of 0.0004. But this premise assumes no slippage and fees; once fees are considered, it would immediately turn into a negative expectation.
In summary, in our research, we found that simply relying on technical analysis from financial trading cannot achieve profitability in prediction markets.
The trap of "two-way arbitrage"
So, apart from this plan, there is another mainstream perspective, which is two-way arbitrage, meaning as long as the total cost of YES + NO is less than 1, this result can achieve profitability no matter what. Again, this is an idea that is beautifully ideal but harshly realistic.
Firstly, if you adopt a cross-platform arbitrage scheme, there are already many bots. Ordinary users cannot compete with bots for the meager liquidity.
To achieve this operation effect, another scheme is to buy when the YES price drops to 40% and the NO also drops to 40% in the same market, achieving a 20% arbitrage space.
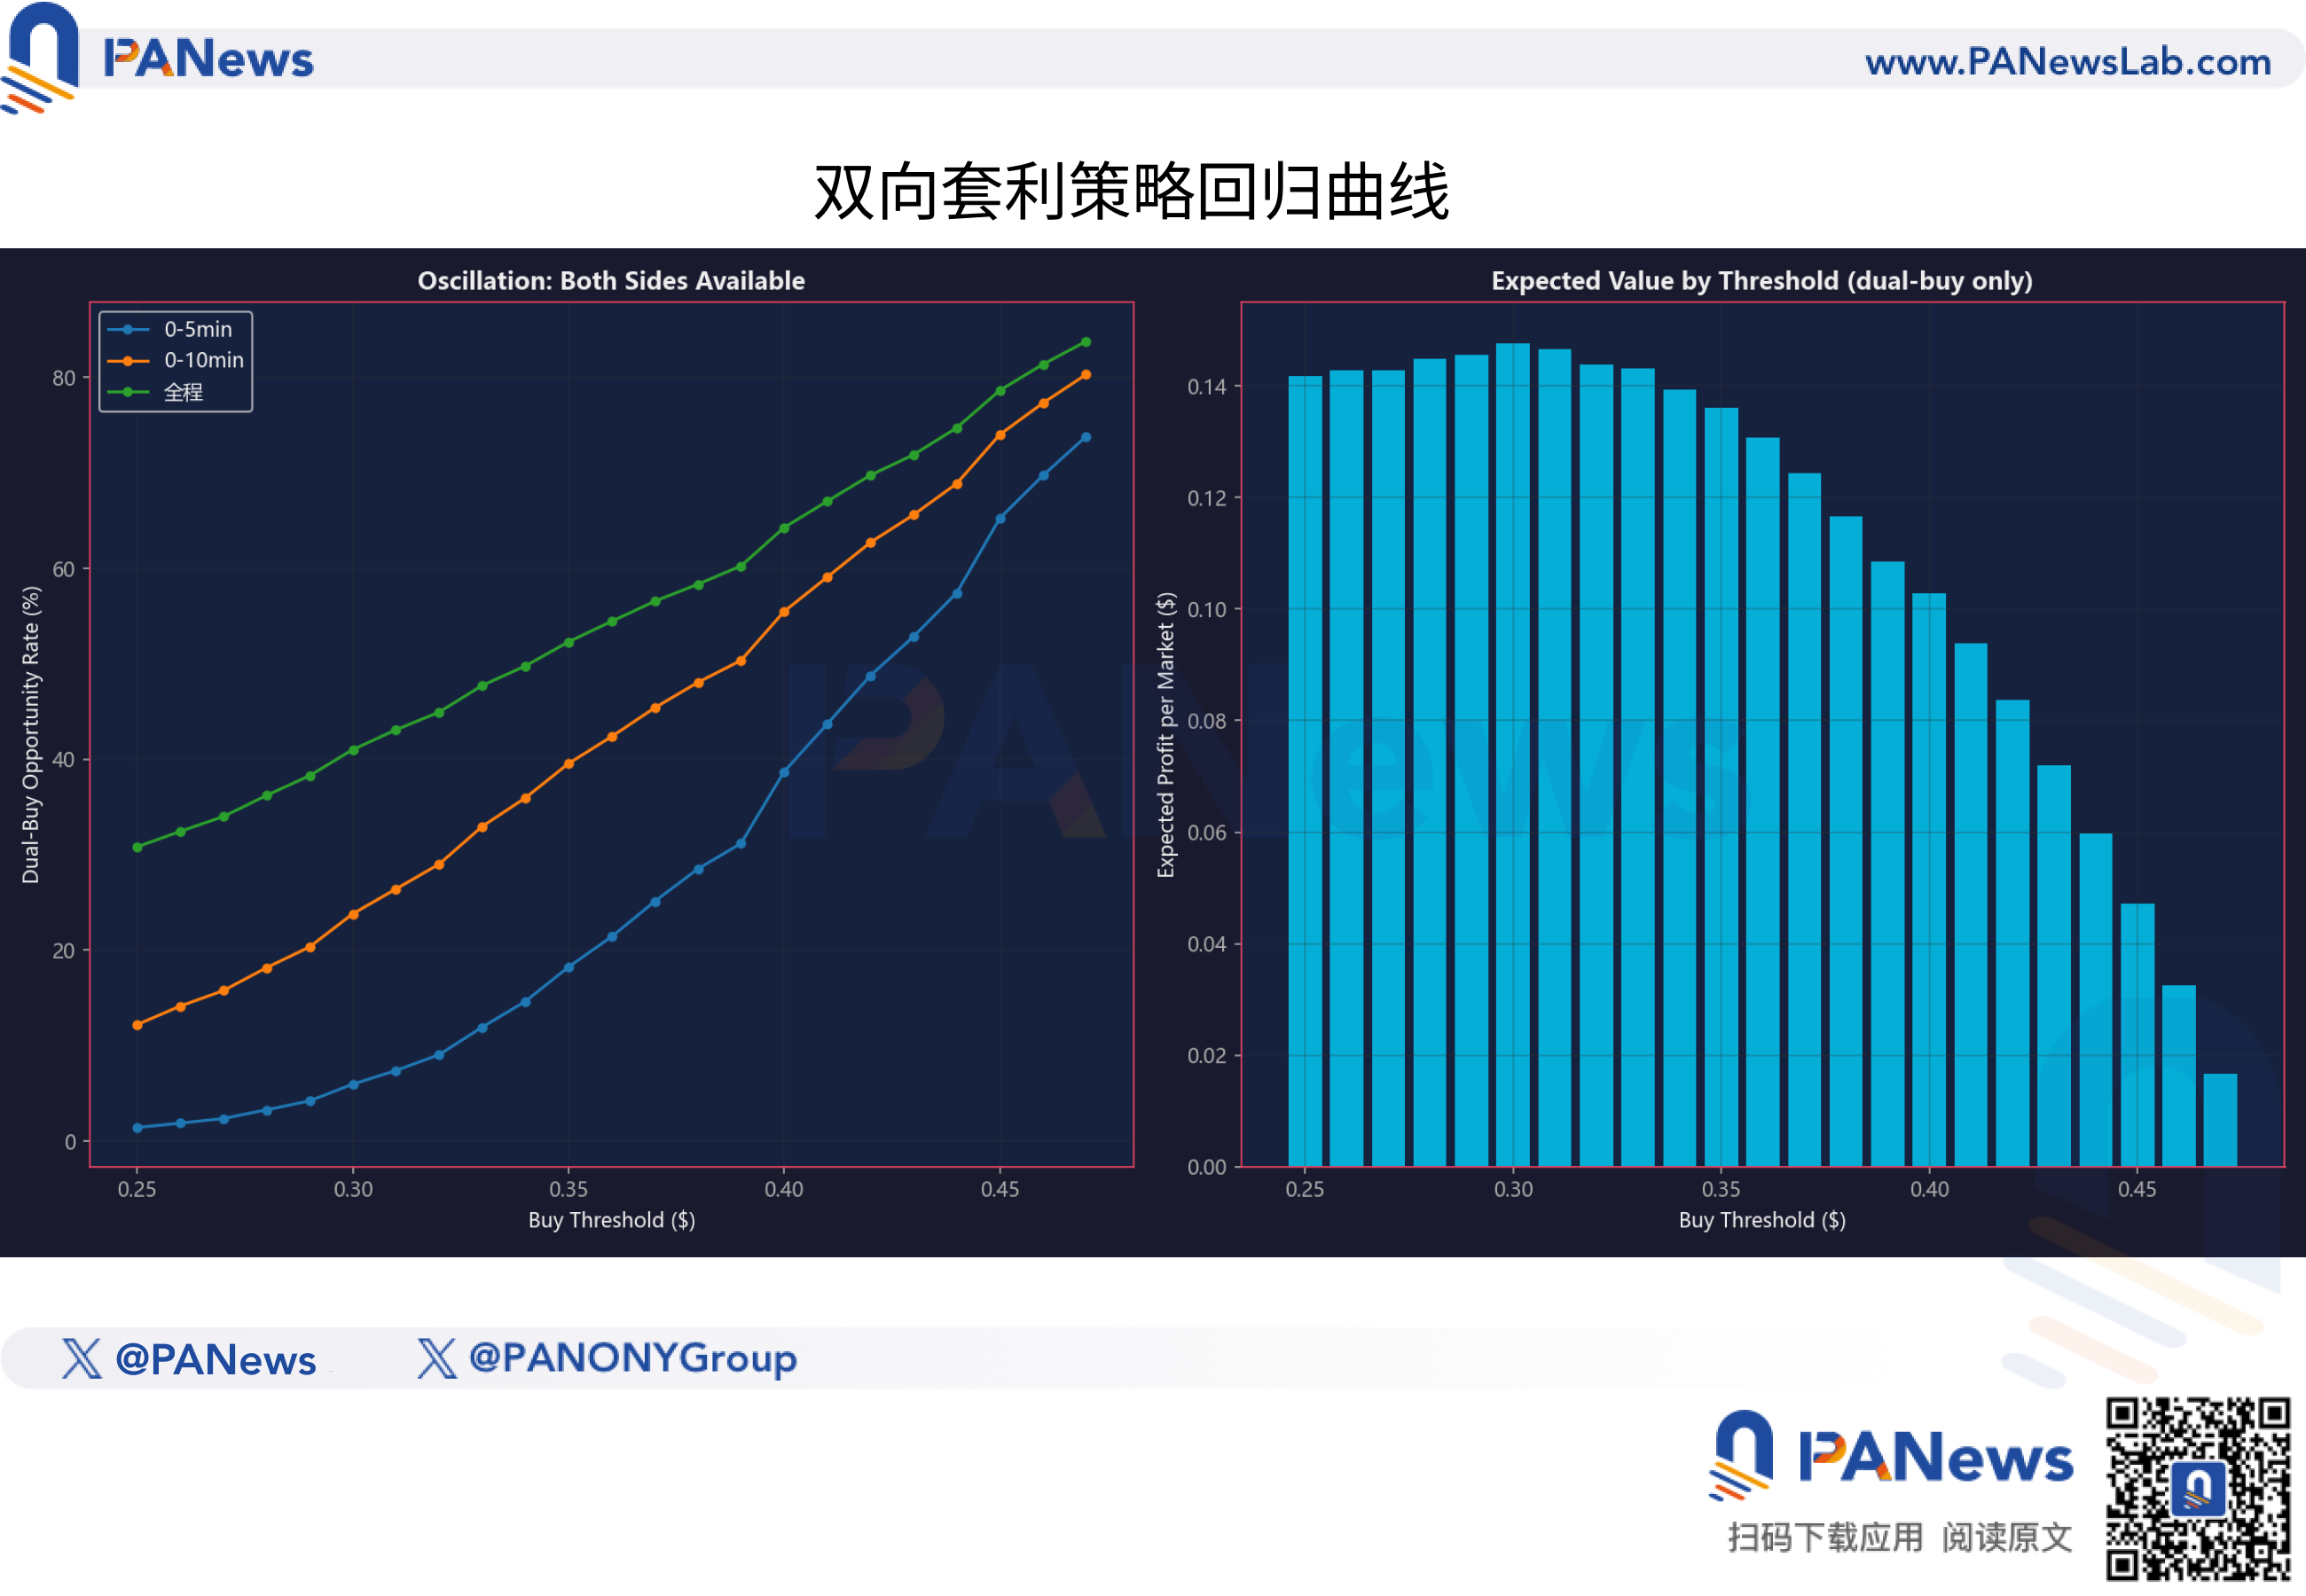
But the final data results are not the same; according to the data, although this strategy has a 64.3% win rate, its low profit and loss ratio still leads to a final negative expectation for the strategy.
This "two-way strategy" looks nice but is actually prone to failure. From a classification standpoint, this strategy also falls into the category of pure theoretical settings detached from changes in events themselves.
Fair value and divergence models are the "golden key"
So, what kind of strategy might truly achieve profitability?
The answer lies in the "time difference" between the BTC spot price and the prediction market token price.
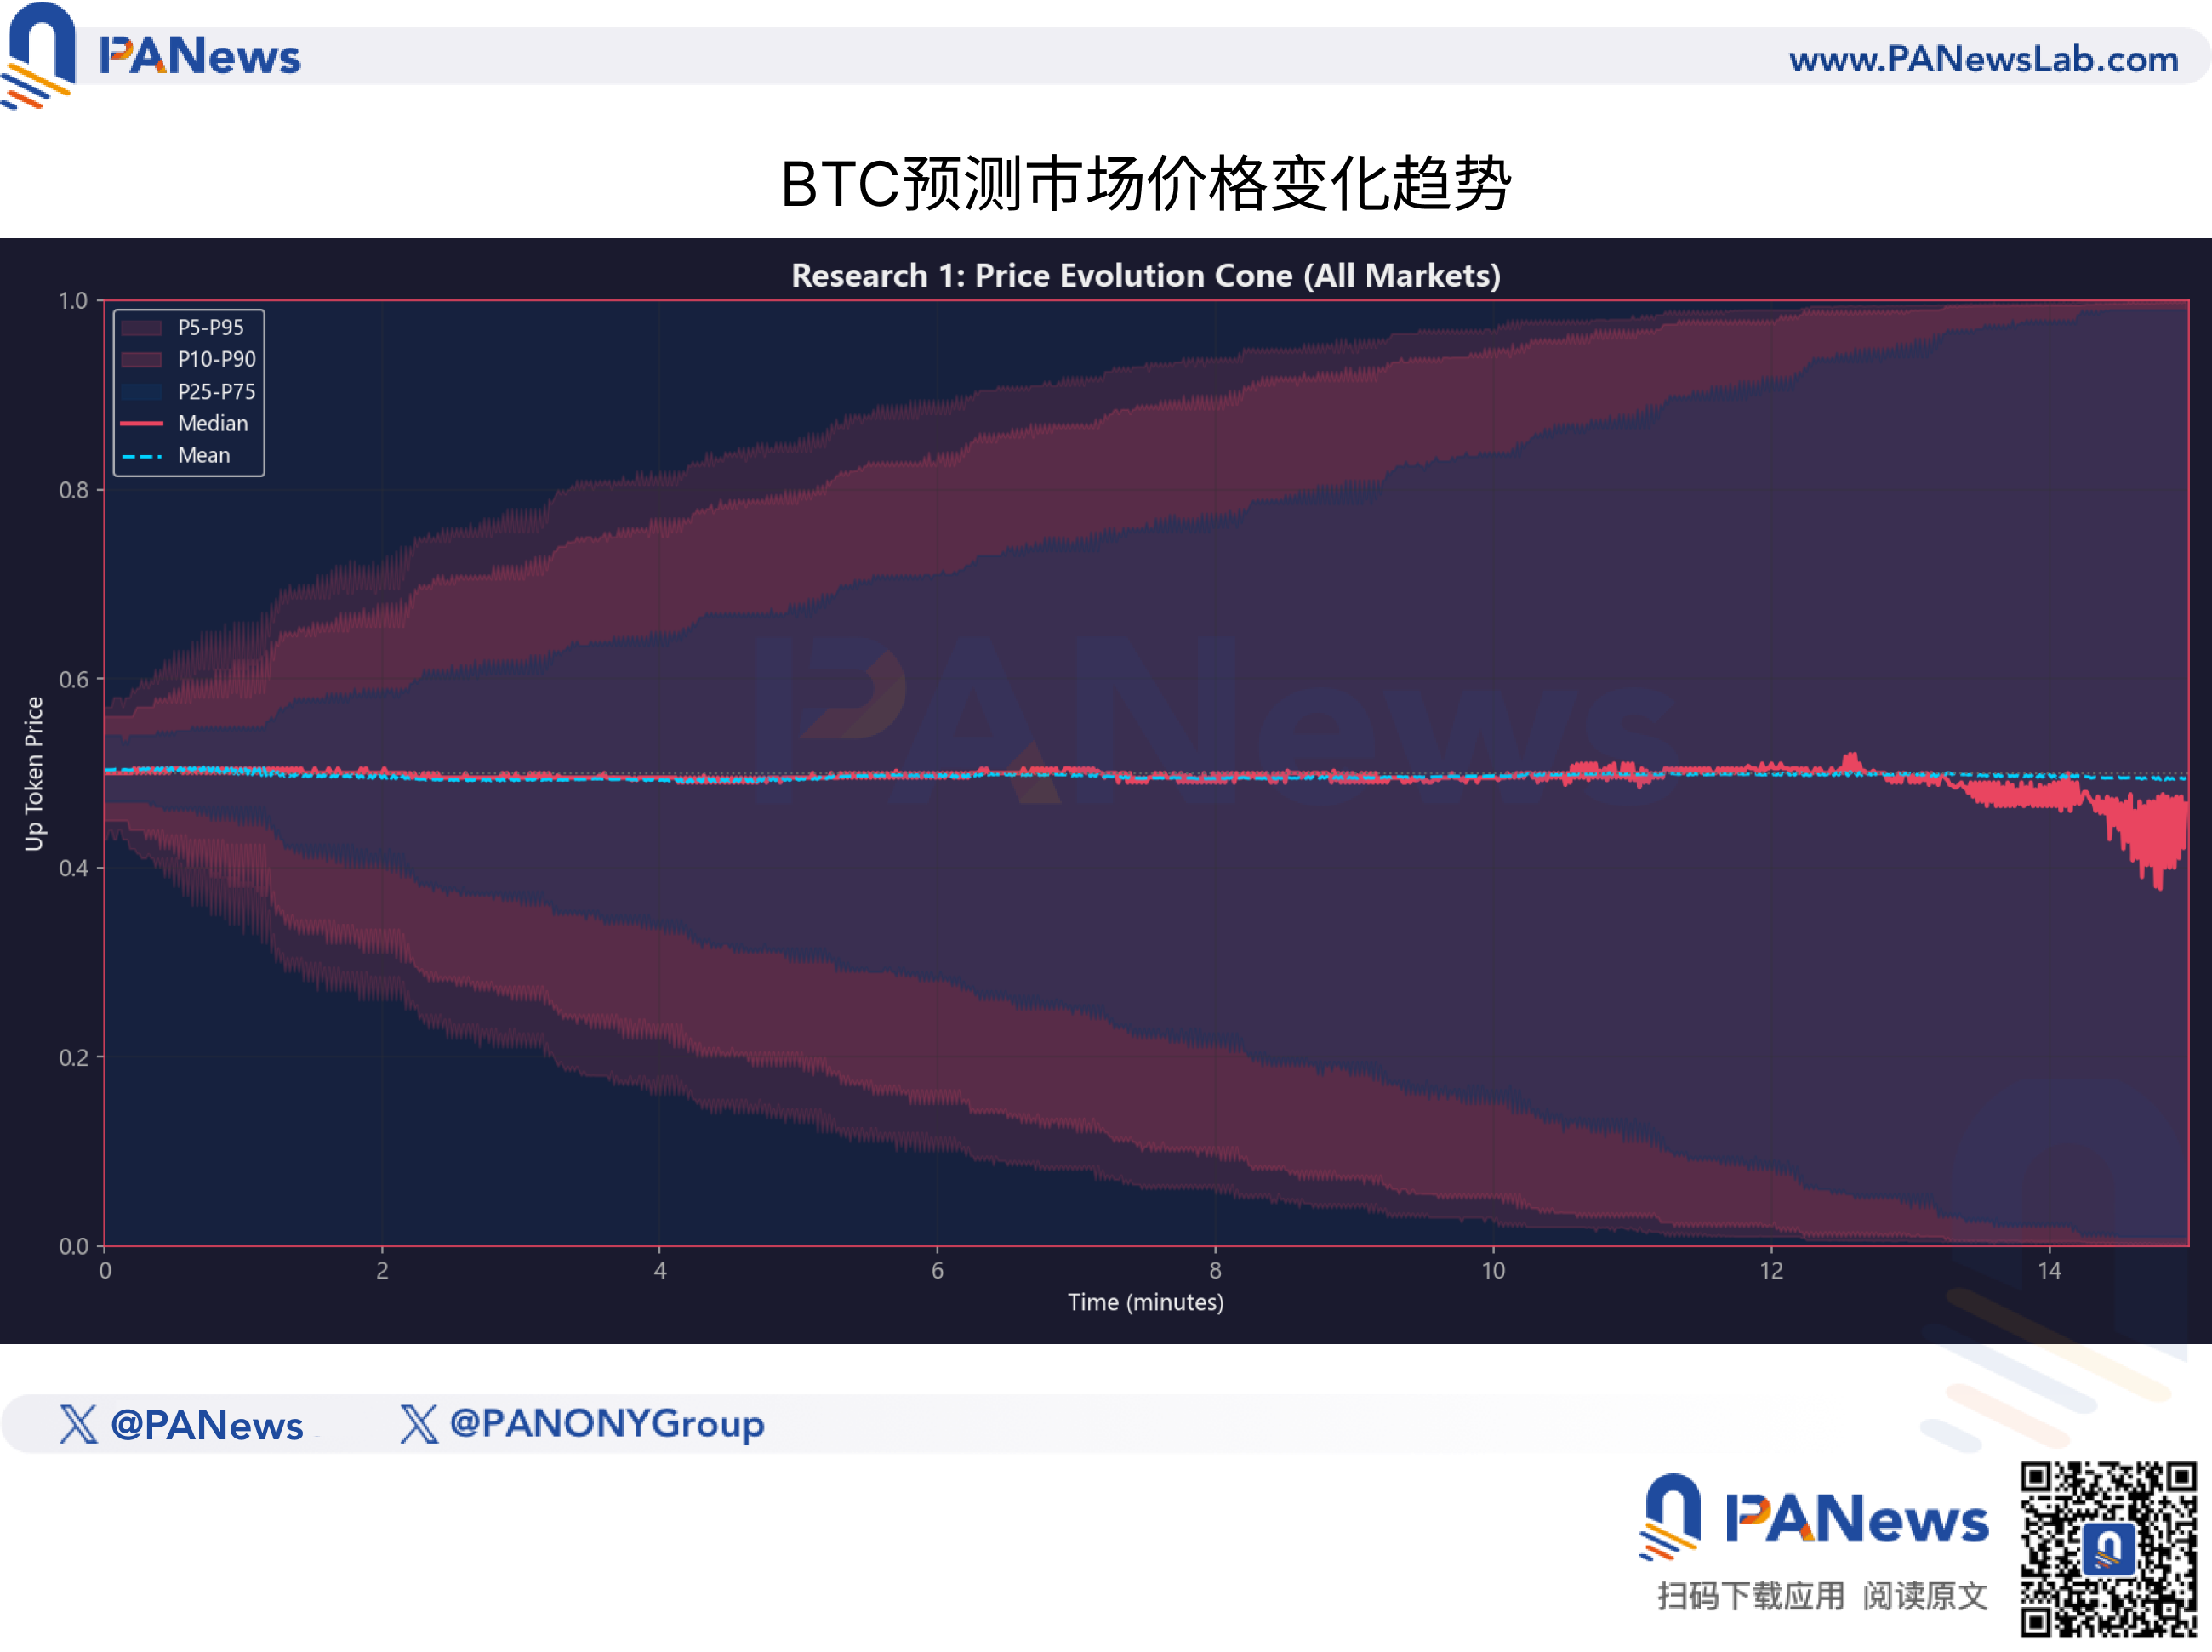
PANews found that the liquidity providers and market maker algorithms in the prediction market are not perfect. When BTC experiences drastic shifts in a short time (for example, within 1-3 minutes), such as a sudden price jump exceeding $150 or $200, the prices of tokens in the prediction market do not instantly "jump" to the theoretical price.
Data shows that this pricing "efficiency gap" decays from the maximum value (about 0.10) to half (about 0.05), averaging around 30 seconds.
30 seconds may mean an eternity for high-frequency trading, but for manual traders, it represents a fleeting "golden window".
This means that prediction markets are not entirely efficient markets. They are more like a sluggish beast; when BTC's command is executed, it often takes a moment to make the turn.
However, this does not imply that just being quick-handed will lead to easy money. Our data further indicates that this "delay arbitrage" space is being rapidly compressed. In ranges where BTC's fluctuations are less than $50, after deducting gas fees and slippage, most so-called "arbitrage opportunities" are actually traps of negative expectation.
In addition to speed-based momentum trading, PANews's research also reveals another profit logic based on "value investing".
In prediction markets, "price" does not equal "value". To quantify this, PANews constructed a "Fair Value Model" based on 920,000 historical snapshots. This model does not rely on market sentiment but calculates the theoretical win rate of the current tokens based on BTC's current volatility status and the remaining time until delivery.
By comparing theoretical fair value with actual market prices, we found non-linear characteristics of pricing efficiency in prediction markets.
1. The magic of time
Many retail investors intuitively believe that as time passes, prices should regress linearly. But data shows that certainties converging accelerate.
For example, under the same BTC volatility conditions, the pricing correction speed in the final 3-5 minutes of the match is far faster than in the first 5 minutes before the match. However, the market often underestimates this convergence speed, leading to significant occurrences where token prices are much lower than their fair values in the later stages of the match (in the remaining 7-10 minutes).
2. Only "deep discounts" are worth buying
This is the most significant risk control conclusion given by this research.
Through backtesting with different divergence indices (fair value - actual price), it was found that:
When market prices are above fair value (i.e., buying at a premium), regardless of BTC's trend, the long-term expected value (EV) is negative across the board.
Only when the divergence index > 0.10, meaning the actual price is at least 10 cents lower than fair value, does trading have a robust positive mathematical expectation.
This implies that for smart capital, a price of $0.70 does not mean "a 70% chance of winning"; it is merely a quote. Only when the underlying true win rate calculated by the model reaches 85% does $0.70 become a "bargain" worthy of a bet.
This also explains why many retail investors easily incur losses in prediction markets, as your actual transaction price is likely to be at a level above the market fair price.
For ordinary participants, this research serves as a sober withdrawal message and an advanced guide. It tells us:
Abandon K-line superstition: Do not attempt to find patterns in the trend chart of prediction tokens; that is a mirage.
Focus on the underlying asset: Pay attention to BTC's unusual movements instead of the prediction market.
Respect the odds: Even with a 90% win rate, if the price is too high (premium), it is still a losing transaction.
In this algorithm-driven jungle, if ordinary retail investors cannot establish a "fair value" mathematical coordinate system and lack the technical ability to capture "30 seconds of delay," then every click on "Buy" might just be a donation to the liquidity pool.
免责声明:本文章仅代表作者个人观点,不代表本平台的立场和观点。本文章仅供信息分享,不构成对任何人的任何投资建议。用户与作者之间的任何争议,与本平台无关。如网页中刊载的文章或图片涉及侵权,请提供相关的权利证明和身份证明发送邮件到support@aicoin.com,本平台相关工作人员将会进行核查。


