1. Breakthrough of the First Resistance, Rebound Logic Established
Looking back at the market on the 3rd, the price completed the breakthrough of the first resistance level below, with the 90,000 line turning from a pressure point to an upward structure. With this position effectively broken, the price formed higher lows.
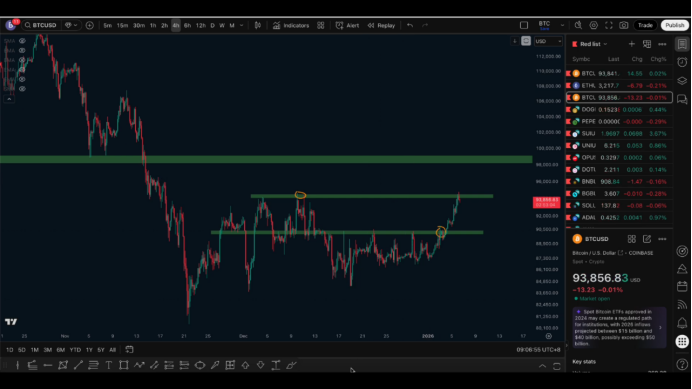
At that time, we mentioned that once the first resistance level was broken, the market would likely enter a phase of continued rebound and attempt to break through the previous high.
2. Previous High Broken, Short Position Liquidation Completed
Ultimately, the price broke through the previous high as expected.
This process was essentially a concentrated liquidation of short positions.
We have repeatedly emphasized that only by forming higher highs can the market effectively liquidate shorts, thus pushing the price into a relatively healthy rebound rhythm.
This viewpoint was shared on the 3rd, and after the price confirmed its stability on the 4th, we continued to uphold this judgment.
3. After Breaking 94,000, No Short-term Pressure to Decline
During yesterday's rebound, the price successfully broke through the previous high of 94,000.
From the current market perspective, after completing the breakthrough of the previous high and testing it, there has been no significant short-term pressure to decline, indicating that the current rebound structure remains valid.
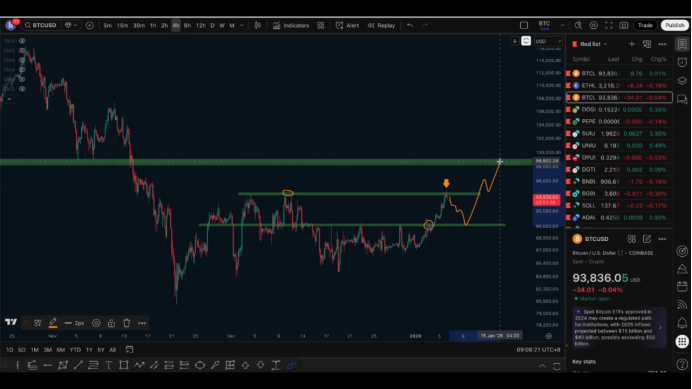
Moving forward, a more reasonable trend would be to retest the short-term support below, and after completing the retest, continue the rebound.
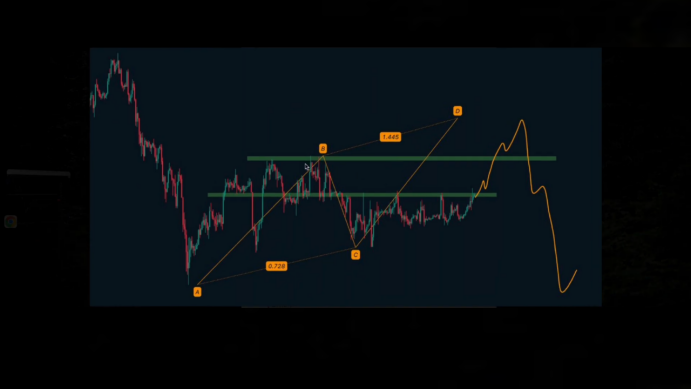
4. Rebound Target Range: 98,000-99,000
If the market forms a segment of equidistant upward structure, the key target range to focus on will fall between 98,000-99,000.
After completing this segment of equidistant rise, the bearish structure on a larger cycle may continue, initiating a new round of decline.
Of course, there is also another possible path:
After breaking the previous high, the price could directly accelerate upward to the 98,000-99,000 range, followed by a new decline.
5. Short-term Bullish Response Strategy
If you participated in the bullish position after the breakthrough at the 90,000 line, you can currently treat this position as a short-term long.
Near the current key resistance, consider partially reducing your position and using a trailing stop to speculate on the potential upward space in the next phase, which is the important resistance range of 98,000-99,000.
It is important to note that this range is also the rebound limit area we have mentioned multiple times before.
6. Do Not Chase Highs, Focus on Pullback Opportunities
If you currently do not hold a bullish position, it is not recommended to chase highs at this position.
The reason is simple: the stop-loss for a new long position would need to be placed below 90,000, which makes the overall risk-reward ratio less than ideal, with risk not matching the potential reward.
A more prudent short-term strategy is to wait for a price pullback, and after testing the key support, consider establishing a new long position.
7. Mid to Long-term Strategy: Wait for High Short Opportunities
From a mid to long-term perspective, the main direction of participation in the coming period remains to wait for the end of the rebound and look for short opportunities at high levels.
Before a new decline officially begins, it cannot be ruled out that the price will continue to rebound upward; this current rebound may not yet be over.
From a comprehensive structural perspective, the final high still focuses on the range of 98,000-99,000.
8. Why 98,000-99,000 is a Key Position
On one hand, this is the potential target area for point D in the equidistant upward structure;
On the other hand, this range is also the previous phase's low point at the daily level, belonging to the key area of "previous support, later resistance."
From a structural logic perspective, it is relatively reasonable for the price to test this position.
9. Core Conclusions at the Current Stage
In summary, the current thoughts are:
In the short term, the price still has the potential to continue rising.
Those with existing long positions can continue to hold, paying attention to reducing positions and moving stop-losses.
For those without long positions, it is not recommended to chase highs; waiting for a pullback is advisable.
The mid to long-term direction still focuses on high short opportunities.
At this stage, there is no rush to establish new short positions.
Follow me, join the community, and let's progress together.

免责声明:本文章仅代表作者个人观点,不代表本平台的立场和观点。本文章仅供信息分享,不构成对任何人的任何投资建议。用户与作者之间的任何争议,与本平台无关。如网页中刊载的文章或图片涉及侵权,请提供相关的权利证明和身份证明发送邮件到support@aicoin.com,本平台相关工作人员将会进行核查。