摘要
十月市场惊现戏剧性逆转:美联储降息非但未能提振市场,反而引爆了币圈一场高达4000亿美元的大闪崩。核心矛盾并非宏观政策,而是市场内部的致命软肋——当特朗普的关税黑天鹅袭来,高杠杆瞬间刺穿了稀薄的流动性。然而,真正的故事藏在废墟之下:AI+加密、RWA、预测市场等新叙事已悄然崛起,正为下一轮牛市埋下伏笔。本文将穿透价格波动的迷雾,揭示这场流动性危机背后的真相与未来机遇。
一、美联储降息大背景:流动性盛宴与结构性质变
10月30日,美联储实施了年内的第二次降息,将联邦基金利率目标区间下调至3.75%-4.00%。这一决定源自美国经济面临的独特困境——通胀压力上升与就业市场放缓的双重风险。
美联储主席鲍威尔坦言:“不存在无风险的路径”。这种困境使美联储的决策变得异常艰难,也为后续政策带来了不确定性。
市场对降息消息的反应出人意料。降息本应提振风险资产,但加密货币市场却在十月出现大规模抛售。这表明投资者已经提前消化了降息预期,当真正降息来临时,反而触发了获利了结。
(1)联邦基金利率
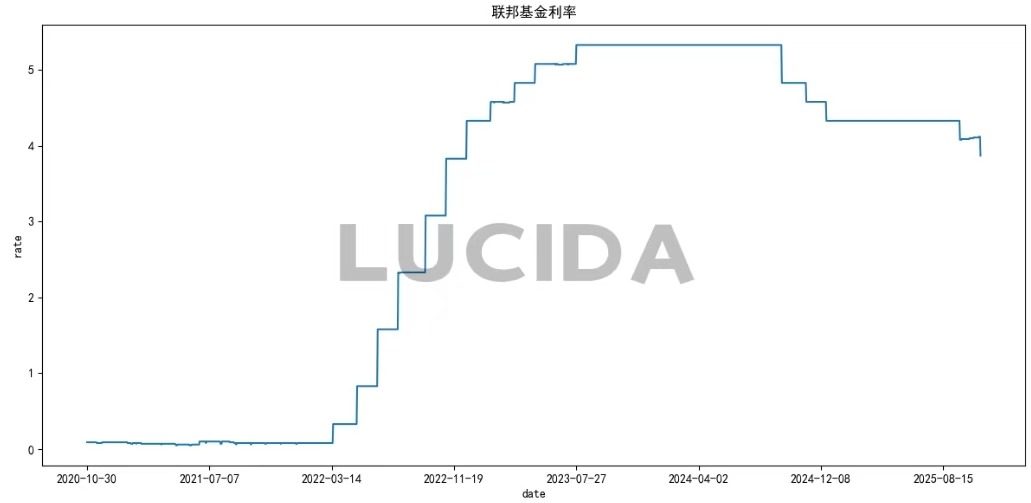
美联储10月降息25个基点的决定基本符合市场预期。这一决策的关键推动因素来自就业市场明显放缓。本次会议声明删除了"劳动力市场状况依然稳健"的表述,改为强调"就业增长放缓,失业率略有上升"。
(2)美联储资产负债表
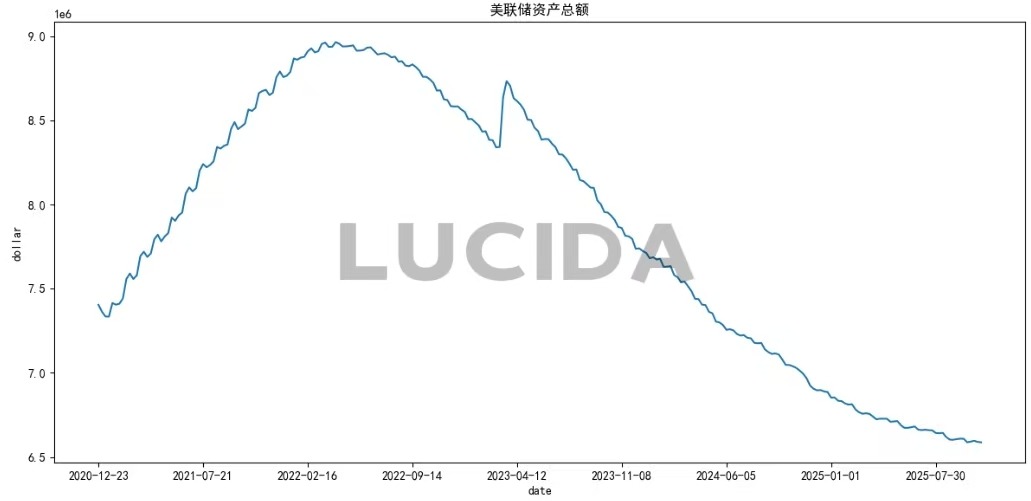
10月30日,美联储在举行完议息会议后,做出了两项关键决策:一是宣布降息25个基点,将联邦基金利率目标区间下调至3.75%-4.00%;二是明确表示自12月1日起停止缩减资产负债表(即结束量化紧缩,QT)。这意味着,当前每月减持50亿美元美国国债和350亿美元抵押贷款支持证券(MBS)的计划届时将终止。美联储主席鲍威尔指出,作出这一决定是因为“货币市场压力要求立即调整资产负债表操作”,并承认已出现“明显迹象”表明是时候停止量化紧缩了。
此次政策转向,表面上是应对货币市场流动性趋紧的压力——隔夜逆回购工具使用规模已从年内高点的4600亿美元骤降至不足60亿美元,银行准备金率也徘徊在12.2%的关键水平附近。但其背后,则折射出美联储在高债务约束下的货币政策困境。目前美国联邦政府债务总额已突破38万亿美元,净利息支出逼近国防开支规模。若继续维持紧缩的资产负债表政策,虽有助于抑制通胀,但会显著推高政府融资成本,甚至可能触发债务风险。因此,停止缩表也是美联储在通胀控制与债务可持续性之间寻求的艰难平衡。
展望未来,美联储资产负债表的走向已浮现出“先止缩,后扩表”的路径。鲍威尔已在10月会后明言:“最终美联储将再次扩大资产负债表”,因为经济与银行体系的正常运转需要准备金的相应增长。这意味着,在12月1日停止缩表并保持一段时间的稳定后,美联储可能在未来某个时候重启资产购买,不过届时购债结构将更侧重于短期国债,以降低整体资产久期。
这一系列变化对市场而言意义深远。停止缩表本身就被视为一种“隐性宽松”,它不再从市场中抽离流动性,反而为金融体系提供了潜在的活水。有分析认为,这一举措可能产生相当于降息25个基点的宽松效果。历史经验表明,美联储资产负债表的边际变化对实际收益率、美元流向及风险偏好影响显著。若流动性环境因此得到切实改善,比特币等加密资产作为对流动性高度敏感的“边缘风险资产”,可能迎来新一轮的估值支撑。
(3)美国9月核心PCE物价指数
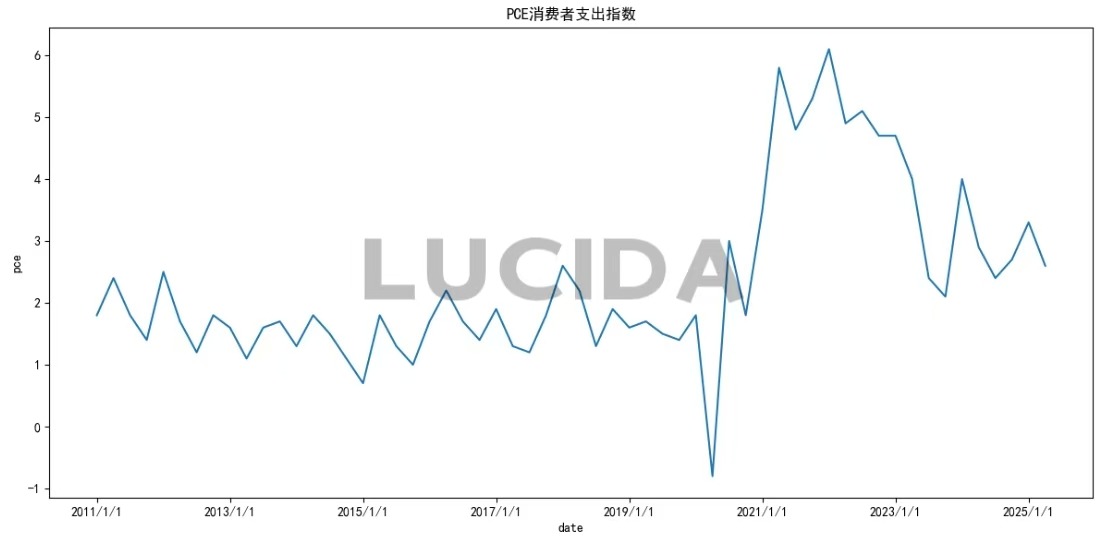
受美国政府停摆影响,10月核心pce数据并未公布。但是作为美联储最关注的通胀指标,9月PCE物价指数同比上涨2.7%,略高于7月的2.6%;环比增长0.3%,较7月加快0.1个百分点。更受关注的核心PCE价格指数(剔除食品和能源)环比增长0.2%,同比增长2.9%,与7月持平。分类别看,服务价格上涨0.3%,主要反映在机票、酒店住宿、金融服务与保险、住房及公用事业等领域。商品价格环比微涨0.1%,其中娱乐用品及交通工具价格下降1.7%,被其他耐用制成品和汽油价格小幅上涨所抵消。美联储认为关税对通胀的影响相对温和,对核心PCE的贡献约0.3%-0.4%,且传导速度较慢。鲍威尔表示,"短期内,通胀面临的风险偏向上行,而就业面临的风险偏向下行——这是一种具有挑战性的局面"。
(4)美元指数
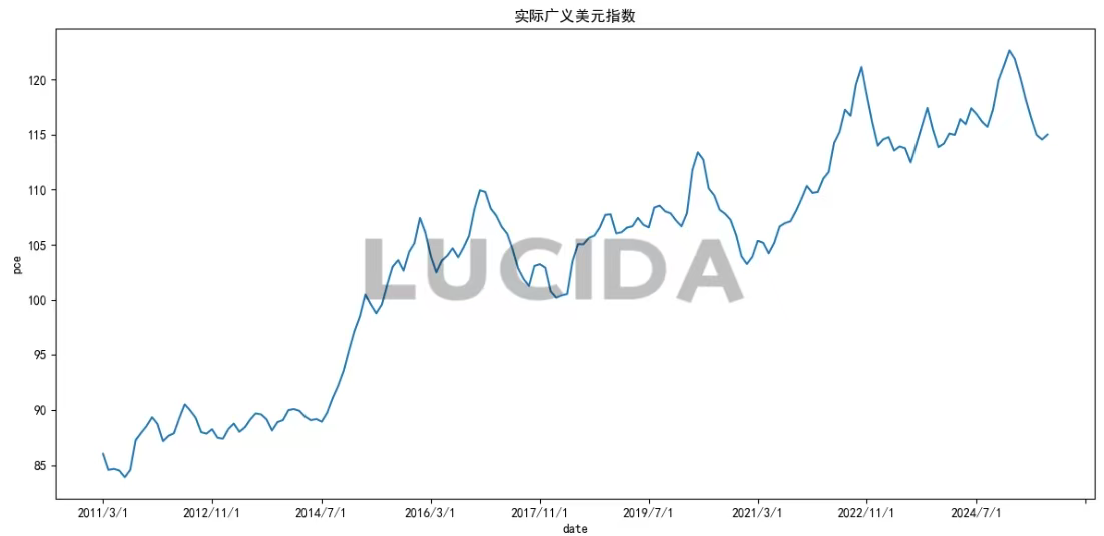
美元指数在美联储降息后一度走弱,但因欧洲央行、日本央行维持宽松货币政策,美元并未持续下跌。这一走势反映了主要央行间的政策差异。美联储虽开启降息周期,但其他主要央行同样保持宽松立场,限制了美元大幅贬值的空间。长期美债收益率高企(10年期收益率升至4.145%),仍吸引避险资金回流美国,进一步削弱了美元大幅下跌的动力。
小结
可见,降息是美联储在三重困境下的决定。就业市场疲软成为触发降息的关键因素。美联储在10月的降息决定遭遇了罕见的内部阻力。政策声明显示,堪萨斯城联储主席杰弗里·施密德反对降息,主张维持利率不变;而理事斯蒂芬·米兰则认为降息幅度不足,主张一次性下调50个基点。这种分歧凸显了美联储在平衡通胀与增长时的两难境地。鲍威尔将当前经济前景描述为 “在雾中驾驶” ,强调了政策路径的不确定性。尽管美联储持续释放宽松信号,数字货币市场却反应冷淡。比特币在10月份总体呈现近5%的跌幅,打破了连续六年的“Uptober”上涨纪录。这种背离揭示了市场对宽松政策的怀疑——当降息源于经济担忧而非健康增长时,风险资产难以获得持续动力。
二、虚拟货币市场情绪观察
(1)总市值
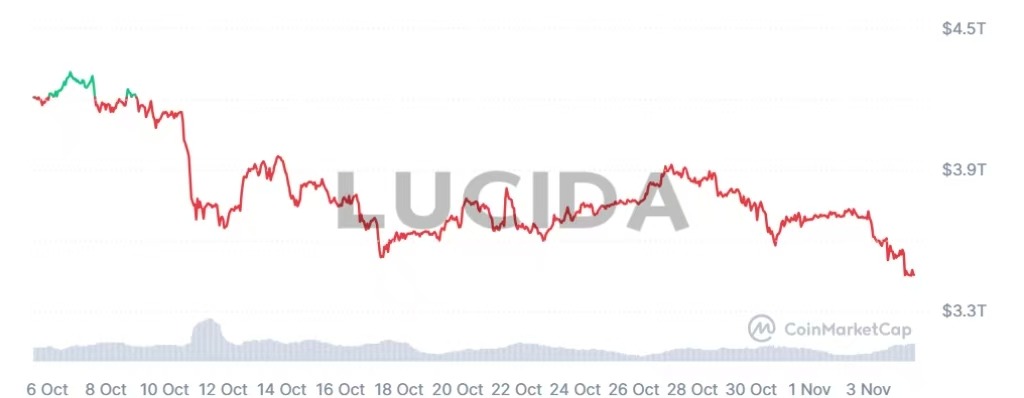
总市值是市场情绪的最终结果和整体体现。它的波动是所有个体代币价格变化、资金流入流出以及市场信心的综合产物。在10月,总市值经历了“过山车”般的旅程:在10月5日,受益于比特币和以太坊的强势上涨,总市值一度创下4.35万亿美元的历史新高。然而,在“10·11”暴跌行情中,单日跌幅超过9%,市值大幅蒸发。截至10月底日,总市值回落至约3.4万亿美元,这一起一落,深刻揭示了在市场恐慌和去杠杆过程中,财富效应的剧烈收缩。
(2)山寨季指数
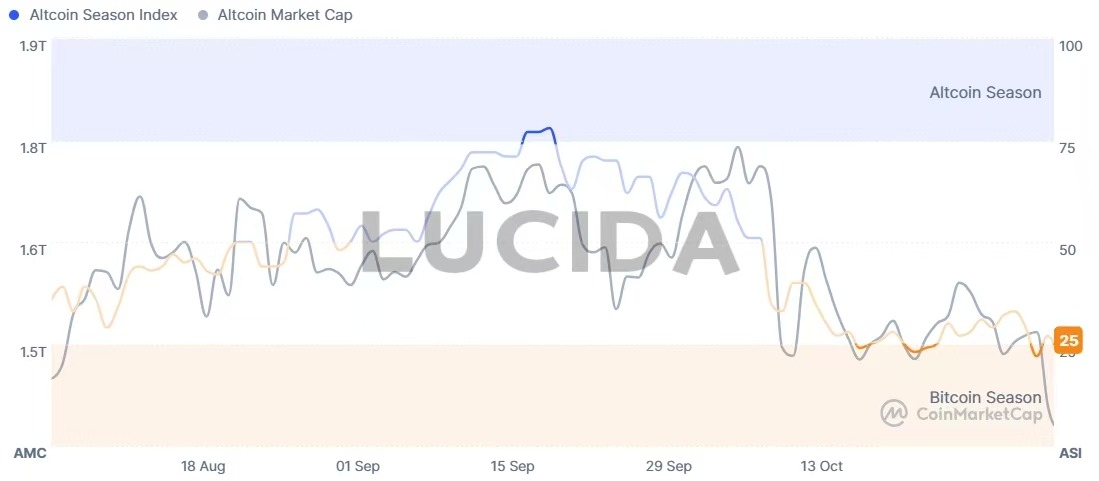
山寨季指数的核心逻辑在于衡量有多少主流山寨币在特定周期内表现优于比特币。当指数低于75,尤其是处于20-30的区间时(即“比特币季”),表明资金正从高风险的山寨币撤出,流向更稳健的比特币,这通常是市场避险时期或牛市初期的特征。这一点在10月底得到印证,当时该指数为32,确认了市场处于避险模式。
回顾10月初,该指数曾一度达到78,明确指向“山寨季”。这种从“山寨季”到“比特币季”的快速切换,清晰地揭示了市场热点的转换。历史上,当指数从低位(如15或17)首次强劲反弹至30以上时,可能预示着资金轮动的开始,是值得密切观察并逐步布局山寨币的早期信号。然而,投资者也需警惕,山寨币周期通常比比特币周期更短,波动也更为剧烈。
(3)恐慌与贪婪指数
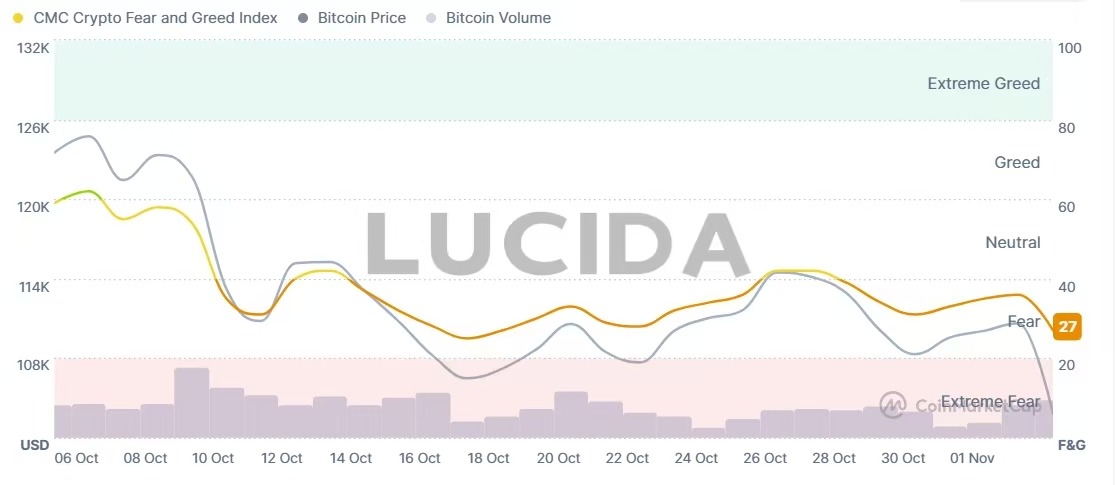
加密恐惧与贪婪指数在10月至11月初经历了从“贪婪”到“极度恐惧”的剧烈摆动。该指数在10月5日曾触及74的“贪婪”高点,彼时比特币价格也逼近历史峰值。然而,随着市场因宏观担忧(如特朗普的关税威胁)和内部结构性风险(如高杠杆清算)出现暴跌,该指数在11月4日骤降至21,进入“极度恐惧”区域。这种情绪的极端逆转,不仅反映了投资者信心的脆弱性,也常常成为判断市场短期超卖或潜在反弹时机的逆向指标——有分析师认为,这种极度的市场担忧情绪可能预示着阶段性的底部正在形成。另外,在10月的暴跌中,比特币主导率上升,而市场交易量和社交情绪全线下滑,这些共同将情绪推向了“恐惧”一端。
三、热点板块与核心叙事追踪
尽管市场整体表现低迷,资金与热度却并未离场,而是在关键赛道中重新聚集,展现出显著的结构性分化。机构资金流向与社区驱动热潮形成鲜明对比,勾勒出当前市场的多元图景。
(1)机构布局:稳健资金锚定核心赛道
在波动之中,机构资金展现出明确的偏好。比特币和以太坊现货ETF分别录得55.5亿和10.1亿美元的净流入,显示长期信心未改。更重要的是,稳定币总流通量增加93.8亿美元,表明大量场外资金正等待入场时机。这些稳健资金主要流向了几个核心叙事赛道:
AI+加密融合正向纵深发展,核心围绕“算力、数据与智能体所有权”之争。ERC-8004标准实现了AI智能体代币化,Coinbase的x402协议则为智能体间支付构建了开放通道。
RWA(真实世界资产) 迎来爆发式增长,代币化美国国债规模从8亿美元激增至73亿美元以上,由BlackRock的BUIDL、Franklin Templeton等传统金融巨头主导。
预测市场热度持续,Polymarket和Kalshi交易量增长近5倍,纽约证券交易所母公司计划最高20亿美元的投资进一步推动该赛道主流化。
(2)技术演进与监管红利并进
在机构资金布局主流赛道的同时,技术演进与监管变革也在催生新机遇:
隐私领域技术竞争白热化,可信执行环境、零知识证明和完全同态加密三大路径争夺未来标准主导权。
收益型协议成为新宠,9月DeFi协议创收约6亿美元费用,Hyperliquid过去30天收入的95%用于回购代币并奖励持有者。
加密新银行与稳定币在GENIUS法案通过后迎来转机,稳定币支付量增长约70%,显示监管明朗化对应用的直接推动作用。
(3)社区热情:Meme币的逆势狂欢
与机构理性布局形成鲜明对比的,是meme币市场的狂热。BALZ等项目在BNB链上迅速崛起,几天内筹集超200万美元,吸引超4万名社区成员。中文meme币在币安、Solana、Base生态快速走红,“币安人生”等现象级项目虽短期内市值暴涨,吸引大量新交易者,却也凸显了其可持续性的局限。
这种分化格局清晰地描绘了当前市场的复杂性:机构资金正稳健布局具有长期价值的核心赛道,而社区热情则在meme币领域寻找短期爆发机会,两条主线并行,共同构成了十月市场的完整图景。
四、 监管格局:东西分化
在全球监管前沿,东西方政策取向出现明显分化。
英国对加密货币采取了更为宽松的立场,向数字资产开放伦敦证券交易所,并解除了对加密货币交易所交易票据长达四年的禁令。分析师预测此举可能使英国加密货币市场增长20%。
与此相对,中国人民银行行长潘功胜在2025金融街论坛年会上表示,“人民银行将持续打击数字货币炒作,维护金融秩序,同时动态跟踪境外稳定币发展动态”。
美国监管也迎来重大突破。SEC批准Hashdex Nasdaq Crypto Index US ETF在新通用上市标准下运作,允许其持有除BTC和ETH外的XRP、SOL和XLM。这一决定为更多元化的加密ETF产品铺平了道路,可能显著改变机构资金配置格局。
五、 投资建议:在不确定性中寻找确定性
展望未来,数字货币市场正处于新旧叙事转换的关键节点。
美联储未来的政策路径将主要取决于两方面的平衡:一是就业市场放缓的程度;二是通胀回落的可持续性。渣打银行预测,美元将在未来1-3个月内轻微反弹至100。
从市场结构看,10月的闪崩虽然痛苦,但也是一次必要的去杠杆过程。数据显示,事件后开仓兴趣从48.7亿美元减少至45.1亿美元,资金费率下降51%。一个由信念驱动、机构资本寻求新配置机会的市场正在形成。技术创新将继续驱动市场发展。AI智能体、预测市场、RWA等叙事不仅代表了技术前沿,更是资本流动的方向盘。在传统经济增长乏力的大背景下,这些赛道可能成为未来半年市场回暖的先行者。
免责声明:本文章仅代表作者个人观点,不代表本平台的立场和观点。本文章仅供信息分享,不构成对任何人的任何投资建议。用户与作者之间的任何争议,与本平台无关。如网页中刊载的文章或图片涉及侵权,请提供相关的权利证明和身份证明发送邮件到support@aicoin.com,本平台相关工作人员将会进行核查。


