Academician of the Currency Circle: After the big rise of Bitcoin (BTC) on 8.31, it has entered a phase of adjustment. Can we see the direction by clearing the fog of the Bitcoin market? Latest market analysis and operation suggestions.
The current price of Bitcoin is 78750, and it has not continued to break upward, instead turning to high-level oscillation. Many friends are feeling conflicted recently about whether to chase high to enter the market or short at high points, fearing that buying will land them at a peak and selling will make them miss a new rising round. The high-level range after a big increase easily distorts people's mindset; a slight rise leads to fantasies of a big bull market, while a slight drop causes panic about a major correction. The market's bull-bear game has entered a heated stage; do not let intraday spikes and short-term fluctuations disrupt your rhythm.
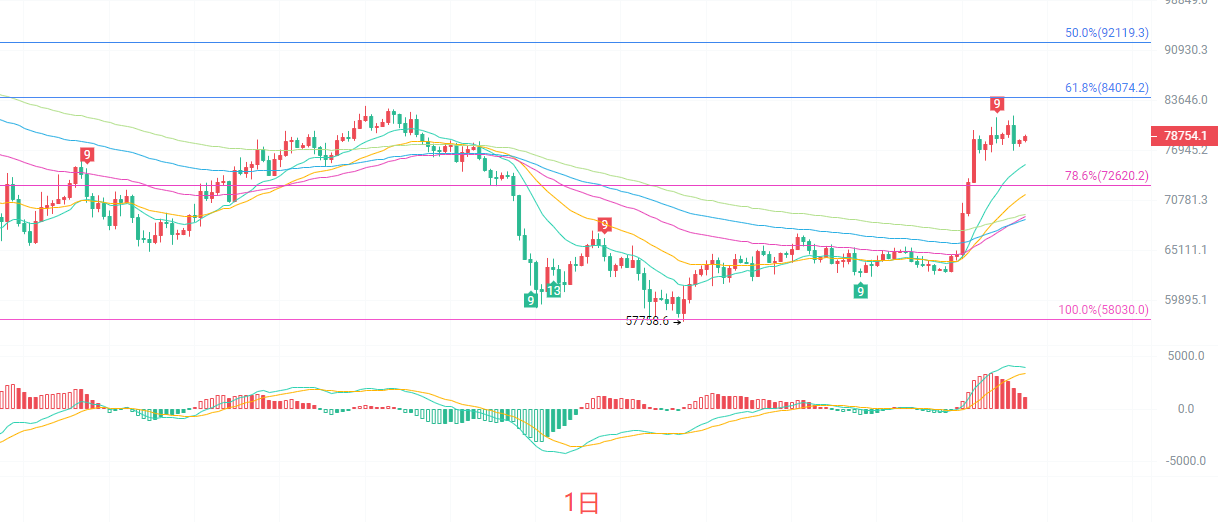
The daily K-line stands firm above all EMA moving average systems, with medium- and long-term moving averages diverging upward, maintaining a bullish trend. The MACD indicator's red columns have contracted, showing a significant decrease in bullish momentum compared to peak phases, indicating a need for short-term correction and consolidation. The Bollinger Bands are opening upward, with the current price operating inside the upper track, strong resistance above looking towards 84072, and key support below falling at the Fibonacci 78.6% level of 72620. There are no clear signals of a top reversal in the daily line, but the momentum for high-level rises is weakening, making it unsuitable to blindly chase long positions. The market is likely entering a wide oscillation phase, waiting for directional selection; operation should prioritize waiting for a pullback to support before considering positioning.
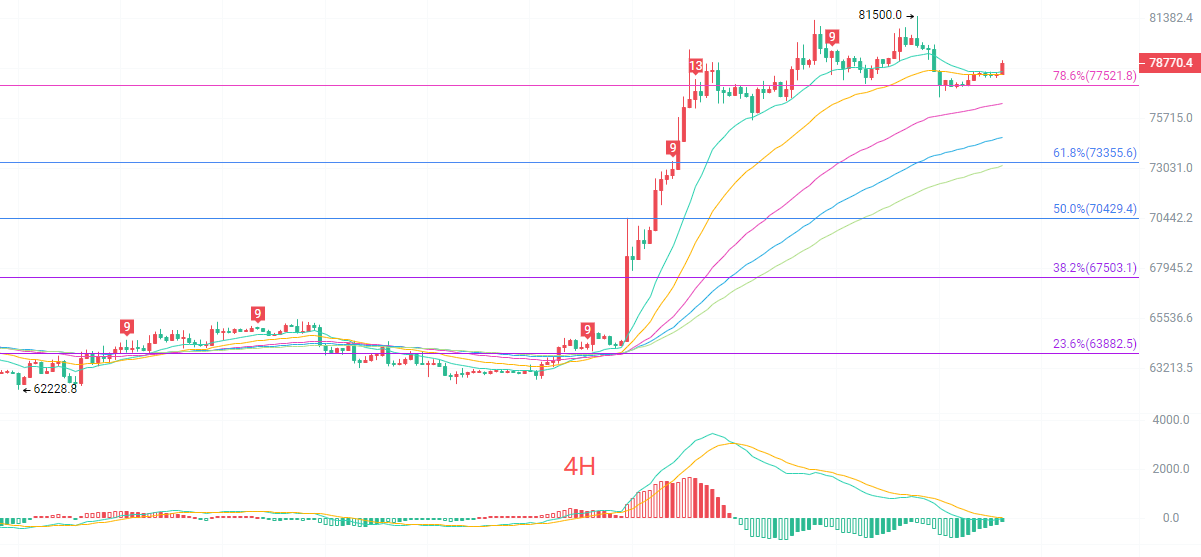
The four-hour K-line is oscillating above the Fibonacci 78.6% level of 77521. The short-term EMA moving average group still shows a bullish arrangement, but the short-term moving averages are tangled, and the upward momentum is slowing. The MACD has entered the green column range, and short-term bearish forces are being released, indicating a repair market following the rise. The middle track of the Bollinger Bands has formed important short-term support, with key support below at 77521 and further strong support at 73355. The resistance above remains at the previous high point of 81500; only by effectively stabilizing at this level can the bulls restart a new round of increases. The four-hour level belongs to high-level oscillation repair without establishing a one-sided trend. Frequent back-and-forth spikes will be observed; avoid chasing highs and cutting losses in the short term, and try to trade close to support and resistance levels.
Short-term reference:
Upward from 77600 to 77200, stop loss at 500 points, target looking at 80200 to 81200.
Downward from 81200 to 81600, stop loss at 500 points, target looking at 80000 to 79000.
Specific operations should be based on real-time market data. For more information, you can consult me. The publication of the article is delayed; suggestions are for reference only and risk is self-borne.

Warm reminder: The above content is only created by the author's public account, and the advertisements at the end of the article and in the comment section have nothing to do with the author. Please distinguish carefully, and thank you for reading.
免责声明:本文章仅代表作者个人观点,不代表本平台的立场和观点。本文章仅供信息分享,不构成对任何人的任何投资建议。用户与作者之间的任何争议,与本平台无关。如网页中刊载的文章或图片涉及侵权,请提供相关的权利证明和身份证明发送邮件到support@aicoin.com,本平台相关工作人员将会进行核查。