Dear teammates, today's market has an overwhelming amount of information. The probability of the Federal Reserve raising interest rates by 25 basis points in September has surged to 57%, directly suppressing the market's risk appetite. Meanwhile, the HYPE-led $820 million token unlock, combined with the attack on the Fogo mainnet resulting in the theft of 400 million tokens, has left the altcoin market in a state of alarm. Due to risk-averse sentiment, capital is concentrating on mainstream assets like Bitcoin, which is also why Bitcoin is still able to hold above 78,000 despite the negative news surrounding it. The question is, how long can this defense last? Let's look directly at the data.
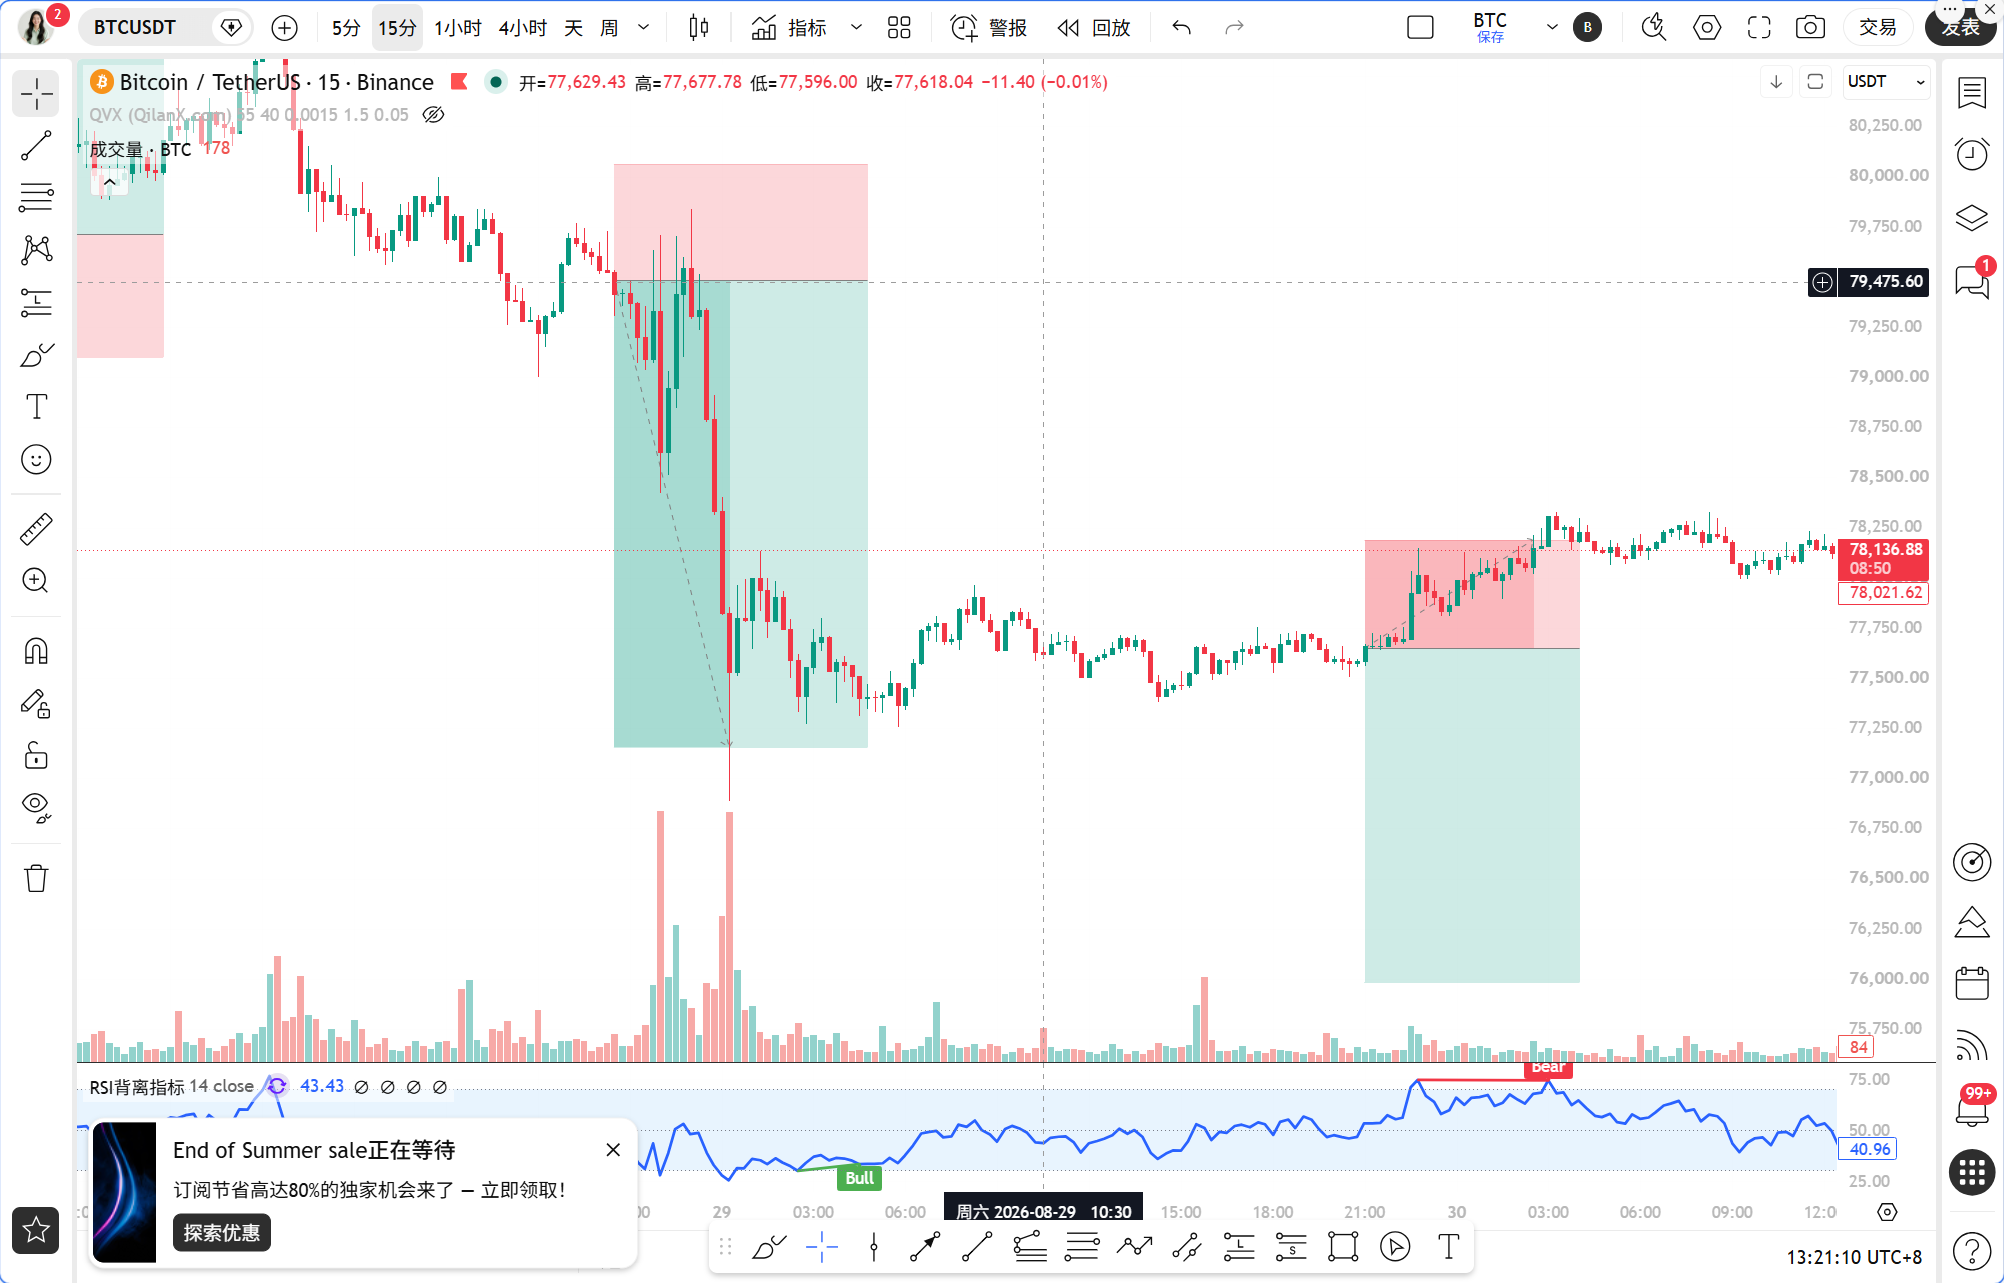
Current time is August 30, 13:21, with Bitcoin quoted at 78,137 USDT, and the 24-hour increase has narrowed to 0.57%. This position is very delicate, just a step away from the psychological barrier of 80,000, but the selling pressure from profit-takers looms large. Short-term holders are nearly 15% in profit, which means that any slight disturbance could trigger a sell-off. Additionally, the mysterious address with a $4.324 million high-leverage long position showing a loss of 362,000 also indicates that the battle between bulls and bears has reached a boiling point at this level.
First, let's look at the long-term cycle. On the daily chart, the RSI is as high as 82.19, severely overbought, and while the MACD histogram is still positive at 499.62, the divergence between DIF and DEA is showing signs of convergence. The MA30 is at 69,238, and the price is more than 12% away from the moving average, indicating a strong technical demand for mean reversion. However, there is no death cross appearing on the daily MACD, and the mid-term bullish structure has not been broken; it only needs to digest the short-term gains.
Next, we look at the 4-hour level, where a clear divergence signal has appeared. The price is rebounding, but the MACD histogram shows a negative value of 143.41, with a negative DIF of 58.51 and a positive DEA of 84.90, forming a typical top divergence pattern. The RSI is at 24.68, in the oversold zone, indicating that the downward momentum on the 4-hour level is still being released, but there is a need for short-term correction. The 4-hour MA30 is at 78,735, which is the first level of pressure for the current rebound.
The 1-hour level is the core battleground today. The EMA55 is at 78,300, and the current price is 78,137, just below the moving average. Over the past 8 1-hour candles, the closing price has been greater than EMA55 zero times, and there has also been zero crossings, indicating that the bears hold absolute dominance at the 1-hour level. However, the price is only 0.21% away from EMA55, which is a close-line fluctuation, making this position prone to false breakouts or breakdowns. The 1-hour MACD histogram is positive at 33.65, with a golden cross below the zero axis for DIF and DEA, indicating short-term rebound momentum, but the strength is questionable.
At the 15-minute level, the MA5, MA10, and MA30 are sticky between 78,100 and 78,142, with the MACD histogram at -0.28 and the RSI at 54.89, characteristic of a typical consolidation state. There is no clear direction in the 15-minute level; we need to wait for signals from the 1-hour level.
According to the Qinglan TPV system for validation, the current 1-hour closing price has been continuously below EMA55, satisfying the first condition for shorting. However, the second condition of resistance formation has not yet shown long upper wicks or topping, and the price is merely hovering along the moving average. The third condition of weak rebound shows that although the MACD histogram has shortened, the RSI has rebounded from the oversold zone to 68.28, which is not a weak position. Thus, strictly speaking, the shorting conditions are not fully met. Likewise, the conditions for going long are also not met because the price is below EMA55. Currently, this is a typical critical point in the trend, and the system suggests observing and waiting for a clear direction.
Regarding on-chain data, the Fear and Greed Index is at 69, in the greed zone, indicating an optimistic market sentiment, but greed often implies risk accumulation. Bitcoin's market share is at 59.48%. Under negative news, signs of capital flowing back to Bitcoin are evident. However, it is important to note that if altcoins continue to plunge, Bitcoin will ultimately be dragged down as well. The non-farm payroll report is about to be released, and Waller's hawkish remarks could aggravate market volatility, representing the biggest uncertainty today.
Key attack and defense points: the first resistance level above is the 1-hour EMA55 located at 78,300. Only by breaking through and stabilizing here can the bulls regain control. The second resistance level is at the 4-hour MA30 at 78,735, marking the mid-term demarcation between bulls and bears. The first support level below is at 77,500, which is the low point area after yesterday's steep decline and the last line of defense for short-term bulls. If it falls below 77,500, the next target will be the 76,000 integer mark.
In terms of trading ideas, I present two scenario analyses. The first scenario is that if the price closes above 78,300 for two consecutive 1-hour candlesticks without breaking back down, and the MACD histogram continues to expand, a small position can be taken to go long, with entry reference at 78,350 and stop loss at 77,900. The first target is 78,700, and the second target is 79,200. The second scenario is if the price peaks and falls back around 78,300, showing long upper wicks or topping patterns, and the 1-hour MACD histogram starts to shorten, a short position can be entered with entry reference at 78,250 and stop loss at 78,650. The first target is 77,500, and the second target is 76,800. If the price oscillates repeatedly between 77,500 and 78,300 without a clear signal, then stay out of the market and avoid engaging in this disordered volatility.
Risk warning in one sentence: Before the non-farm data is released, market fluctuations may dramatically amplify; any directional positions must be strictly managed with stop losses to avoid holding positions.
Follow Qinglan Crypto Classroom to seize more trading opportunities! Welcome to visit the official website www.qinglan.org
📊 Qinglan TPV Trading Strategy Backtest Reference
🕒 Last Backtest Time 08-30 07:00:02
Total Analysis: 3758 Backtest: 3753 Accuracy Rate: 79.4% (2980/3753)
免责声明:本文章仅代表作者个人观点,不代表本平台的立场和观点。本文章仅供信息分享,不构成对任何人的任何投资建议。用户与作者之间的任何争议,与本平台无关。如网页中刊载的文章或图片涉及侵权,请提供相关的权利证明和身份证明发送邮件到support@aicoin.com,本平台相关工作人员将会进行核查。