Cryptocurrency Scholar: On August 30, Bitcoin (BTC) faced resistance after a surge and fell back. What is the logic behind the handover of chips during this round of rising? Latest market analysis and trading suggestions.
The current price of Bitcoin is 77800, after surging high, it has begun to enter a tug-of-war phase. Many friends, upon seeing the significant rise, rushed to enter the market, only to be tortured by back-and-forth price fluctuations. After a rise, do not blindly expect further increases, nor should you directly turn bearish. The market will not move in a straight line upwards; periodic corrections and back-and-forth movements are normal. The current price is 77800, high-level divergences are already evident, and the risk of chasing the high is increasing. Many people can easily be confused by short-term bullish candles and overlook the potential danger of corrections.
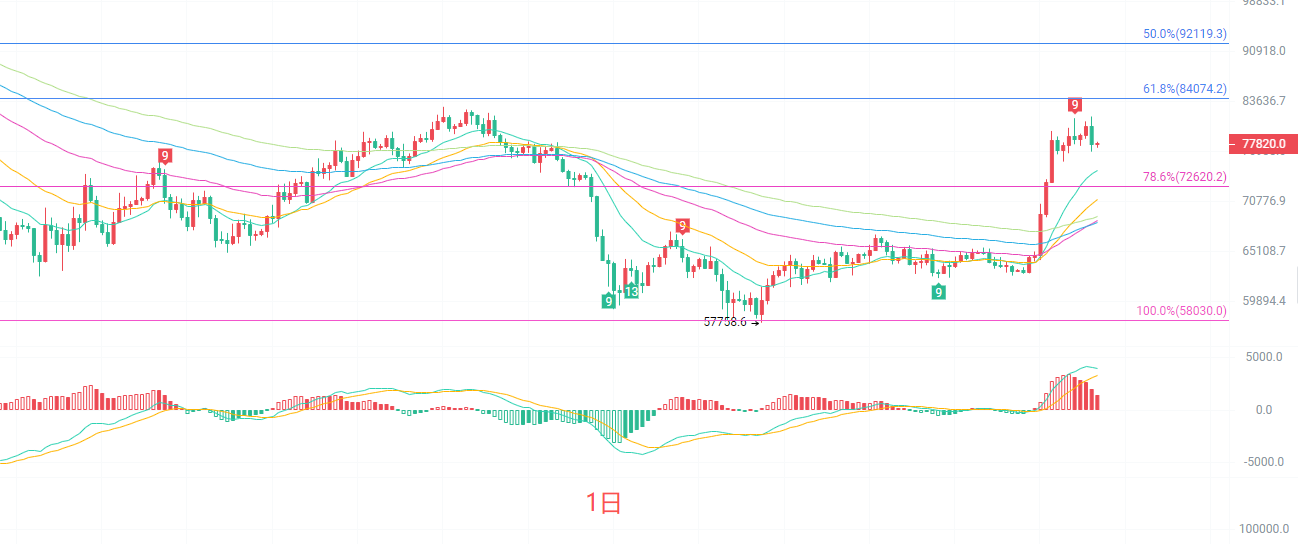
The daily K-line still stands firmly above all mid-to-long-term EMA moving averages, and the large-scale bullish structure has not been destroyed. The MACD indicator has turned down at a high level, with red bars continuously shrinking, and the upper Bollinger Band shows pressure and pulls back, indicating a gradual release of selling pressure above. The Fibonacci 78.6% level at 73890 has become the key support below. On the daily chart, it represents a high-level fluctuation correction after a large rise and does not indicate an immediate turn bearish. The short-term pressure above is at 81500, and if this level is breached, the bullish momentum will restart; however, if key support is broken, the correction space for this round of rising will further expand, and the large cycle needs to observe the defense strength of the support level.
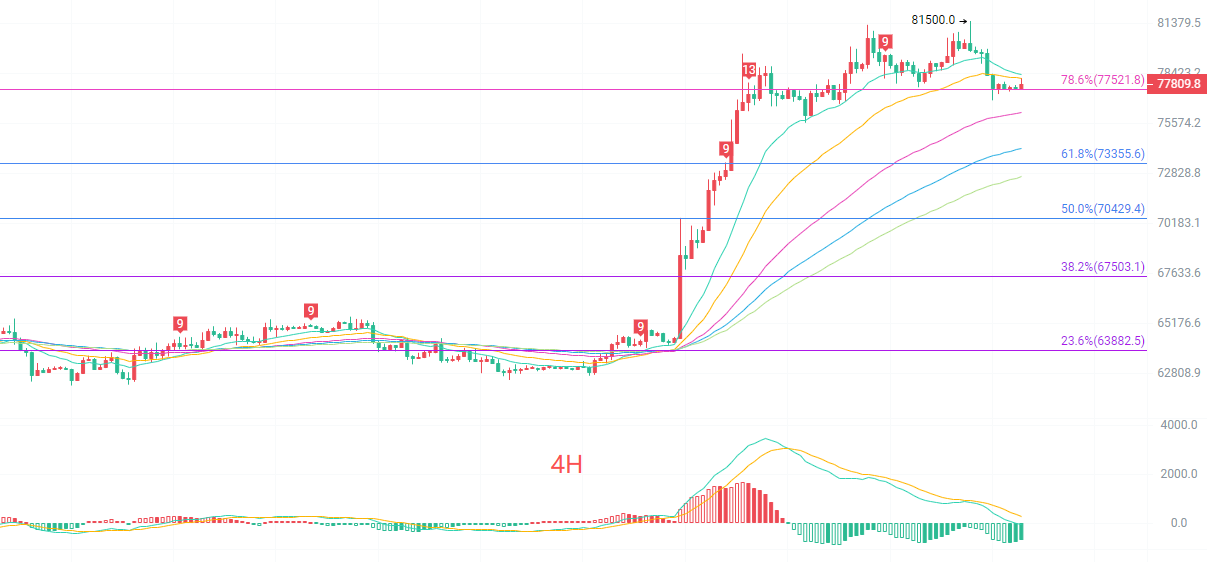
The four-hour K-line has broken below the short-term EMA15 and EMA30 moving averages. The four-hour MACD double lines are continuously declining, and green bars are constantly expanding, indicating a significant weakening of bullish momentum. The price on the Bollinger Band has retreated from the upper track to run near the middle track, entering an adjustment period in the short-term market. 77521 is the key position of Fibonacci 78.6%, and currently, there is a struggle around this position. For the bulls to regain strength, they need to rise above 79500 again; if the support is lost, it will further explore the 73355 line. The four-hour level currently belongs to the pullback phase after a bullish rise, with a short-term bias towards fluctuation and weakness; do not easily attempt to catch the bottom, and wait for signal confirmation.
Short-term reference:
Buy from 76800 to 76400 with a stop loss at 76000, target at 79500 to 81200.
Sell from 80000 to 81000 with a stop loss at 81500, target at 79000 to 78000.
Specific operations should be based on real-time market data; for more information, feel free to consult the author. There may be delays in article publishing; suggestions are for reference only and risks are borne by individuals.

Reminder: The above content is only created by the author of the public account. Advertisements at the end of the article and in the comments section are unrelated to the author; please discern carefully. Thank you for reading.
免责声明:本文章仅代表作者个人观点,不代表本平台的立场和观点。本文章仅供信息分享,不构成对任何人的任何投资建议。用户与作者之间的任何争议,与本平台无关。如网页中刊载的文章或图片涉及侵权,请提供相关的权利证明和身份证明发送邮件到support@aicoin.com,本平台相关工作人员将会进行核查。