Cryptocurrency Expert: The trend of Ethereum (ETH) on August 30 is not yet over, but the signs of a correction have quietly been laid down? Latest market analysis reference
The current price of Ethereum is 2445. After reaching a high, it began to oscillate and many friends started to have doubts. Has this wave of increase already completed? Should we chase or run now? Many people fear a correction upon seeing the previous high points, afraid that if they enter the market, they will be stuck at the peak, and once they hold onto it, they worry about missing the subsequent market moves. The market is like this: greedy when it goes up, fearful during oscillations. From the chart, the bullish trend has not been directly destroyed, but the short-term upward momentum has clearly diminished, and divergences have started to appear at the high levels.
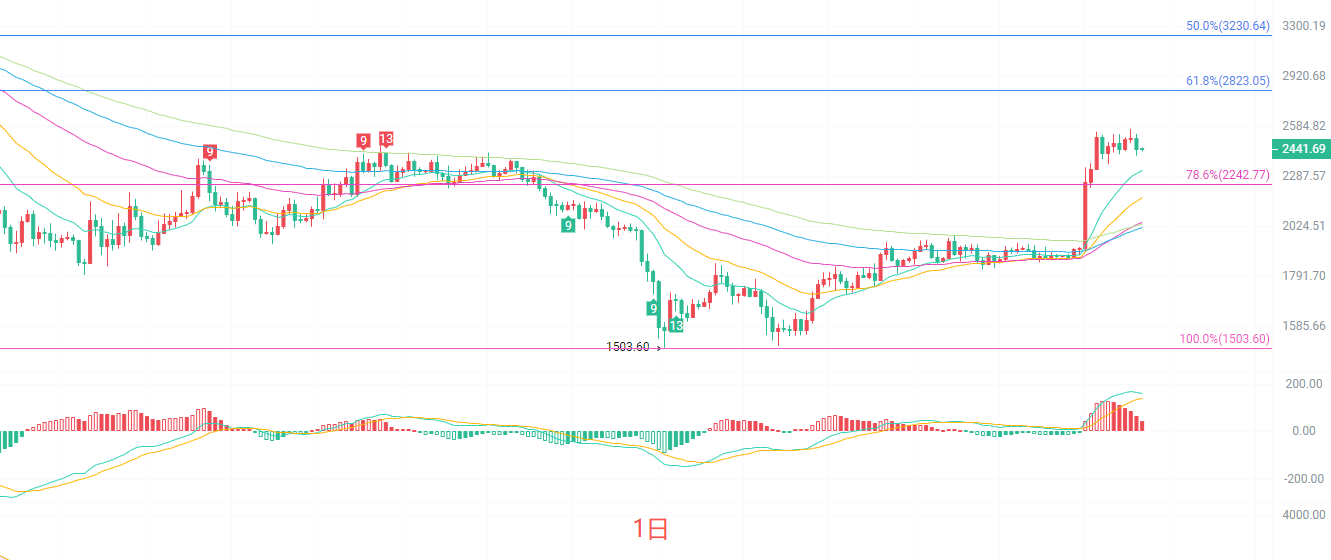
The daily candlestick is currently in a high-level pullback phase. The price is above multiple EMA moving averages, and the medium to long-term moving averages are diverging upwards, maintaining a large-scale bullish structure. The MACD indicator has curved at a high level, with red bars continuously shrinking, and the upward momentum is gradually weakening. The Bollinger Bands are opening upwards, and the current price is pulling back inside the upper Bollinger Band. The key resistance above is 2566, and the primary support below is at the Fibonacci 78.6% level of 2242. There is no clear reversal signal on the daily chart, but signs of a top divergence at high levels have appeared, making it unsuitable to continue chasing highs. The market is likely entering a phase of consolidation, waiting for direction selection, and it is advisable to wait for a pullback to support before planning actions.
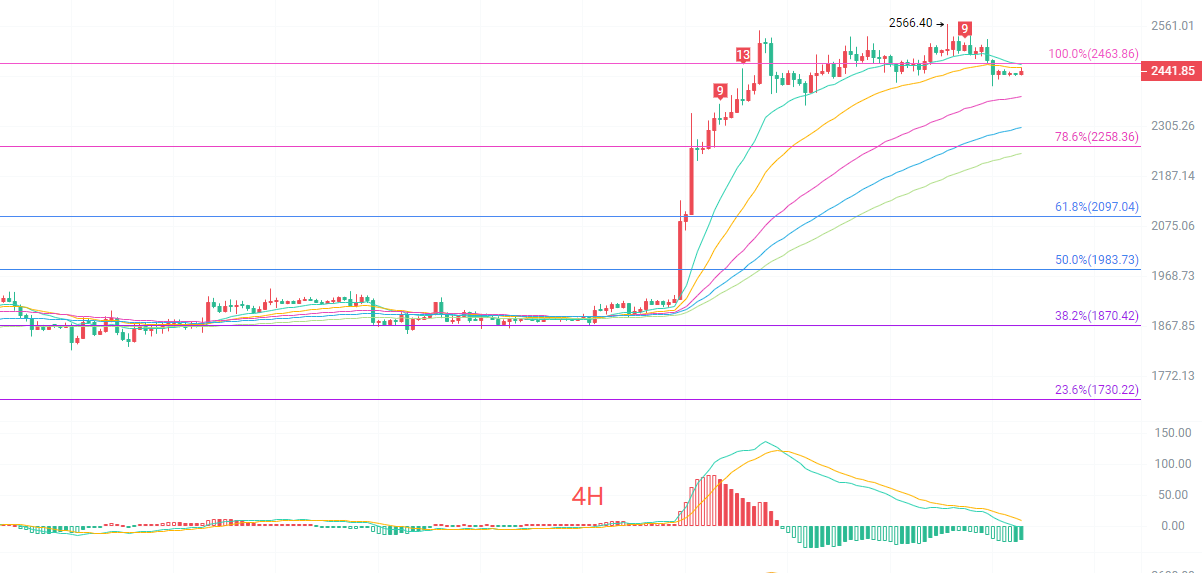
The four-hour candlestick is currently pulling back near short-term EMA moving averages. The short-term EMA15 and EMA30 are still maintaining an upward trend, but the price has fallen below the shortest-term moving average, indicating a decline in short-term bullish strength. The MACD has completed a dead cross at a high level, continuously outputting green bars, with short-term correction pressure evident. The Bollinger Bands are starting to narrow, indicating that volatility is decreasing and entering a consolidation range. The resistance above is at 2463, which corresponds to the 100% Fibonacci level of the current upward movement, and the first support below is at 2258. The four-hour chart is in a recovery phase after an increase, not completely turning bearish but also unlikely to violently re-ascend directly. Short-term oscillations will occur back and forth, with bulls and bears vying in this area. In the short term, avoid chasing highs and lows; wait for the price to approach key support and resistance levels before considering an entry.
Short-term reference:
If the price does not break below 2300 to 2250, go long, with a stop loss of 40 points and a target looking at 2520 to 2620.
If the price does not break above 2540 to 2560, go short, with a stop loss of 40 points and a target looking at 2500 to 2450.
Specific operations should be based on real-time data from the order book. For more detailed information, you can consult the author. There may be delays in article release; it is suggested to use this information for reference only and bear the risk yourself.

Warm reminder: The above content is solely created by the author of the public account. Advertisements at the end of the article and in the comment section are not related to the author. Please discern carefully. Thank you for reading.
免责声明:本文章仅代表作者个人观点,不代表本平台的立场和观点。本文章仅供信息分享,不构成对任何人的任何投资建议。用户与作者之间的任何争议,与本平台无关。如网页中刊载的文章或图片涉及侵权,请提供相关的权利证明和身份证明发送邮件到support@aicoin.com,本平台相关工作人员将会进行核查。