Cryptocurrency Circle Academician: The major trend of Bitcoin (BTC) on August 27 is still in effect, but the short-term pullback risk cannot be ignored? Latest market analysis and operational advice explained
Bitcoin's current price is 78000. After a strong surge, market sentiment has been completely ignited, with bullish voices overwhelming. However, the hotter the market, the less one should get caught up in the excitement and chase the highs. A surge does not mean it will always go up unilaterally; deep pullbacks can also occur in a bull market. Many people are impulsively chasing gains, and when a pullback happens, they end up holding positions that go against them. Do not let the market's frenzy disrupt your rhythm; while you must respect the bulls' strong momentum, you must also ensure adequate risk protection. Trading should always prioritize position size and stop-loss first, do not gamble on direction, and only trade what you understand.
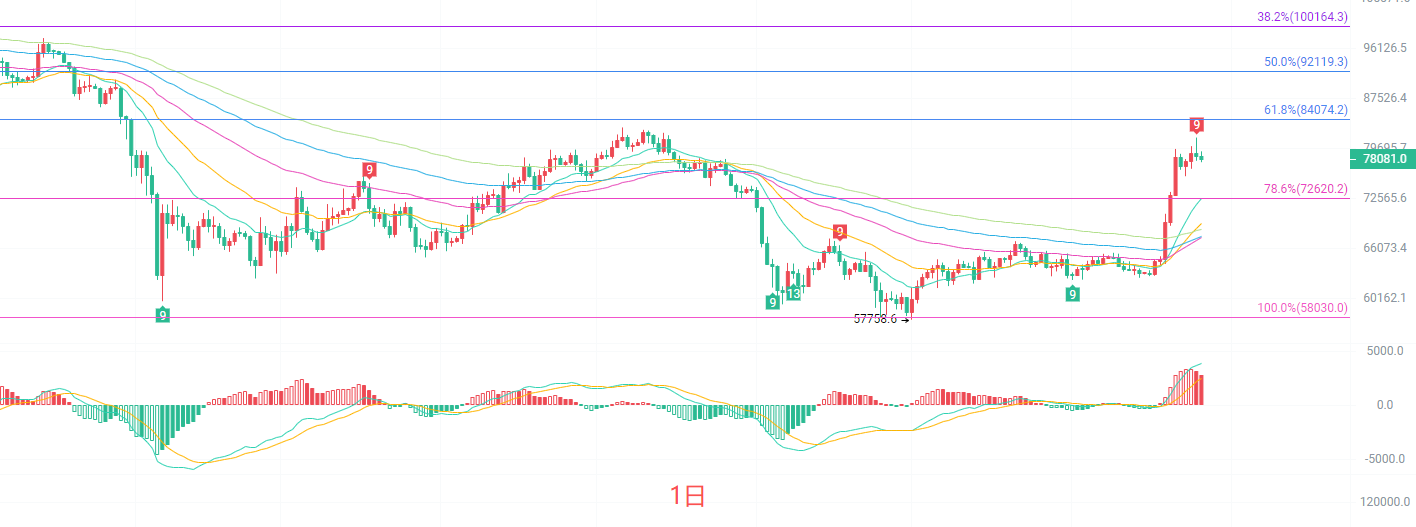
The daily K line has rebounded from a low of 57758, breaking through the Fibonacci 78.6% position of 72620, directly opening up space for upward movement. Prices are steadily above all EMA moving averages, with all short-term moving averages diverging upwards, and the bullish trend structure is complete. The MACD indicator's red bars remain high, but there are slight signs of contraction, indicating a small reduction in upward momentum. The Bollinger Bands are opening upwards, with prices running near the upper band. The first resistance above is around 80318, with strong resistance at 82828; the key support below is 72620, an important Fibonacci position in this round of increase. As long as this position is not effectively broken, the bullish structure on the daily line will not be damaged, and there is a high probability of maintaining high-level fluctuations or an inertial rise in the short term.
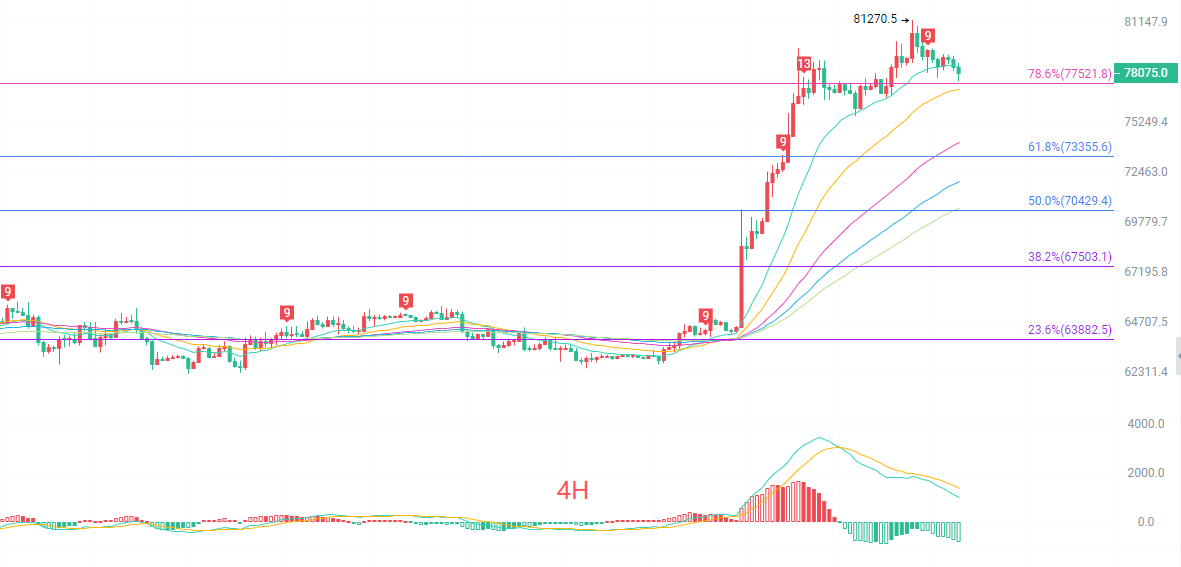
The four-hour K line started to fall and adjust after testing the high point of 81270. Prices are still operating above all EMA moving averages, and the medium-term bullish trend has not directly reversed. However, the MACD has shown signs of a top divergence, with the DIF starting to turn downwards, and the red bars continuously shrinking, indicating that bearish volume is gradually being released. The upper Bollinger Band has started to close downwards, with prices falling from the upper band towards the middle band. The pressure above is in the range of 79500 to 80300, with the first support below at 75500 and strong support at 73355. The four-hour level requires a pullback for repair; it is difficult to continue a blind surge in the short term, and it is likely to experience high-level fluctuations to digest profits. After the fluctuations, the next direction will be chosen. Do not blindly chase long positions in the short term.
Short-term reference:
Buy from 78000 to 77500, stop-loss at 77000, target aims at 80000 to 81500
Sell from 80000 to 81000, stop-loss at 81500, target aims at 79000 to 78000
Specific operations should be based on real-time market data. For more information, please consult the author. The publication has a delay; recommendations are for reference only and risk is self-assumed.

Warm reminder: The above content is only created by the author's official account. Ads at the end of the article and in the comments section are unrelated to the author. Please exercise caution in discerning them. Thank you for reading.
免责声明:本文章仅代表作者个人观点,不代表本平台的立场和观点。本文章仅供信息分享,不构成对任何人的任何投资建议。用户与作者之间的任何争议,与本平台无关。如网页中刊载的文章或图片涉及侵权,请提供相关的权利证明和身份证明发送邮件到support@aicoin.com,本平台相关工作人员将会进行核查。