Cryptocurrency Expert: The Ethereum (ETH) rebound wave on August 27 has reached a crossroads. How should Ethereum break the current situation? Latest market analysis reference.
The current price of Ethereum is 2450, and the struggle between bulls and bears has already shown significant intensification. After a big rise, it will not continue to rise mindlessly in one direction; consolidation and shaking out positions could happen at any time. Many people always think about chasing after highs to squeeze out the last bit of profit, but they often fall into traps during high corrections. When trading, do not let short-term large bullish candles cloud your judgment; do not blindly maintain a bullish or bearish outlook. It is crucial to see the key support and resistance levels clearly and to plan your stop-loss in advance; this is fundamental to surviving in the market for the long term. After a sharp rise, it is even more important to learn to restrain desires and not impulsively open positions, more so than trying to catch every market wave.
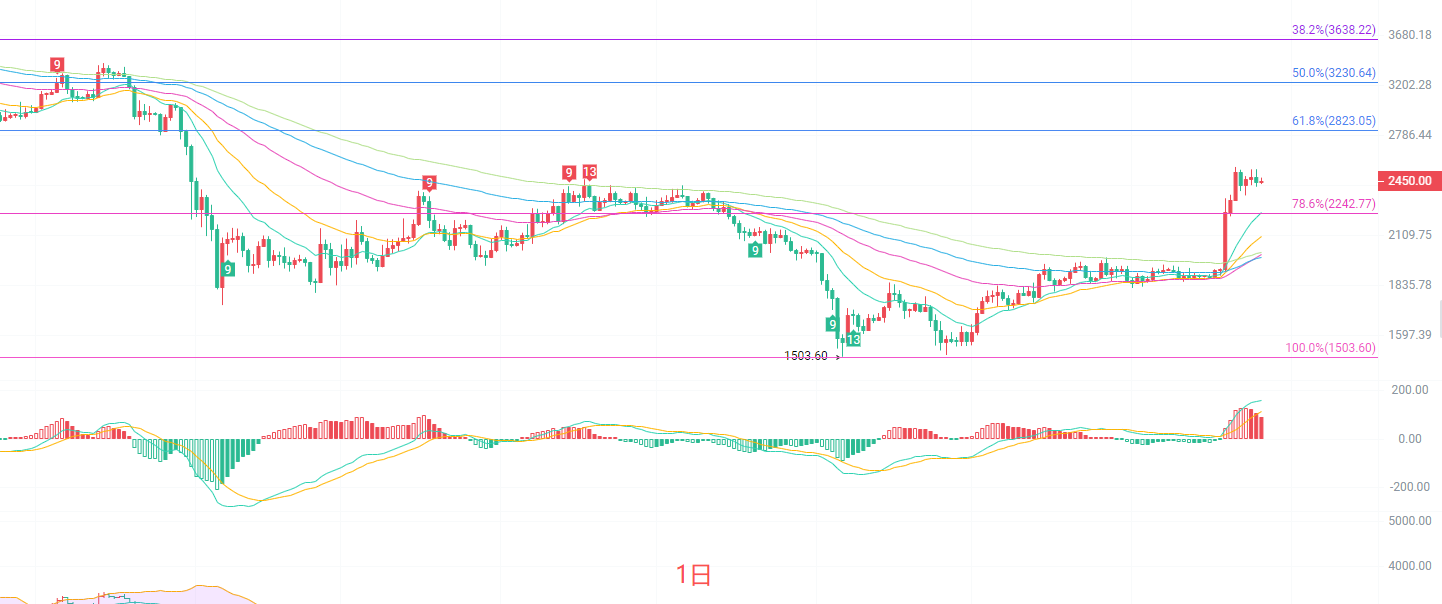
After experiencing a substantial rebound, the daily K-line has stabilized above all short-term EMA moving averages, and the entire moving average system has turned upwards, signaling an open mid-term bullish trend. The MACD indicator maintains red bars, and bullish momentum still exists, but the indicator has entered a relatively high region, creating a potential divergence risk. The Bollinger Bands are opening upwards, with prices running near the upper band. The primary resistance above looks towards around 2786, while the key support below rests at the 2242 Fibonacci 78.6% level. After a large bullish candle on the daily chart, the pace of the rise has slowed, entering a high-level consolidation phase. Do not aggressively chase bullish positions on the daily level; if the support at 2242 is effectively breached, the strong structure of this rebound will be compromised, and the market will shift into a deep pullback for correction.
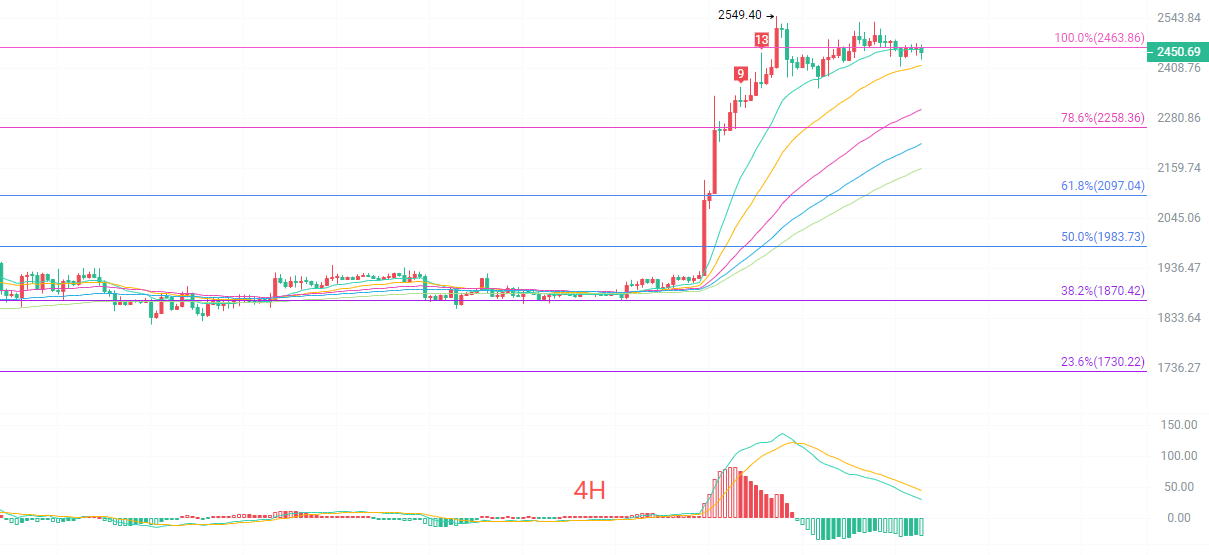
After the four-hour K-line peaked at 2549, it began to fall and adjust, currently retreating near the previous high, oscillating. The short-term EMA moving averages still maintain a bullish arrangement, but the 15-period moving average has shown signs of turning. The MACD red bars continue to shorten, with green bars gradually emerging, indicating that short-term bullish momentum is continuously decreasing, and signals of a pullback are accumulating. The upper Bollinger band faces pressure to decline, with prices running above the Bollinger middle band. The key Fibonacci support is at 2463, followed by 2258. The four-hour level is in a pullback phase following an increase. As long as the key support is not effectively breached, the larger structure remains bullish, but there is a need for further pullback and energy accumulation on the short term. If pressure persists, it is likely to test the moving average support before deciding on the next direction.
Short-term reference:
If the price does not break below 2440 to 2410, target north with a stop loss of 40 points, with a target ranging from 2510 to 2560.
If the price does not break above 2530 to 2560, target south with a stop loss of 40 points, with a target ranging from 2470 to 2420.
Specific operations should primarily rely on real-time market data. For more detailed information, you can consult the author. There may be delays in the publication of articles, and the advice provided is for reference only, with risks borne by the reader.

Kind reminder: The above content is originally created by the author and published on the official account. The advertisements at the end of the article and in the comment section are unrelated to the author. Please discern carefully. Thank you for reading.
免责声明:本文章仅代表作者个人观点,不代表本平台的立场和观点。本文章仅供信息分享,不构成对任何人的任何投资建议。用户与作者之间的任何争议,与本平台无关。如网页中刊载的文章或图片涉及侵权,请提供相关的权利证明和身份证明发送邮件到support@aicoin.com,本平台相关工作人员将会进行核查。