Academician of the Coin Circle: The surge on August 26 for Bitcoin (BTC) is not just mindless chasing. Can you grasp the timing of Bitcoin's offensive and defensive strategies by understanding the K-line signals? Latest market analysis and trading advice explained.
The current price of Bitcoin is 79,400, and it surged to nearly 81,300. Many friends are now entangled, wondering whether to chase the trend or wait for a pullback to position themselves. The market is booming, and those who missed the opportunity are anxious, while others who hold long positions are worried about a drop after the high, fearing profit reversal. The market is always like this; after a big rise, emotions become polarized. Some firmly believe that a new round of main rising is starting, looking for higher positions, while others think the rise is too much and anticipate a deep correction at any time.
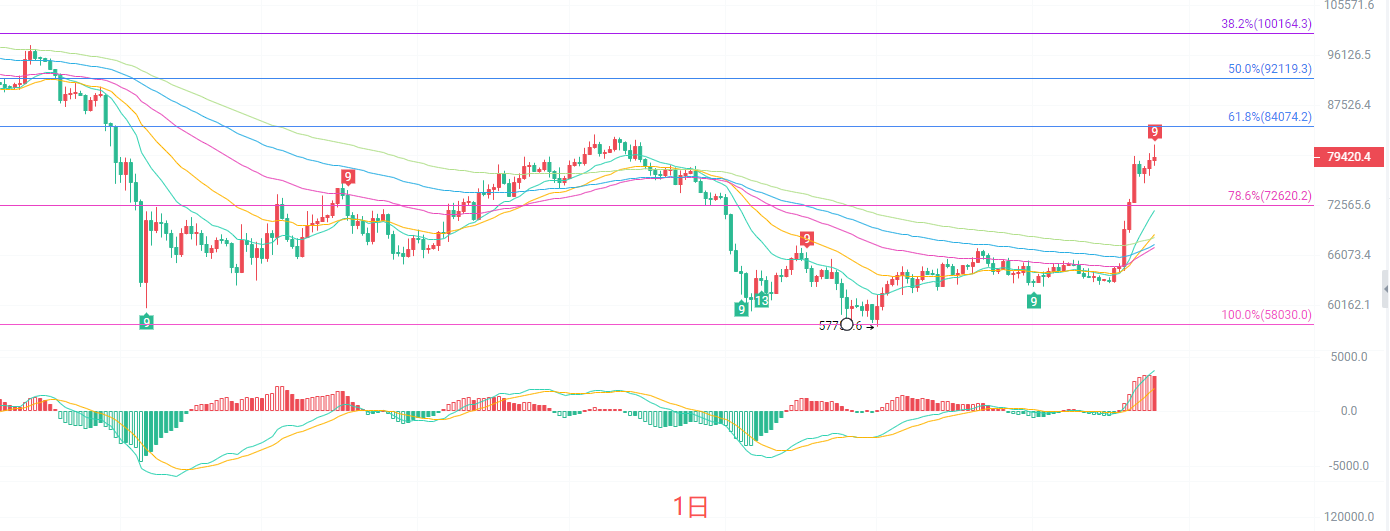
The daily K-line has shown a strong rebound. The price effectively stands above multiple EMA moving averages, and the moving average system has turned upwards, forming a bullish arrangement. The MACD indicator DIF and DEA are both rising, and the red bars continue to release, maintaining strong bullish momentum; the Bollinger Bands are opening upwards, with prices running near the upper band. The key resistance above is the previous high of 81,270. If effectively broken, the bullish space will further open; the main support below is at the Fibonacci 78.6% level of 72,620. On the daily level, the overall trend is bullish, but after a continuous rise in the short term, there is a technical need for a pullback to repair; it is not ruled out that after a high surge, there will be a pullback to confirm support. It is advised not to chase highs blindly and to wait for pullback opportunities for a more prudent approach.
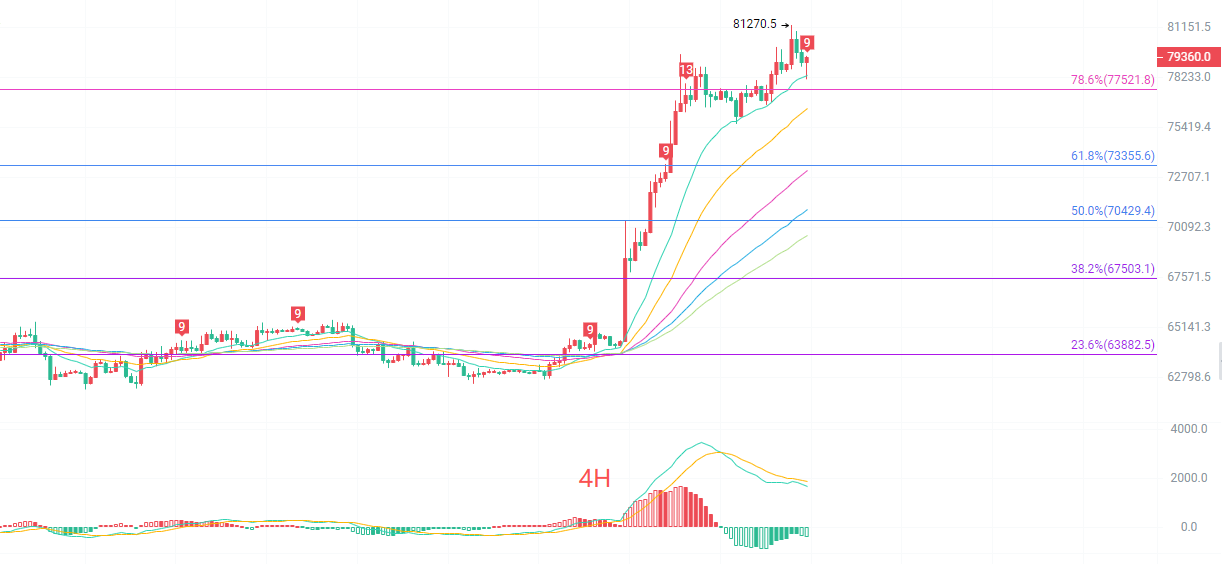
The four-hour K-line is currently in a high-level oscillation digestion phase. The short-term EMA moving averages are still diverging upwards, providing strong support. The major bullish trend has not been broken. The MACD red bars are gradually shortening, and there are signs that DIF may turn down, showing a warning signal for a top divergence, indicating a decline in short-term bullish momentum. The Bollinger Bands channel is upward, with prices retreating from the upper band towards the middle band. The pressure above is 81,270, and the first support below is at the Fibonacci 78.6% level of 77,521. The four-hour level has a need for a pullback to accumulate strength; the market is unlikely to go straight up aggressively but will likely oscillate and pull back to clear floating positions before choosing the next direction.
Short-term reference:
Buy between 77,500 to 77,000 upwards, stop loss at 76,200, target looking at 82,000 to 85,000.
Sell between 81,000 to 81,500 downwards, stop loss at 82,600, target looking at 77,500 to 74,000.
Specific operations should be based on real-time market data. For more details, you can consult the author. The article is published with a delay, and the suggestions are for reference only, risk is to be borne by oneself.

Kind reminder: The above content is solely created by the author of the official account; advertisements at the end of the article and comments section are unrelated to the author. Please discern carefully, and thank you for reading.
免责声明:本文章仅代表作者个人观点,不代表本平台的立场和观点。本文章仅供信息分享,不构成对任何人的任何投资建议。用户与作者之间的任何争议,与本平台无关。如网页中刊载的文章或图片涉及侵权,请提供相关的权利证明和身份证明发送邮件到support@aicoin.com,本平台相关工作人员将会进行核查。