Liying Chat Currency: 8.26 Bitcoin (BTC) and Ethereum (ETH) Latest Market Analysis
Family members! The current price of Bitcoin is 79300, and both the trend line and moving averages are still maintaining a beautiful upward divergence pattern, indicating that the majority is still in the market. At such times, do not easily guess the top and short the market; going with the trend is the way to go. What we need to do is wait for it to pull back to the key support level, confirm it has stabilized, and then jump in to secure a steady profit. The technical indicators show a very healthy bullish pattern. The EMA moving average system is in a perfect bullish arrangement, and the MACD indicators DIF and DEA are still well above the zero line, which is a normal pullback in a strong area that does not damage the upward structure; the price is operating between the middle track at 78703 and the upper track at 80826, with the middle track forming the first strong support and the upper track being a short-term pressure point. Overall, there are no signs of a top divergence or volume stagnation signal on the technical front, indicating a high probability of trend continuation.
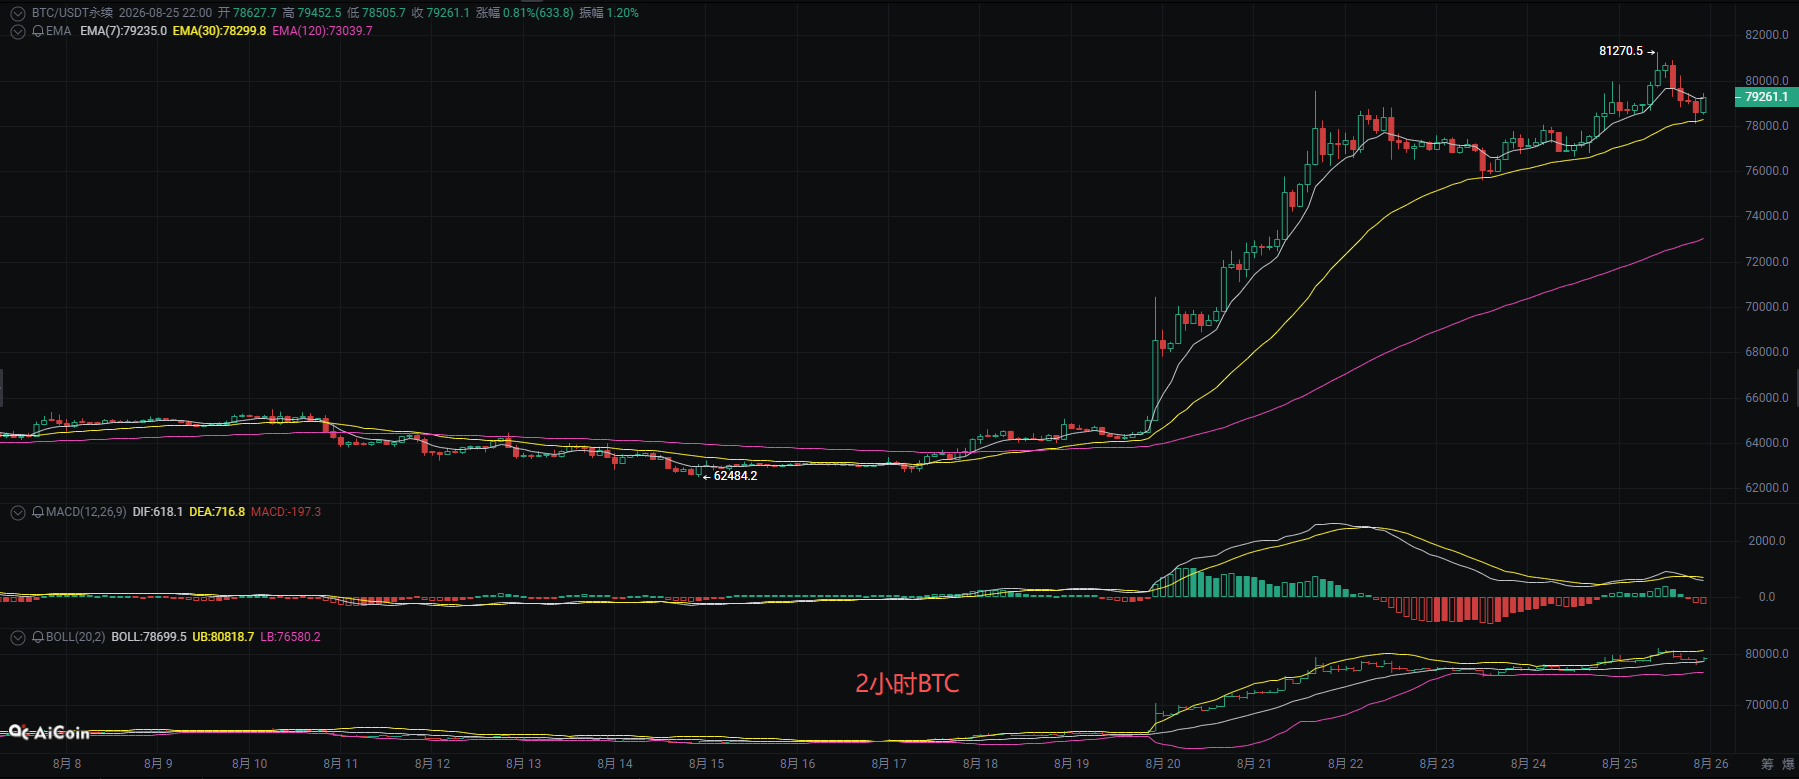
Short-term trading ideas reference:
Buy the dip at 78500-78000, stop loss 500 points, target 80000 aiming for 82000.
Sell the rise at 83000-83500, stop loss 500 points, target 72500 aiming for 71500.
Ethereum
Family members, the current price of Ethereum is 2475, consolidating sideways; many people are starting to panic, asking if it’s not going to rise and will fall instead? Actually, if everyone looks closely, it’s like climbing a mountain and getting tired, so we set up a tent to rest halfway. The big trend is still upward. The current pullback clearly shows reduced volume, indicating that the main force has not exited the market, but is washing out those uncertain retail investors. From the technical perspective, the moving average system shows a solid long-term bullish arrangement. The MACD indicator signals weakened short-term momentum, and the price is currently operating near the middle track at 2473, with the middle track turning up to provide support, while the upper track at 2514 constitutes short-term pressure. Overall, the indicators suggest a healthy pullback rather than a trend reversal, and as long as the price does not effectively break below the resonance support area of the middle track and EMA30, the bullish structure remains intact.
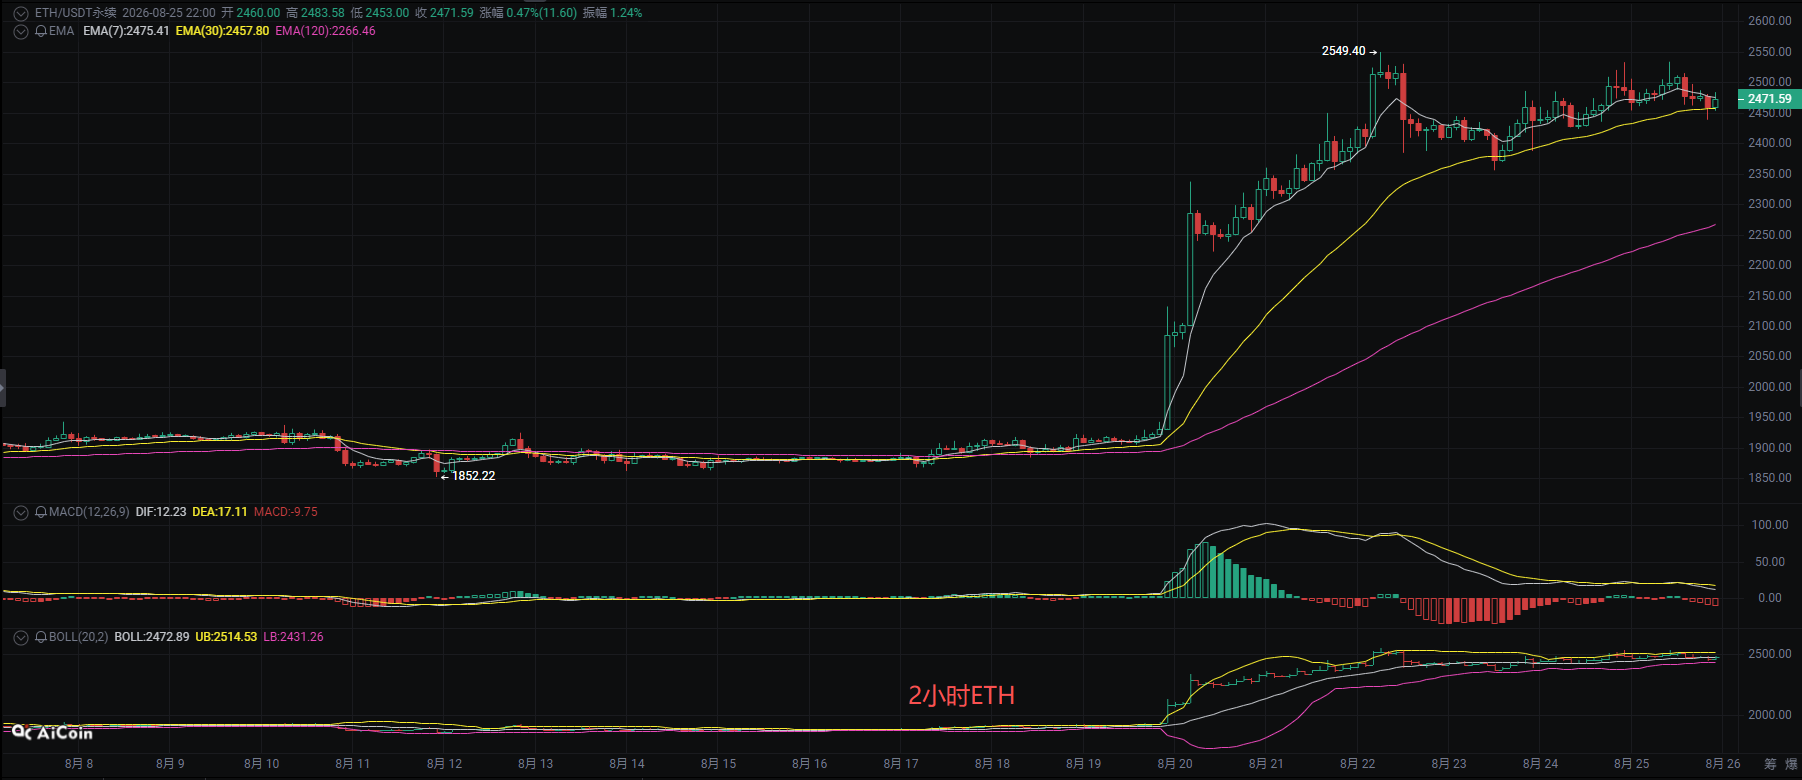
Short-term point of reference:
Buy the dip at 2450, defend at 2420, stop loss 40 points, target 2550 aiming for 2600.
Sell the rise at 2550, defend at 2570, stop loss 40 points, target 2500 aiming for 2450.
The above content is exclusively original by Liying; please indicate the source for reposting! There may be delays in article publishing and review; market conditions change rapidly, and the above suggestions are for reference only at your own risk.

Warm reminder: The above content is solely created by the author of the public account, and the advertisements at the end of the article and in the comment section are unrelated to the author. Please be cautious in discerning, thank you for reading.
免责声明:本文章仅代表作者个人观点,不代表本平台的立场和观点。本文章仅供信息分享,不构成对任何人的任何投资建议。用户与作者之间的任何争议,与本平台无关。如网页中刊载的文章或图片涉及侵权,请提供相关的权利证明和身份证明发送邮件到support@aicoin.com,本平台相关工作人员将会进行核查。