Key Summary
On August 24, 2026, the closing indices of the U.S. stock market showed divergence: the Dow Jones Industrial Average rose by 0.26% to 53,417 points, the S&P 500 fell by 0.28% to 7,653 points, and the Nasdaq Composite dropped by 0.76% to 25,980 points, with funds clearly shifting from growth to defense before earnings week. The strongest performer of the day was Strategy (MSTR), closing at 122.63 dollars, up +2.83% for the day, but it did not buy any Bitcoin with the 2.01 billion dollars raised from issuing new shares last week. On the same day, Bitcoin saw a weekly increase of 22%, yet only two out of six cryptocurrency stocks closed in the green. This article dissects three things: the "amount of Bitcoin per share" to look for when reading announcements for stock offerings, how to use Beta as a position amplifier, and the guiding pillar that the SMTC earnings report needs to verify after hours tonight.
1. Today's Market: Index Divergence, Money Shifts from Growth to Defense
First, let's look at the closing of the day.
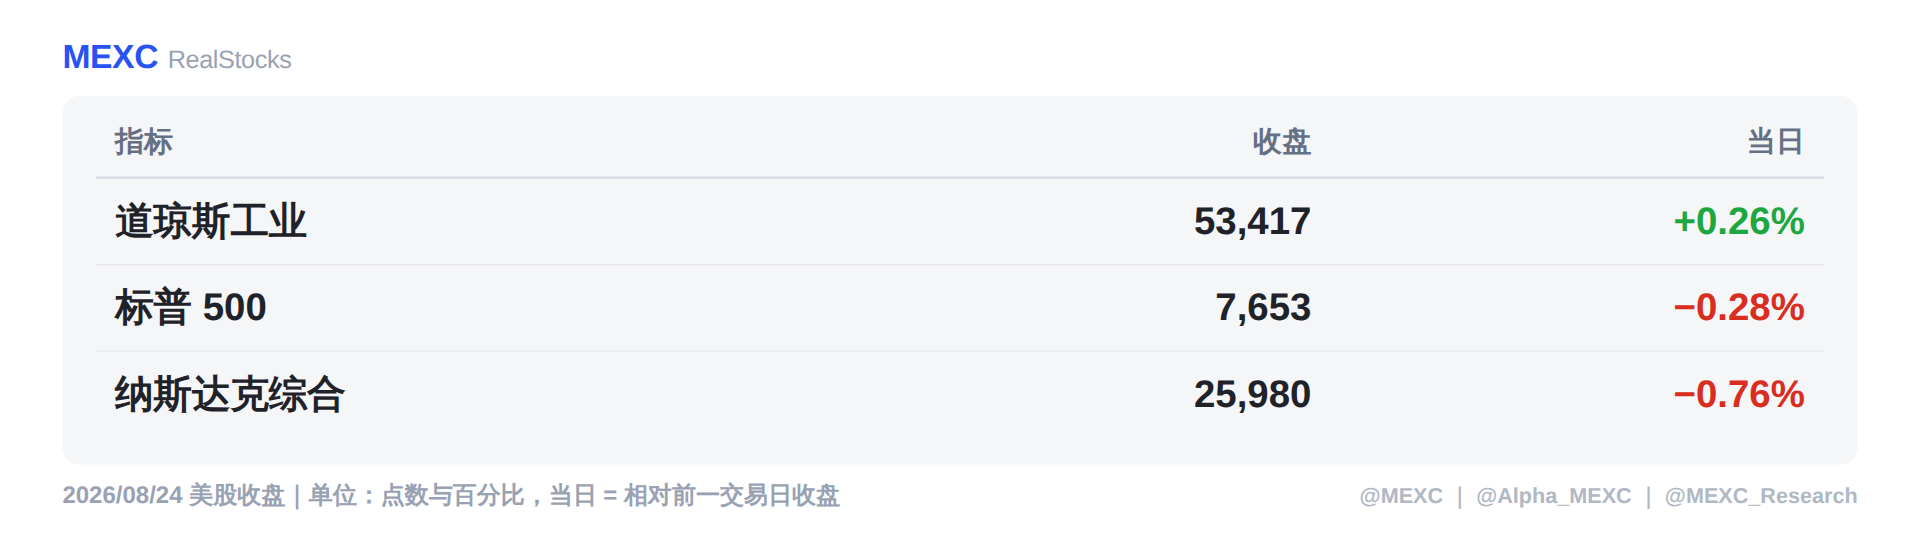
The Dow closed in the green, while the S&P and Nasdaq closed in the red; this is not simply "mixed performance," but rathermoney is changing positions: on that day, the technology sector averaged a decline of about 0.97%, while the consumer defense sector rose about 1.82%.
NVIDIA (NVDA) closed down 2.91% to 208.48 dollars. Worth noting is that there were no new news specific to it that day, and this decline can be attributed tothe cautious reduction of positions before the earnings report after the market on Wednesday—the market reduces risk exposure before an event, which is a common behavior pattern during earnings week and is separate from fundamental judgments.
Pinduoduo (PDD) announced its earnings report before the market opening on Monday, with the stock down 1.48% to 87.07 dollars that day. Revenue grew 8% year-over-year to 112.4 billion yuan, but adjusted net profit fell about 13% year-over-year, as increased ecological investment weighed on profits, with management also noting changes in the global trade and regulatory environment. This is a typical combination of "revenue still increasing, profits declining."
On the other side, precious metals. The December gold futures are stuck near the historical high range of 4,700 dollars, while the Nasdaq gold sector on that day averaged +0.74%, with the semiconductor sector down −1.82%. Between the rise and fall, the preference of funds that day was clearly written.
2. Today's Star: Strategy Rises 2.83%, But Did Not Buy Any Bitcoin This Time
The strongest performance of the day was Strategy (MSTR, formerly MicroStrategy), closing at 122.63 dollars, up +2.83% for the day, increasing its market cap by about 1.1 billion dollars to 40.6 billion; volume was 41.02 million shares, about twice the daily average.
But the real news is not this rise.
Last week the company raised 2.01 billion dollars from issuing 18.26 million shares, while the number of Bitcoins did not increase at all. Of this money, 1.59 billion dollars went into a newly established cash account in dollars, raising the dollar reserves to 5.1 billion. The company's holdings remain at 840,447 Bitcoins, with an average cost of 75,385 dollars per coin—since the coin price has returned above 77,000 dollars, this batch of holdings has turned positive on paper.
One-Minute Concept: Issuing New Shares to Buy Bitcoin, Looks at "Amount of Bitcoin per Share"
This type of company is most often compared by the measure of how much Bitcoin corresponds to each share.
The company issues new shares at market price for cash; the increase in the number of shares is called dilution—however, if the money obtained is converted into more Bitcoins, the Bitcoins behind each share actually increase, which makes dilution beneficial to shareholders.
The announcement on August 24 is a counterexample: shares were issued, but the number of Bitcoins did not increase.
Therefore, the method for reading such announcements is quite fixed: first capture two numbers—how much the number of shares has increased, and how much the number of Bitcoins has increased. Looking at both together helps determine whether the amount of Bitcoin per share is increasing or decreasing. Looking only at the amount raised or only at the increase in share price for the day would lead to erroneous conclusions.
Five-Dimensional Score: The Strongest and Weakest Appear Together on One Chart
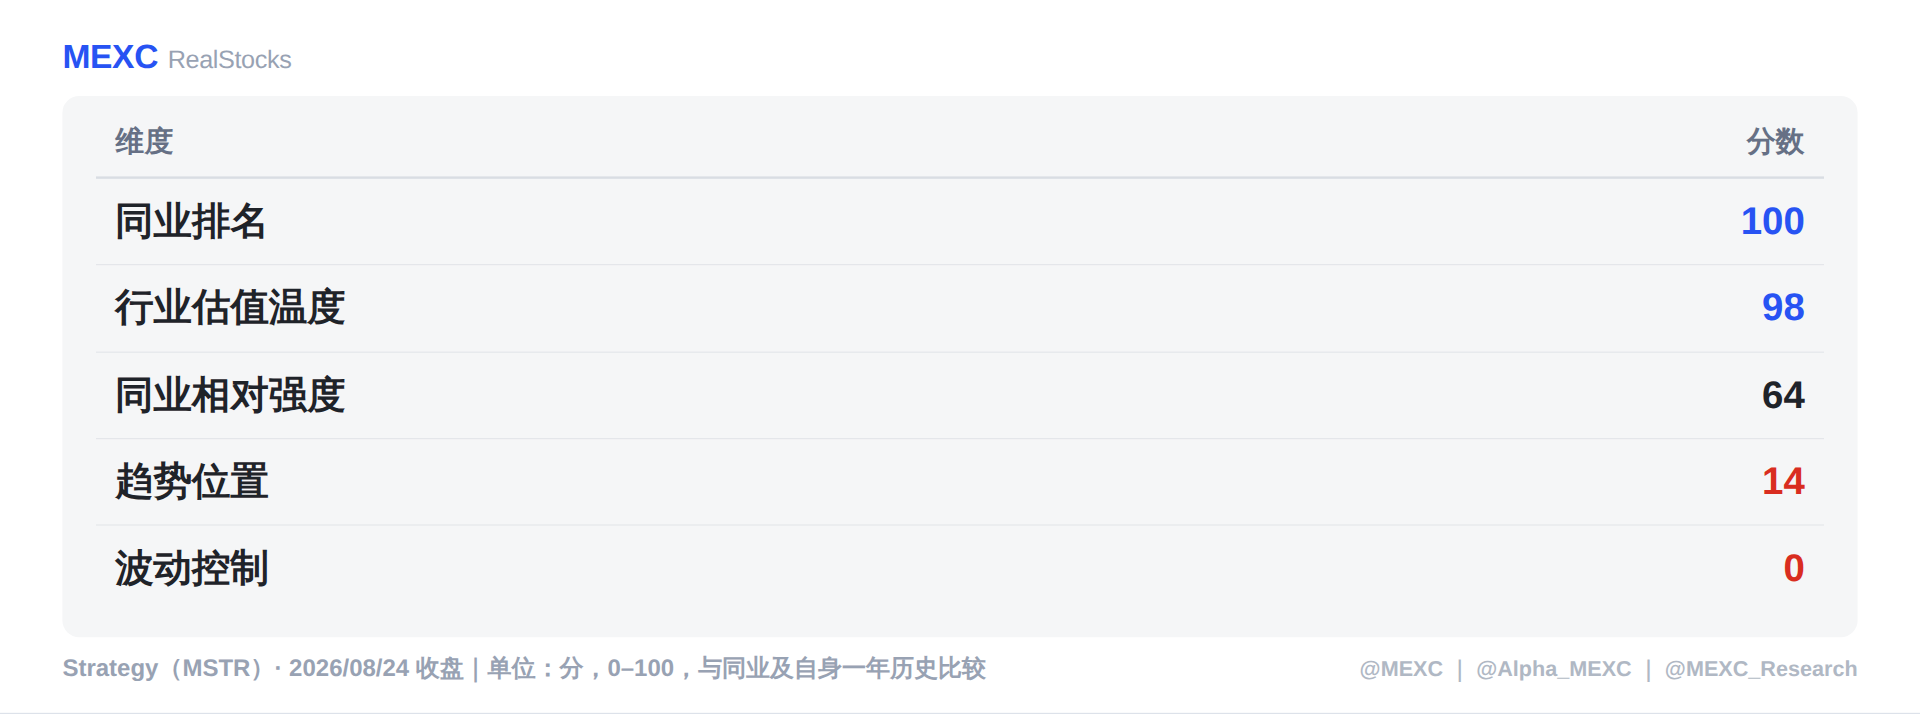
The shape of this scorecard itself is a conclusion: it scores full marks among peers, the industry's valuation temperature is 98, but its trend position is only 14, and volatility control is 0.
To put it simply—within its peer group, it is indeed the strongest, but its price remains at the 14th percentile of its one-year range, and its volatility has been greatly amplified (Beta 3.56).
Another detail worth mentioning: during the day it briefly reached 125.11 dollars, with an intraday increase of +4.9%, closing back down to +2.83%. Different media quote different point figures, so when seeing two different increases, first confirm whether they are quoting the intraday or the closing figure. Updates on holdings and cash will be available in the subsequent 8-K disclosure.
3. Today's Star: Bitcoin Prices Rise 22% in a Week, Only Two of Six Cryptocurrency Stocks Close in Green
The truly memorable comparison is here.
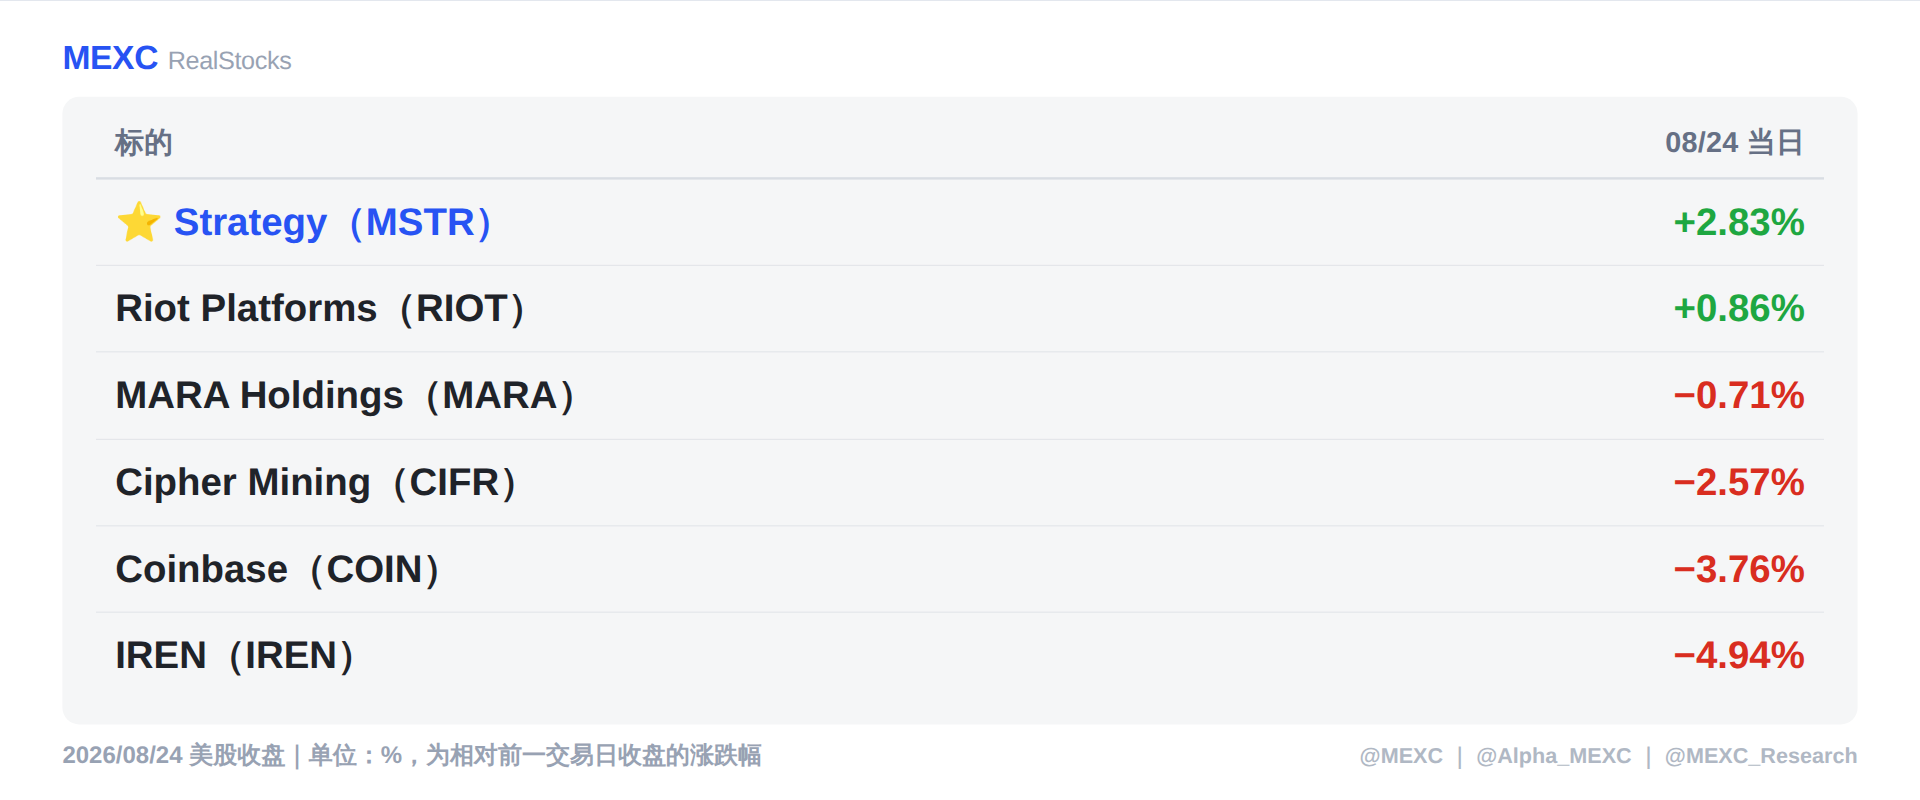
Bitcoin achieved its best single-week performance in nearly two years, with a weekly increase of 22%, while on the same day, of the six "cryptocurrency concept stocks," only two closed in the green, and four closed down, with a difference of nearly 8 percentage points between the best and worst performers. The Nasdaq financial capital market sector also averaged −1.53% on the same day.
This illustrates one thing: the price of Bitcoin and cryptocurrency stocks have never followed the same curve.
The same driving factors affect different balance sheets with varying transmission efficiencies—some companies hold Bitcoin directly, with price fluctuations fully reflected on their balance sheets; others rely on transaction fees, needing trading volume to generate income; some have mining operations and data centers, where the cost structure is burdened with substantial fixed assets and debt, so a rise in Bitcoin prices doesn't necessarily result in favorable profit and loss for that period.
Transferable Judgment: When observing a sector preset as "rising or falling together," first regroup the companies based on how their revenues are generated, rather than by label.
4. U.S. Stock Academy: Beta is Not a Risk Score, It's a Position Amplifier
The frequently mentioned Beta of 3.56 is the indicator we will elaborate on today.
Investing 100,000 dollars can result in a 100,000 dollar market exposure for some, while for others, it can equal 350,000— the difference is not in how much you invested, but in how many times the stock you bought amplifies the market's fluctuations.
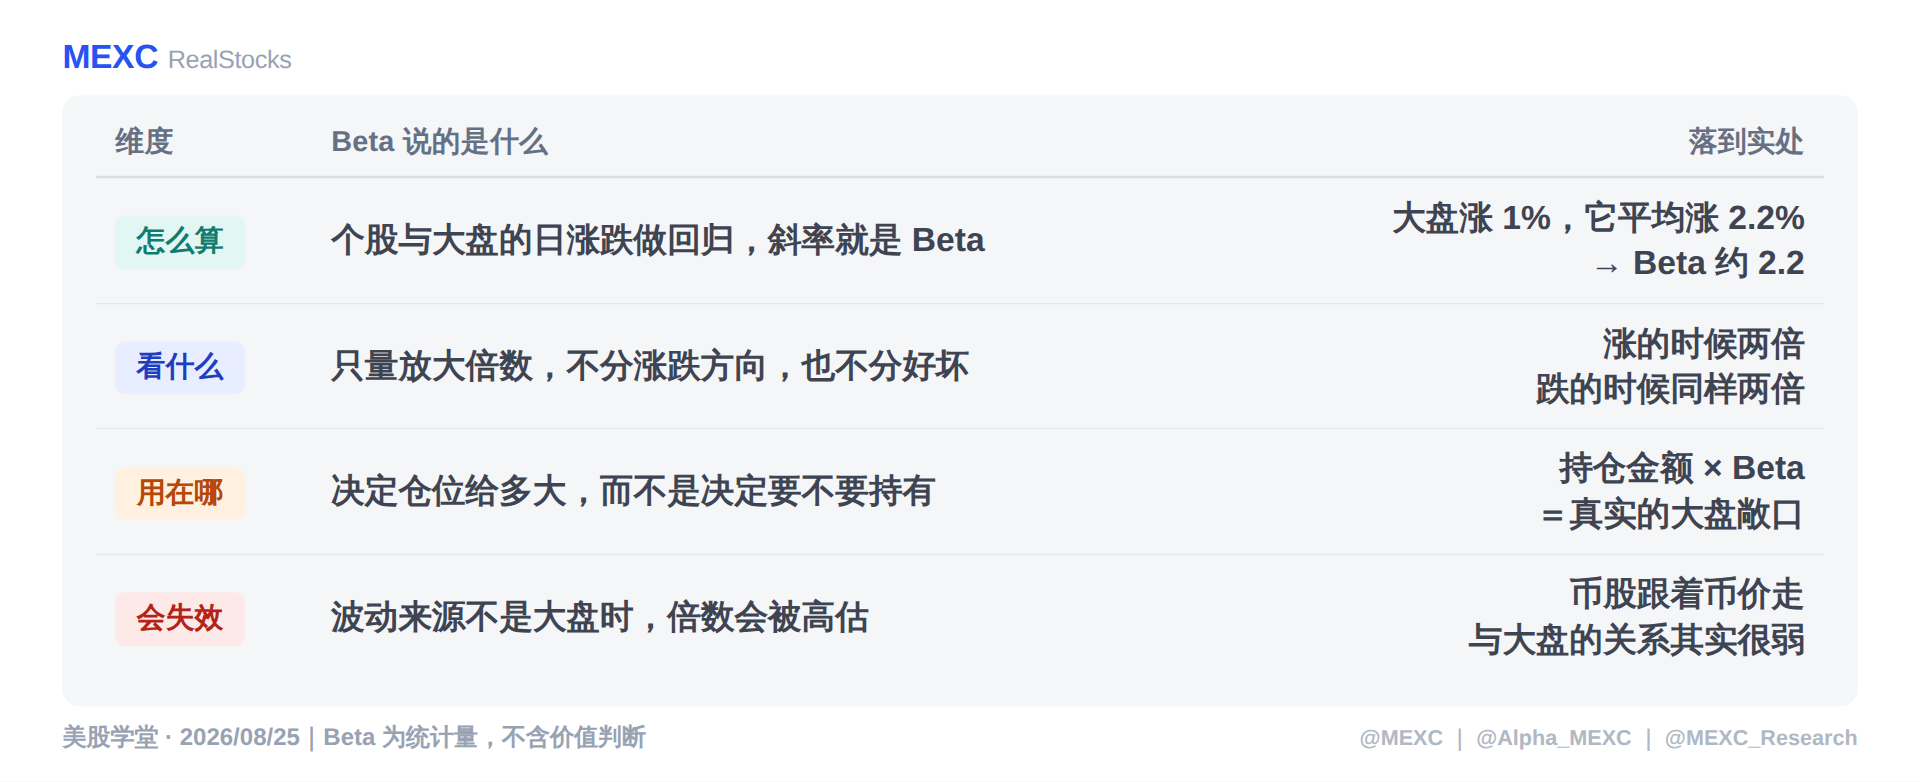
The true focus of this chart is in the last row.
Beta only answers "how much it moves," never answers "why it moves." Two stocks with a Beta of 3 may behave entirely differently—one follows interest rate expectations, while the other follows Bitcoin—same multiple, completely different attitudes.
Is a stock with Beta 3 three times more dangerous than the market?
Not necessarily. Beta only measures the part that "moves with the market." The residual term in regression is the company's own issue—earnings reports, regulation, loss of a single customer, which Beta does not account for at all.
The accurate interpretation is: A Beta of 3 means "for every 1% movement of the market, it moves an average of 3%." As for how much additional movement it has, that number is not stated at all.
To assess explanatory power, do not only look at the multiple. Low explanatory power (R²) in regression indicates the market does not explain its ups and downs at all, and in this case, a high Beta has been mismeasured—it actually measures "high volatility," not "sensitivity to the market." This is precisely the case for cryptocurrency stocks: their Beta is large, mostly because they themselves are volatile, not because they move in sync with the market.
Transferable Criterion: When obtaining any Beta, first ask two questions—what is the length of the sample interval, and has the company changed its business during this period. If there has been a change, the multiples calculated from old data describe a different company.
5. U.S. Stock Academy: Six U.S. Companies, Beta Differs by Over Ten Times
When laying out the numbers, the differences are larger than most people think.
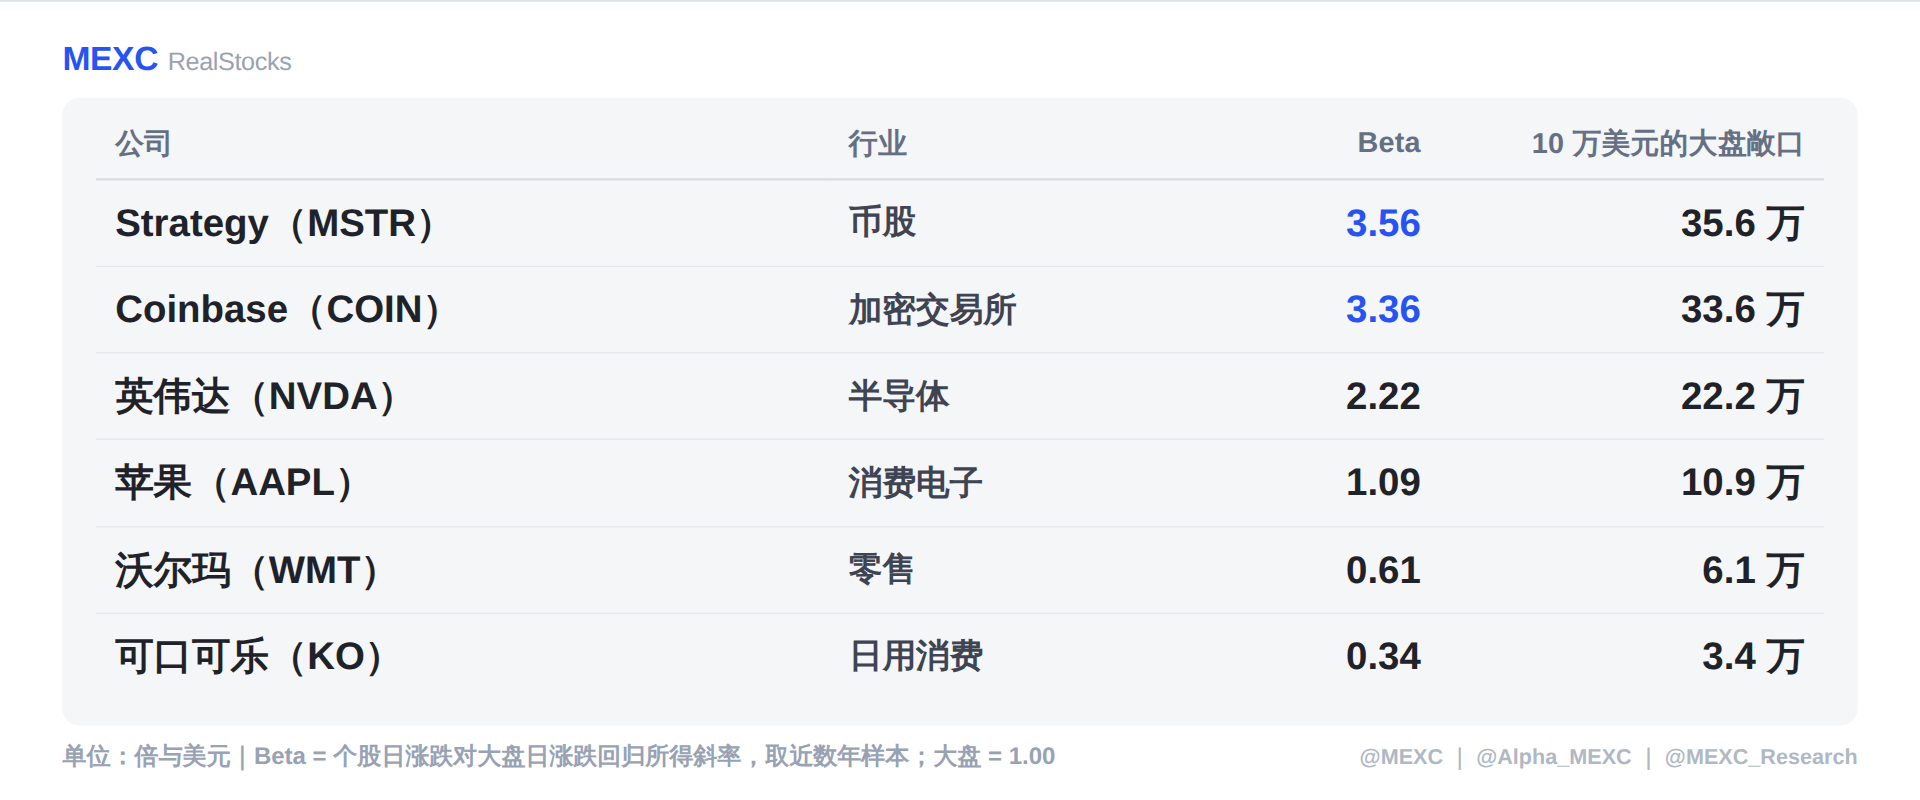
The Beta ranges from Coca-Cola's 0.34 to Strategy's 3.56, differing by over ten times, and all six are U.S. stocks.
With the same 100,000 dollar position, the former only equals 34,000 dollars of market exposure, while the latter equals 356,000. The amounts are the same, but the market volatility assumed is completely different.
Thus, there are two practical guidelines:
First, convert before deciding on the amount. Position amount × Beta gives the real market exposure. To achieve the same exposure in MSTR as in Apple, the amount can only be about one-third.
Second, a high Beta does not mean it follows the market. First, determine who sources the stock's volatility; misidentifying the source results in the multiple being mere statistical noise.
6. What to Watch Tonight: Consumer Confidence Index at 14:00 UTC, After-hours Look at SMTC
The August Consumer Confidence Index will be released at 14:00 UTC tonight (along with new home sales). This week's macro focus includes the core PCE price index at 12:30 UTC on Wednesday and the second quarter GDP revision; there will also be a speech at the Jackson Hole annual meeting on Friday—tonight's release is the only demand-side reading for the first half of this week.
After-hours earnings report: SMTC, Semtech Corporation, at 20:30 UTC, with options implied volatility ±21.07%.
It neither makes switches nor optical modules, but sells the signal chips inside the optical modules: the FiberEdge drivers and transimpedance amplifiers are responsible for pushing electrical signals onto fibers, while CopperEdge is an active equalizer chip that allows copper cables to transmit at higher speeds. Whichever company is shipping 800G and 1.6T optical modules, it will follow suit—therefore, it is treated as a precursor reading for AI network demand.
What to watch is not overall revenue, but the data center line
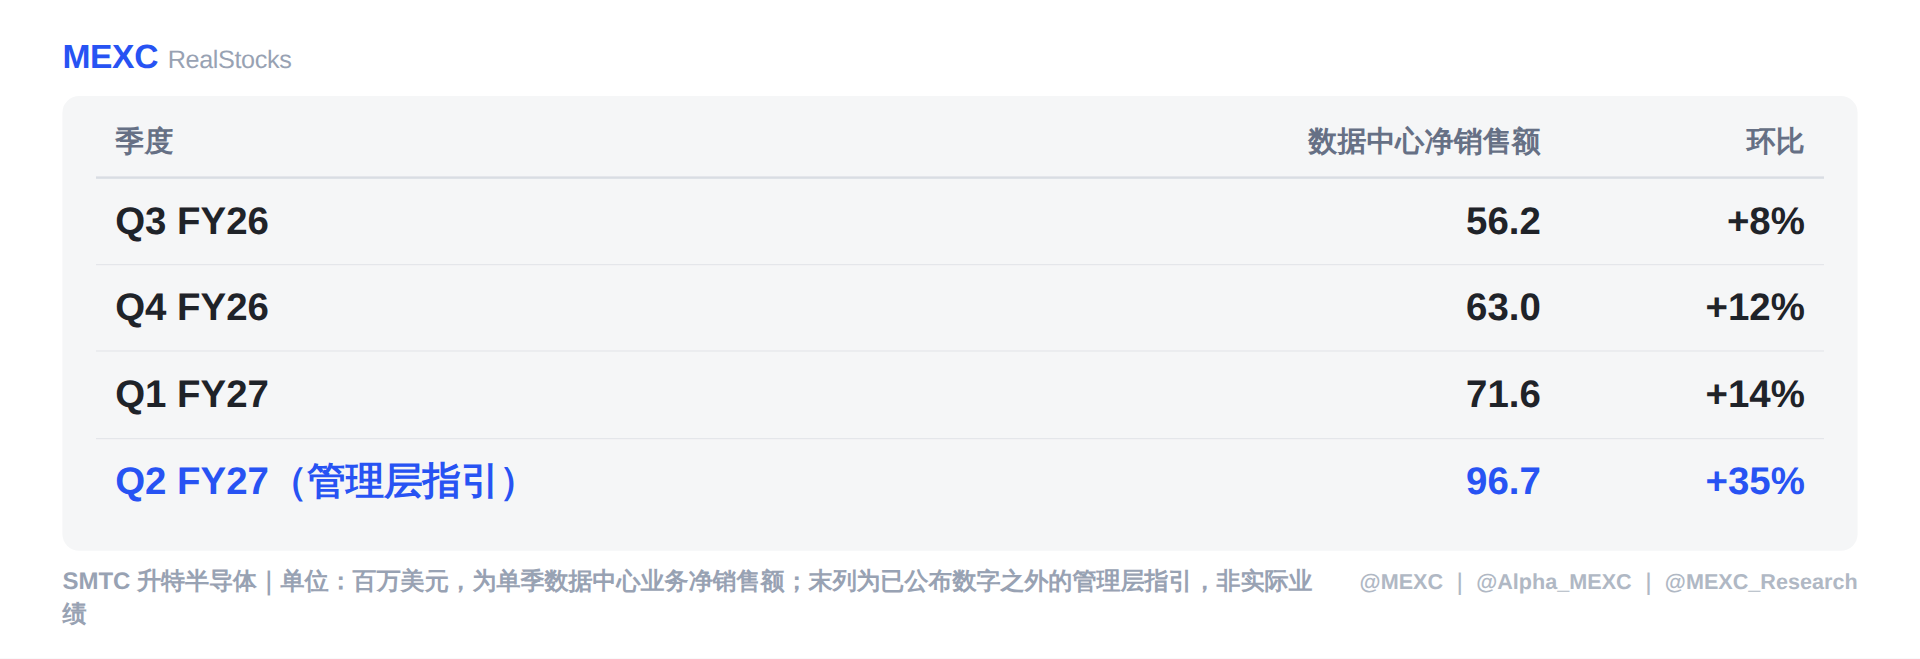
The reason for not looking at total revenue is simple: the total revenue from IoT and high-end consumption still accounts for a large portion and remains steady, which will average out the real changes. The true factor determining how the market assigns valuation is whether the data center line can continue to accelerate.
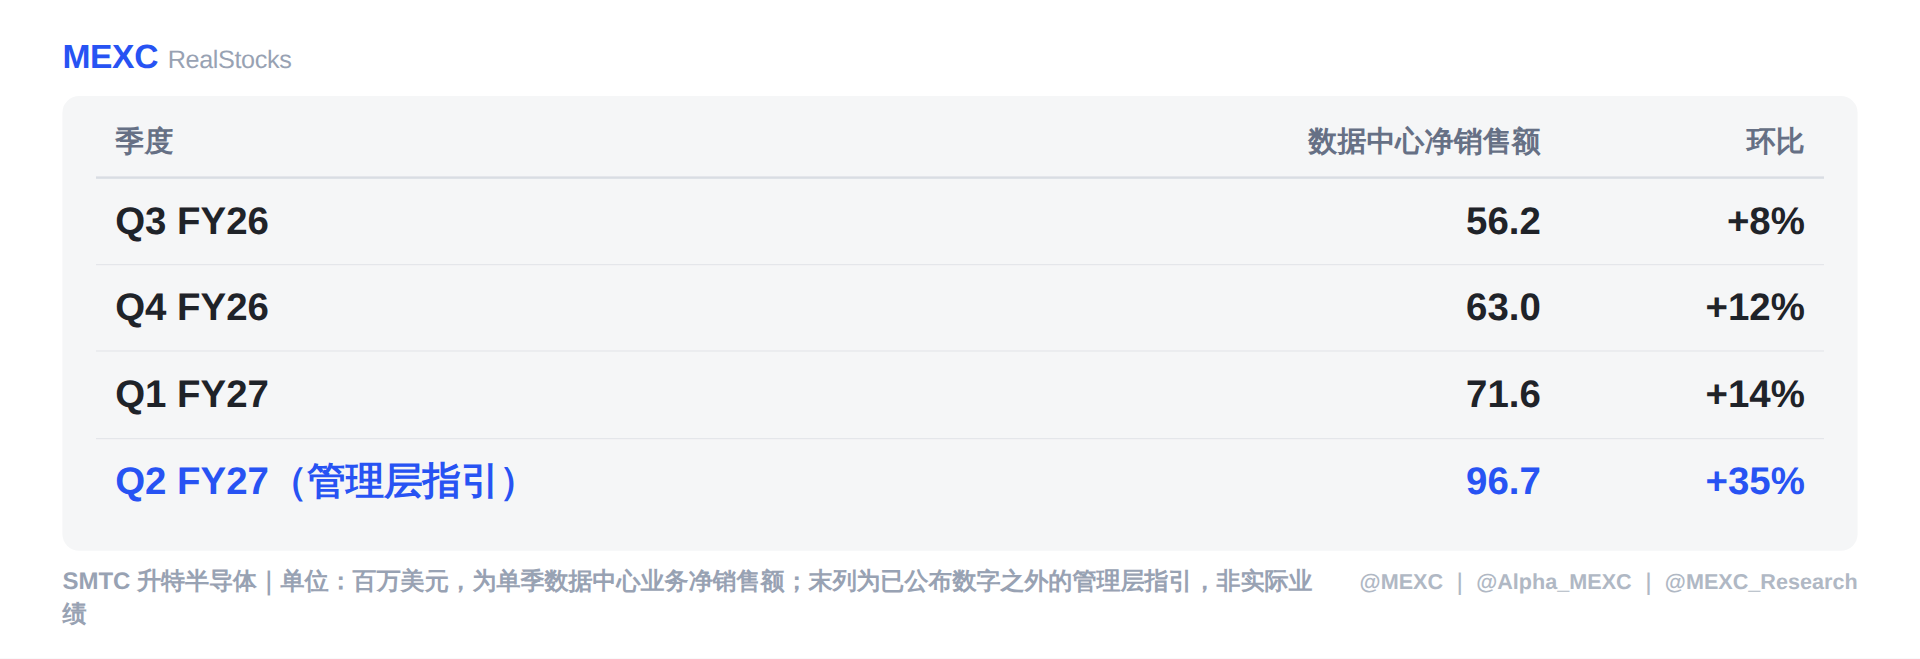
The three already released quarters have shown steady growth rates of +8% / +12% / +14% quarter-over-quarter, while the guidance provided for the second quarter jumps directly to a quarter-over-quarter +35%, year-over-year +85%, approximately equating to 97 million dollars. The previous quarter of 71.6 million dollars was already a record level, a 39% year-over-year increase.
Tonight's two observation points:
- Whether the net sales in the data center for the quarter reach approximately 97 million dollars, which is the fulfillment line for the +35% guidance. If fulfilled, it indicates acceleration; if slightly missed, it suggests delays in rhythm.
- How the conference call discusses the progress of client introductions for the CopperEdge active copper cable and the shipment rhythm of the 1.6T FiberEdge—these two will determine the slope for the second half of the year.
This Week's Divergence Ranking: The Smallest Market Cap Company Has the Deepest Divergence
SMTC's ±21.07% is the highest this week, more than three times higher than NVIDIA's ±6.17%. This is related to its over 30% decline since its peak in June—the smallest market cap company has the deepest market divergence.
It is important to emphasize that implied volatility derived from option prices measures the expected amplitude of a single day post-earnings announcement, focusing on amplitude, not direction. A larger number indicates deeper divergence, not necessarily greater likelihood of decline.
7. Frequently Asked Questions FAQ
Q1: Is it good or bad for existing shareholders when a company issues new shares to raise funds to buy Bitcoin?
The key is not how much was raised but whether the amount of Bitcoin per share is increasing or decreasing. The increase in the number of shares is dilution, but if the funds raised convert into more Bitcoins, the Bitcoin per share actually increases, which is beneficial to shareholders. Hence, when reading such announcements, it's essential to capture both numbers: how much has the number of shares increased, and how much has the number of Bitcoins increased. The announcement on 8/24 is a counterexample—2.01 billion dollars' worth of shares were issued, but the number of Bitcoins did not change.
Q2: Why did Bitcoin rise 22% in a week while most cryptocurrency stocks fell?
Because the transmission paths are different. Companies holding Bitcoin directly reflect price changes entirely on their balance sheets; those relying on transaction fees need trading volume to generate revenue; mining operations and data centers have cost structures burdened by significant fixed assets and debts, meaning a rise in Bitcoin prices does not guarantee favorable profit and loss for the period. On 8/24, only two out of six cryptocurrency stocks closed in the green, reflecting this difference.
Q3: How should Beta be used?
Beta is the multiple by which a stock amplifies its relative movement to the market, describing only the amplitude, not predicting direction. Two practical methods are: first, when observing daily price changes, divide by Beta to see if the fluctuation is atypical; second, use it to derive position—Position amount × Beta = real market exposure; to assume volatility comparable to the market, a target with Beta 3.56 would generally necessitate opening less than one-third of the position.
Q4: Is a stock with Beta 3 three times more dangerous than the market?
Not necessarily. Beta measures only the part of the stock that "moves with the market," while the residual in regression addresses the company's own issues—earnings reports, regulation, customer loss, which Beta does not account for. Additionally, examining the explanatory power of regression is critical; in low explanatory power scenarios, high Beta readings may actually represent "high volatility," not sensitivity to the market.
Q5: Why do different media report different price fluctuations for the same stock?
This is often due to referencing different points in time. On 8/24, MSTR reached 125.11 dollars at one point, with a +4.9% increase, then closed back down to +2.83%. When encountering two different numbers, first confirm whether they refer to the intraday peak or the closing price.
Q6: Can implied volatility from options be used to predict stock price movements?
No. Implied volatility derived from option prices measures the expected amplitude for a single day following earnings announcements, only discussing amplitude, not direction. Larger numbers reflect greater market divergence. SMTC's ±21.07% this week signifies the deepest divergence, not the greatest likelihood of a drop.
Q7: Why should we focus on a single business line for semiconductor companies rather than total revenue?
Because the total revenue of multi-business companies is a weighted average, which can obscure the line truly undergoing changes. For instance, in the case of SMTC, IoT and high-end consumption dominate and remain steady, making total revenue fail to reflect the climb of the data center from 56.2 million to 71.6 million, guiding toward 97 million's slope—while the market values the latter.
Disclaimer: This article is compiled and written by the MEXC U.S. Stock Spot Team (MEXC RealStocks). The data in this article is based on the closing of the U.S. stock market on August 24, 2026, with earnings and forward-looking data available before the market on August 25, 2026; content is organized from publicly available market information, and individual stocks are open to discussion, not representing any recommendation or opinion from MEXC, nor constituting any investment advice.
免责声明:本文章仅代表作者个人观点,不代表本平台的立场和观点。本文章仅供信息分享,不构成对任何人的任何投资建议。用户与作者之间的任何争议,与本平台无关。如网页中刊载的文章或图片涉及侵权,请提供相关的权利证明和身份证明发送邮件到support@aicoin.com,本平台相关工作人员将会进行核查。


