Crypto Circle Academician: On August 25, Ethereum (ETH) moving averages are in a fully bullish arrangement. Can Ethereum continue this round of upward trend? Latest market analysis reference
Ethereum's current price is 2500, those who missed the opportunity are afraid of chasing high and getting trapped, while those holding positions worry about a pullback that might directly return profits. After a significant rise, market sentiment becomes particularly restless; on one side, there is a strong bullish outburst, while on the other side, there is the risk of profit-taking at high levels fleeing at any moment. Many retail investors tend to blindly chase after a big rise, panic selling after a slight pullback, getting harvested repeatedly by the market. The hardest part of trading is not catching the explosive rises, but knowing how to stay calm when the market is euphoric, clearly seeing support and resistance, and strictly adhering to one’s trading plan.
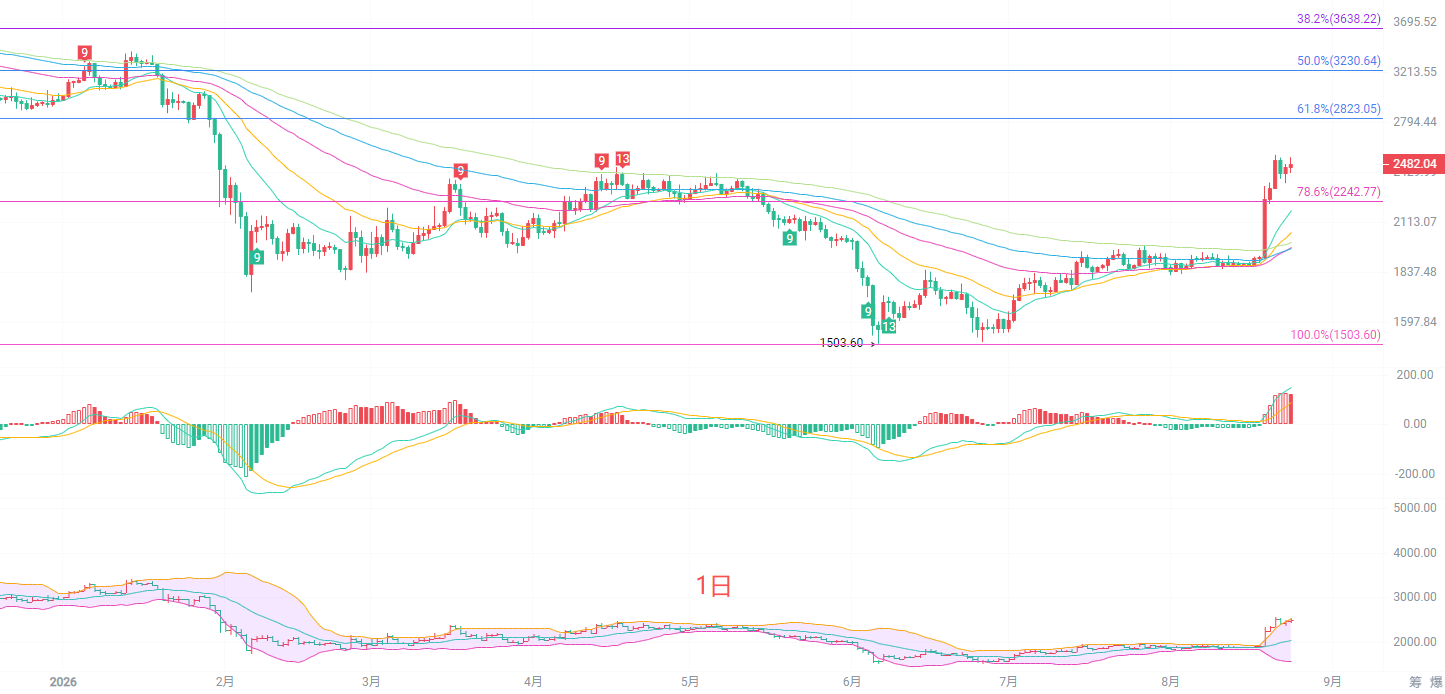
After experiencing a strong surge, the daily K-line has stood above all EMA moving average systems, and the moving averages are fully turning upward, indicating that a mid-term bullish pattern has opened up. The Bollinger Bands are opening upwards, and the price is running near the upper band, indicating a strong short-term range. The MACD indicator's red column continues to expand, with the DIF and DEA lines maintaining an upward trajectory, and bullish momentum is still being released. The first resistance above is around the previous high points of 2530 and 2540, while the key support below falls at 2242, the Fibonacci 78.6% level, which is also an important watershed for this round of upward movement. After a large bullish candle on the daily, a fluctuating K-line appears, indicating that selling pressure at high positions is starting to show, and the probability of continuing to violently attack upwards is decreasing, suggesting that it will likely enter a phase of high-level fluctuations to digest profit, making it inadvisable to blindly chase the rise.
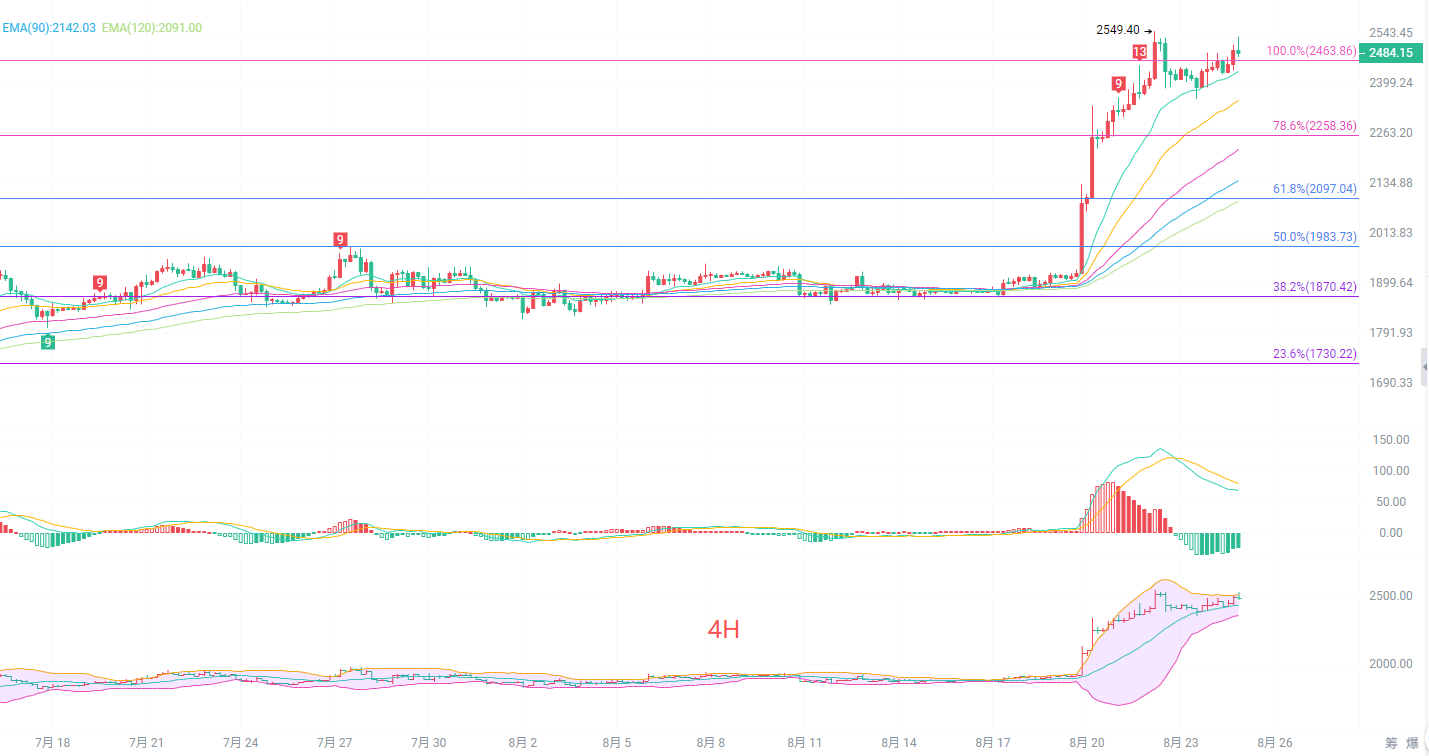
The four-hour K-line has retreated and stabilized above the short-term EMA15 moving average, with multiple moving averages still diverging upwards. The bullish trend is not damaged. The upper Bollinger Band has narrowed, with the price correcting from the upper band towards the middle band, which is a normal pullback after a significant rise. The MACD red column is gradually shortening, with signs of inflection appearing in the dual lines, indicating a reduction in short-term bullish momentum and a need for a pullback to repair. The Fibonacci 100% level at 2463 has become the nearest support; if it holds above this level, there will be another chance to challenge previous highs; if it effectively breaks down, testing support at 2258 will occur. The four-hour level has entered a phase of bullish and bearish game play, making the risks of chasing orders obvious; waiting for a pullback to confirm support would be more prudent.
Short term reference:
If below 2460 to 2420 does not break upwards, stop loss at 40 points, target looking at 2550 to 2600.
If above 2550 to 2600 does not break downwards, stop loss at 40 points, target looking at 2500 to 2450.
Specific operations should be based on real-time market data; for more detailed information, you can consult the author. The article may have delays in publication, and the advice is only for reference; risks are self-assumed.

Warm reminder: The above content is exclusively created by the author of the public account. The advertisements at the end of the article and in the comment section are not related to the author. Please discern carefully, thank you for reading.
免责声明:本文章仅代表作者个人观点,不代表本平台的立场和观点。本文章仅供信息分享,不构成对任何人的任何投资建议。用户与作者之间的任何争议,与本平台无关。如网页中刊载的文章或图片涉及侵权,请提供相关的权利证明和身份证明发送邮件到support@aicoin.com,本平台相关工作人员将会进行核查。