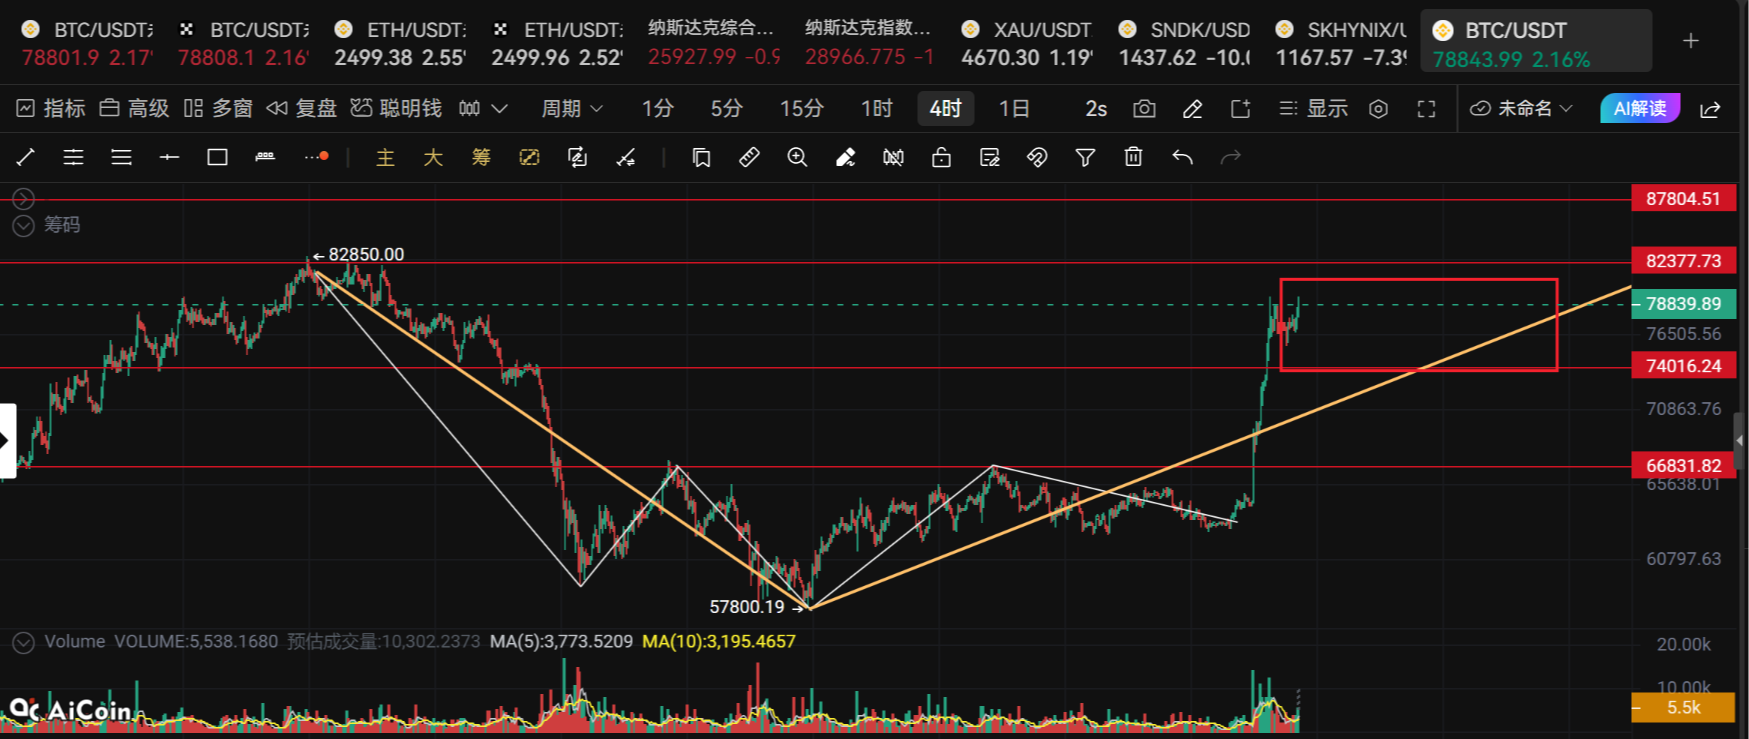
In the past two days, Bitcoin's fluctuations have noticeably increased, and the activity of capital inflows and outflows has also improved.
However, after consecutive rises, the market has already shown a clear change: the speed of the increase has begun to slow down, and the price has shifted from rapid ascent to high-level digestion.
Therefore, what really needs to be determined now is not whether this round of rises has ended, but whether this pullback is a normal correction or has started to damage the upward structure.
At present, I tend to favor the former.
1. Hourly Chart: Acceleration Up Ends, Enter High-Level Consolidation
Around August 19, Bitcoin was still oscillating near $63,000 to $64,000, and then the market quickly broke out upwards, rising to around $79,500.
But after the rally, the price did not continue to replicate the straight-line rise of the previous days, and today it has gradually weakened, mainly oscillating around $77,000.
The hourly chart has switched from trend acceleration to high-level digestion.
Short-term highs have begun to drift lower, but lows have not yet shown obvious downward movement, with the vicinity of $76,500 to $76,600 still not effectively broken.
Thus, this pullback cannot yet be defined as a trend reversal.
Short-term focus on $76,300.
If it can hold here, it still counts as a normal consolidation after an increase; if it breaks down, then further attention needs to be paid to $75,500. Daily sharing of real-time trading strategies, free provision of position diagnosis, liquidation ideas, and practical market insights, scan to follow public account《Bitcoin Watermelon》,Join the community for strategies!
2. 4-Hour Chart: Slowdown in Rapid Rise, But Structure Unbroken
From the 4-hour perspective, this round of the market started around $62,700 to $63,000, quickly rising after some fluctuations.
The current issue is very clear: the slope of the rise is too steep, and the rate of increase is too fast.
After hitting $79,500, the second upward attack did not continue to form a clear expansion, and then the price began to be pressured downwards.
However, the vicinity of $76,600 has still not been effectively broken.
So, the 4-hour chart is more suitable to define as:
Acceleration up ends, high-level consolidation begins, but the upward structure has not yet been damaged.
Short-term can be slightly weak, but it cannot be treated as a trend reversal directly.
3. Daily and Weekly Charts: Larger Cycles Still Leaning Strong
The daily chart started from around $57,000 in early July, experienced a long period of fluctuation and pullback, but has never effectively broken below around $62,000.
Subsequently, the market broke through and rose quickly, now showing multiple consecutive bullish candles, reaching a peak near $79,500.
After consecutive rises, a pullback is not surprising.
Now the most important thing is to see if this pullback has damaged the daily chart structure.
So far, it has not.
Short-term focus on the vicinity of $76,000.
As long as it does not effectively break below here, it can still be seen as a normal repair after the increase.
The weekly chart continues to maintain a rebound background.
What needs to be truly focused on now is not whether it can continue to rise, but whether this round of repair can stabilize at high levels and leave space for further upward movement. Daily sharing of real-time trading strategies, free provision of position diagnosis, liquidation ideas, and practical market insights, scan to follow public account《Bitcoin Watermelon》,Join the community for strategies!
4. Why Must We Guard Against a Pullback Now?
The core reason is just two words:
Divergence.
The current price has significantly deviated from the daily moving average, and the slope of this round of increase is also very steep.
Normal increases are often characterized by oscillation, breakthrough, retest, and then breakthrough, representing a stepwise rise.
However, this round is clearly more direct.
This kind of trend can certainly continue to rise, but the divergence ratio accumulated in the short term is already quite high, thus a clear pullback is a normal demand.
The problem is, we cannot accurately predict when this pullback will occur.
So there is no need to guess the top; just observe whether the structure has truly been damaged.
5. Capital Behavior: More Like Deleveraging, Not Bear-Dominated
After noon today, the price experienced a rapid pullback, while the holdings significantly decreased.
This combination of “price falling + holdings decreasing” tends to indicate that the previous positions have been cleared, which is a concentrated deleveraging.
In the latter half, holdings have risen again, but the price has not continued to break down.
This indicates that new positions have begun to re-enter the market, and there hasn’t been a sustained selling pressure dominating the market yet.
So the current capital behavior is more inclined to:
First deleverage, then rebuild positions.
Of course, if the price breaks below $76,300 or even $75,500, while holdings continuously increase, then it would be necessary to be vigilant about bears entering actively. Daily sharing of real-time trading strategies, free provision of position diagnosis, liquidation ideas, and practical market insights, scan to follow public account《Bitcoin Watermelon》,Join the community for strategies!
6. Moving Averages, Bollinger Bands, and EMA: Short-Term Cooling, Large Cycles Not Turned Bearish
Currently, the 5-day moving average is still upward, and the overall daily moving average system maintains a bullish structure.
Thus, the current pullback mainly affects the speed of rise, and has not changed the direction of large cycle repair.
Bollinger Bands are similar.
The hourly chart has entered oscillation, and the midline near $77,600 has become an important reference for the short term.
The 4-hour Bollinger Bands previously showed clear expansion, and now they are gradually contracting, indicating that high volatility is being released.
However, the daily Bollinger Bands remain in an expansion state.
So, this is not a large-scale low-volatility consolidation, but rather:
A short-term consolidation in the daily expansion trend.
7. MACD, DMI, RSI: Short-Term Weakening, but Trend Still Exists
In terms of MACD, the hourly chart has formed a death cross, and the 4-hour chart has just formed a death cross.
However, the 4-hour death cross is far from the zero line, making its current reference significance limited.
The daily MACD remains in a releasing stage, indicating that the recent rise has transmitted to larger cycles.
DMI is also quite clear:
The hourly chart bears have a slight advantage, but the trend strength is not high; the 4-hour and daily charts still maintain a bullish advantage.
RSI is in a high-level pullback state.
Especially in the hourly chart, the price pullback is not large, but the RSI has begun to recover, resembling a cooling off of upward momentum rather than a complete trend reversal.
So, the current indicator combination can be summarized as:
Small cycle cooling, larger cycles still strong.Daily sharing of real-time trading strategies, free provision of position diagnosis, liquidation ideas, and practical market insights, scan to follow public account《Bitcoin Watermelon》,Join the community for strategies!
8. Key Positions: $76,300 is a Short-Term Watershed, $73,200 is a Larger Level Defense Line
From the 4-hour Fibonacci perspective:
First, focus on $78,100 above, and further on $78,800.
Below, first focus on $76,300, and if it breaks, look at $75,500.
From the daily structure perspective, the importance of $73,200 is even higher.
Thus, these positions cannot be confused:
$76,300: Short-term structural watershed.
$75,500: Next layer of support.
$73,200: Larger level structural defense line.
If it breaks below $76,300, the short-term bullish judgment needs to be temporarily eased.
However, only when $73,200 is also effectively broken should the upward structure of this round be reassessed.
9. How to See Next?
Considering the hourly, 4-hour, daily, and weekly charts:
Hourly cooling, 4-hour consolidation, daily and weekly charts remain strong.
Therefore, the current core judgment is still:
Oscillating slightly bullish, focus slightly upwards.
But the "slightly bullish" here is no longer the accelerated rise from a few days ago, but rather the high-level digestion phase after consecutive strong rises.
Short-term, first see if $78,000 can reclaim.
If it can reclaim above $78,000, and the holdings simultaneously increase, then continue to focus on $78,800 and $82,800.
If it continues to weaken, then closely observe $77,000 and $76,300.
If it breaks below $76,300, the short-term needs to become cautious.
But as long as $73,200 is not effectively broken, it cannot be simply defined as this round of rises failing.
Thus, what is most important now is not to chase higher, but to wait for the high-level consolidation to complete.
A pullback itself is not frightening; what needs to be truly watched out for is the destruction of the structure.
Currently, the structure remains intact.
High-level digestion, oscillating slightly bullish, focus slightly upwards.
Daily sharing of real-time trading strategies, free provision of position diagnosis, liquidation ideas, and practical market insights, scan to follow public account《Bitcoin Watermelon》,Join the community for strategies!

免责声明:本文章仅代表作者个人观点,不代表本平台的立场和观点。本文章仅供信息分享,不构成对任何人的任何投资建议。用户与作者之间的任何争议,与本平台无关。如网页中刊载的文章或图片涉及侵权,请提供相关的权利证明和身份证明发送邮件到support@aicoin.com,本平台相关工作人员将会进行核查。