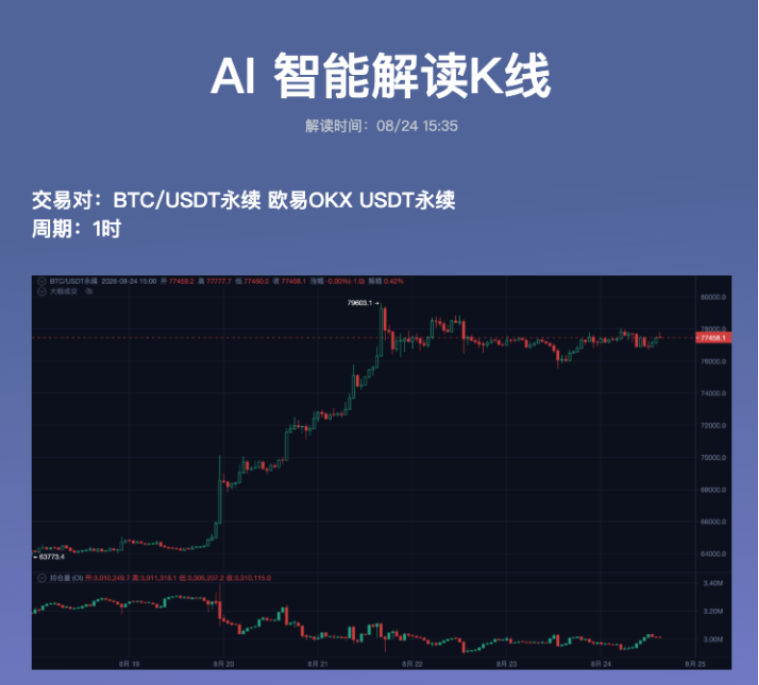
Recently, BTC has finally brought excitement back to the market.
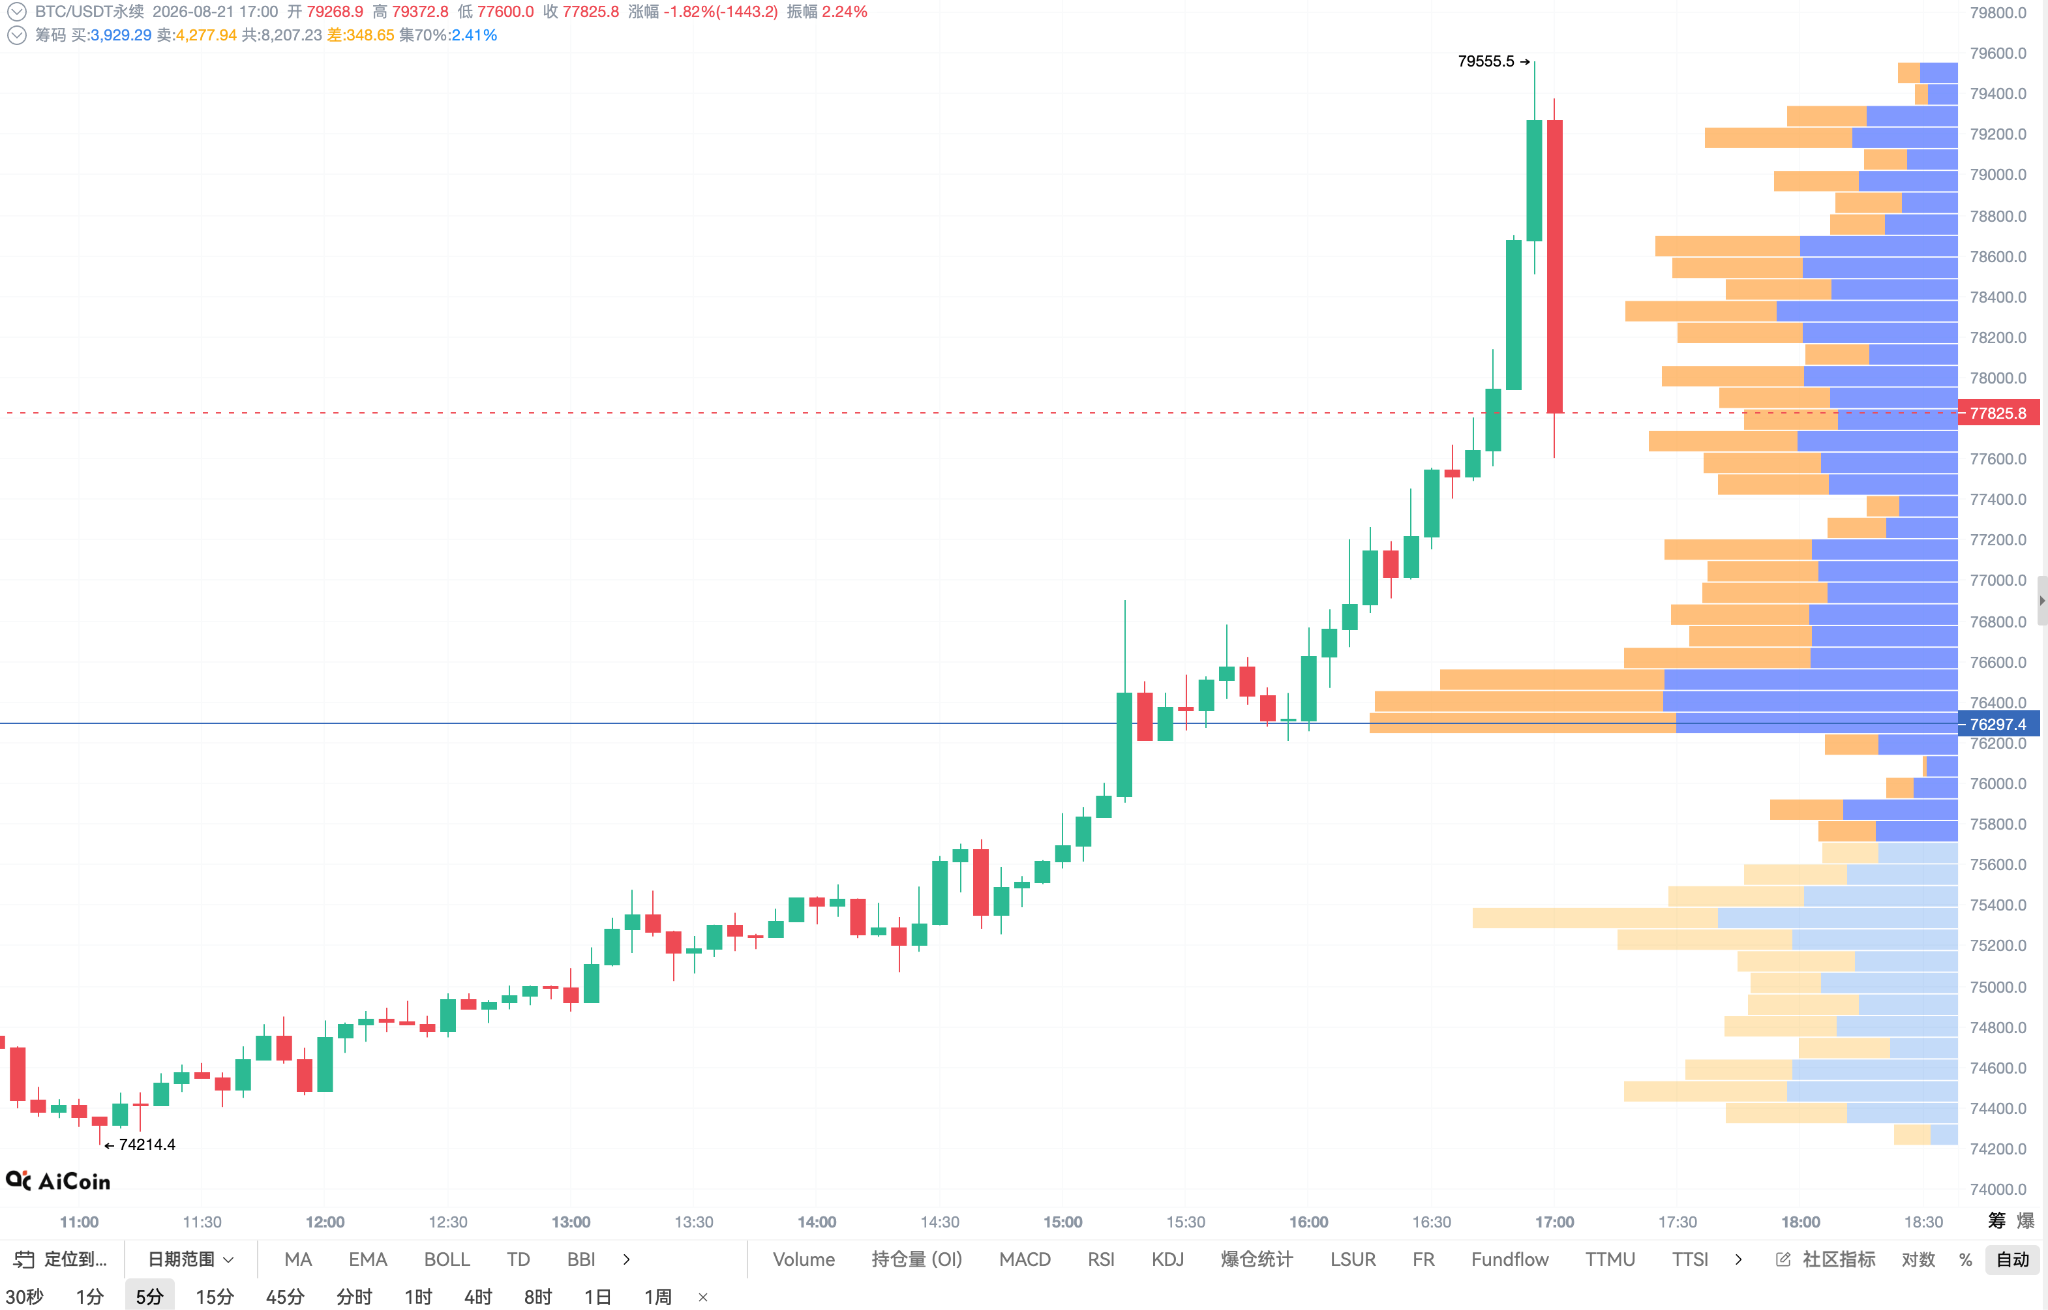
On August 21, BTC briefly soared to 79,000 USD, with a peak close to 79,500 USD. The rapid rise in a short period has led the market to start discussing again:
Can this round of the market continue?
However, for newcomers, the real difficulty is not in determining whether it is "bullish or not."
Instead, when opening the candlestick chart, they do not know what to look at.
Seeing a series of rising red candlesticks, they only feel:
"It's rising so fiercely."
Upon seeing a sudden pullback, they start to worry:
"Is it going to drop?"
In the end, they end up chasing the rise and killing the drop, completely led by emotions.
In fact, to judge a market trend, there’s no need to learn dozens of indicators at the outset.
Learning to understand 3 signals in candlesticks can already resolve many issues.
01 Trend: Is the price really rising, or is it just a rebound?
This is the most basic step in reading candlesticks.
For example, if BTC rebounds from over 60,000 USD to more than 70,000 USD, just looking at a single candlestick can easily lead one to feel:
"It has risen so much, it will definitely continue to rise."
But what really needs to be observed is:
Are the highs getting higher?
Are the lows getting higher?
If highs and lows are continuously elevated, it indicates that a rising structure is forming.
On the contrary, if the price spikes and then repeatedly breaks previous key lows, that so-called "rise" might just be a rebound.
Therefore:
Don't just look at how much it has risen today; observe the entire price structure.
02 Breakthrough: Does making a new high mean it can continue to rise?
This is a pit that beginners can easily fall into.
When BTC suddenly breaks through previous highs, market sentiment often heats up instantly.
But what really deserves attention is:
After the breakthrough, can the price hold steady?
If the price continues to rise with increased volume after breaking through, it indicates that the market's acceptance of higher prices is increasing.
But if it quickly spikes and then drops back to the original range, that breakthrough needs to be observed with caution.
This is also why candlesticks cannot just be judged by whether they are "red or not."
The position of the breakthrough and its subsequent behavior are equally important.
03 Support and Resistance: Where should one be cautious when the price rises, and where is it worth watching when it falls?
After a rapid rise in BTC, many people's first question is:
"Can I still chase it now?"
Actually, it can be reframed as:
"Where is the resistance above?"
If the price pulls back, then continue to ask:
"Where is the support below?"
These two positions can help clarify the vague "feelings" into specific observation points.
For example:
BTC rises → Approaches previous highs → Encounters resistance → Pullback
Next, you need to observe:
Can it hold the critical support after the pullback?
If it holds, the trend may continue.
If it breaks down, it means the market structure may change.
This is much more useful than simply staring at "how many points BTC has risen."
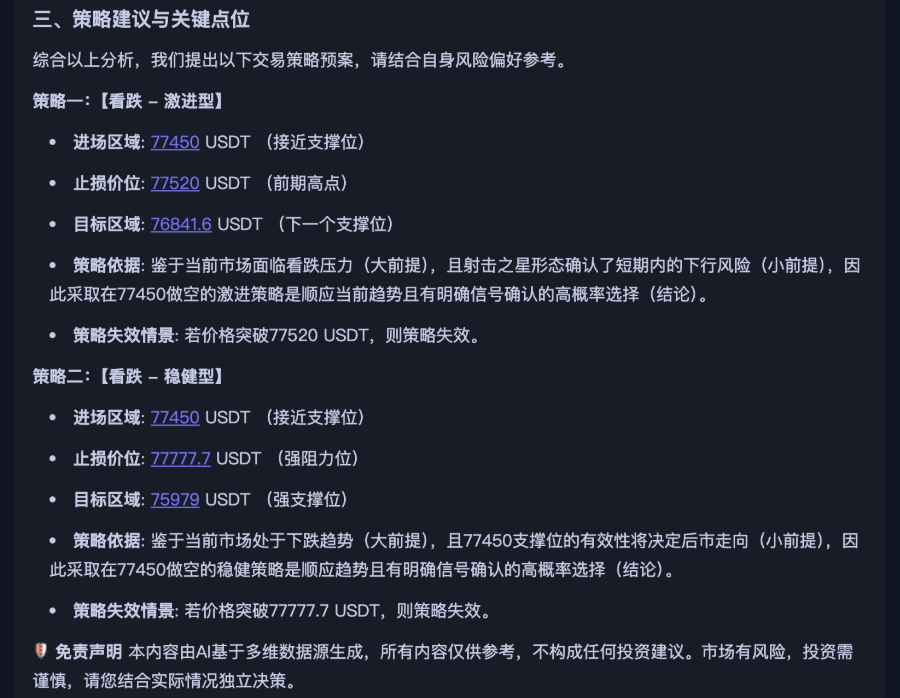
But here's the problem: What if beginners don't know how to read these?
This is actually where AI interpretation of candlesticks can play the most effective role.
If you are not familiar with indicators like MA, MACD, or RSI, there's no need to learn all technical analysis knowledge right from the start.
You can first hand over the candlestick analysis to AI.
For instance, in AiCoin, through AI intelligent interpretation, analysis of current candlesticks and market trends can be performed, organizing the originally complex technical information into more easily understandable content.
You can understand it as:
Let AI tell you "what to look for in this candlestick" first, then gradually learn to judge for yourself.
For example, when seeing BTC quickly rise, do not just ask:
"Can it still rise?"
But instead look further:
How is the current trend?
Is the breakthrough valid?
Where is the pressure above?
Where is the support below?
At this point, candlesticks are no longer just a bunch of red and green bars.
They start to transform into a comprehensible market language.
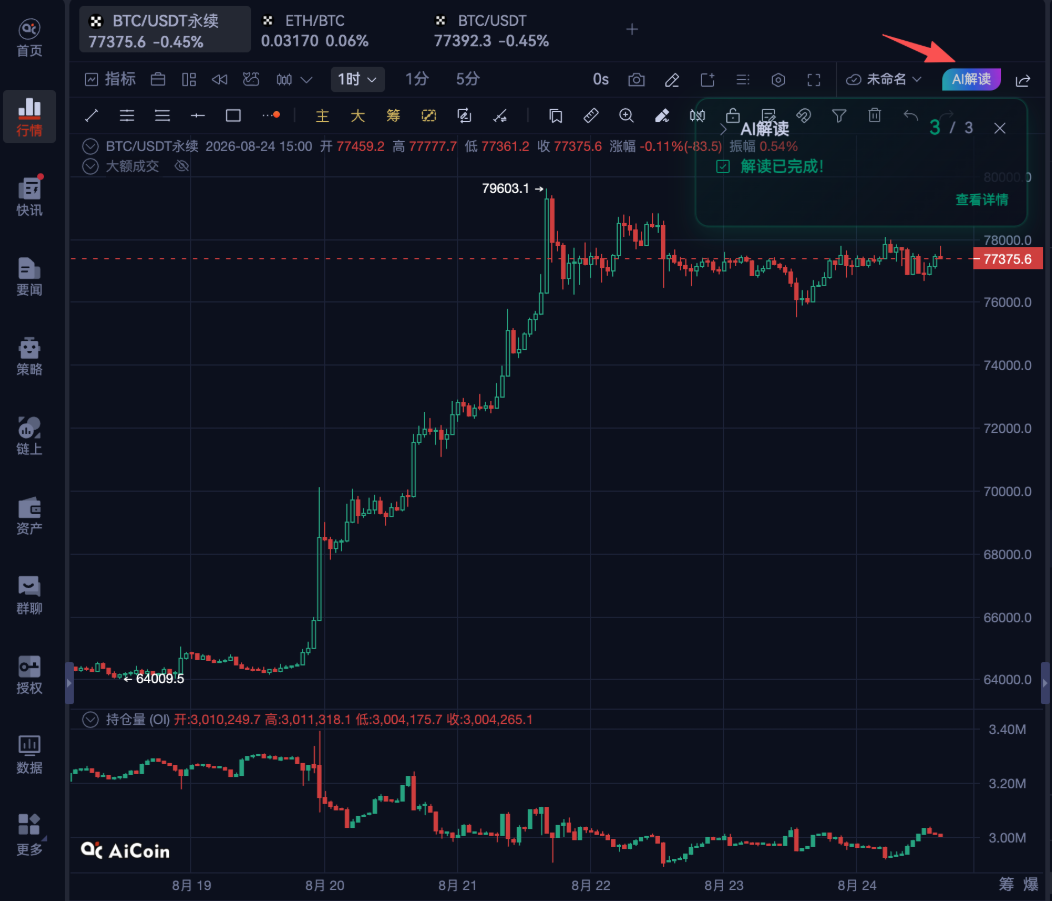
The real usefulness of AI is not to predict for you
Many people, upon hearing about AI analysis of candlesticks for the first time, might think:
“Can AI directly tell me to buy or sell?”
In fact, for ordinary investors, this is not the most important thing.
The market always carries uncertainty.
The more practical role of AI is to help deconstruct a complex candlestick chart:
Trend → Breakthrough → Support → Resistance → Then Judge
You do not need to give up reading candlesticks entirely just because you don’t know technical analysis.
Nor do you need to rush to chase after BTC suddenly surges.
First understand the market, then decide how you view it.
This may represent the greatest value of AI candlestick interpretation for beginners.
After all, true initiation is not about learning to predict the next candlestick.
But one day, when you open the candlestick chart, you finally know:
What you should be looking for.
The content above is for reference only regarding market information and tool usage, and does not constitute investment advice.
免责声明:本文章仅代表作者个人观点,不代表本平台的立场和观点。本文章仅供信息分享,不构成对任何人的任何投资建议。用户与作者之间的任何争议,与本平台无关。如网页中刊载的文章或图片涉及侵权,请提供相关的权利证明和身份证明发送邮件到support@aicoin.com,本平台相关工作人员将会进行核查。