This week, the cryptocurrency market once again staged a thrilling scene, with Bitcoin surging 26.72% in a single week under the macroeconomic boost, reaching a high of $79,515, strongly approaching the psychological barrier of $80,000. Meanwhile, HYPE made an impressive debut, breaking its historical high with the help of significant positive news, peaking at $83.38. Market sentiment also saw a dramatic reversal—previously prevalent pessimism quickly dissipated, and more investors shifted from a wait-and-see approach to actively buying.
Looking back at last week's analysis, we clearly stated in the article that "the probability of a daily continuous upward wave c is quite high." Now the market trend aligns closely with our predictions, with Bitcoin completing a strong rally as expected; for HYPE, we similarly captured the signal of a "daily level rebound since the low on August 2" in advance during the low region and have continued to track it since then, as real-world performance has once again validated our analytical logic. In fact, since February 23 when we first covered HYPE, we have maintained weekly updates for 27 consecutive periods, during which the maximum increase reached 225.7%. This is not only a coincidence in judgment but also a strong proof of the long-term effectiveness of a systematic analytical framework.
At this point, while market sentiment has obviously warmed up, strong upticks are often accompanied by struggles and intensified fluctuations at critical resistance levels. This week, we will continue to systematically sort out the future evolutionary paths of BTC and HYPE based on multi-cycle wave structures, quantitative model signals, and key support/resistance levels, providing specific medium- and short-term operational plans to help everyone grasp more certain trading opportunities amidst the market volatility.
Summary of core viewpoints for this week's trading:
• BTC multi-cycle trend structure analysis (detailed in the first part)
• BTC trading outlook and medium/short-term operational strategies (detailed in the second part)
• HYPE daily level trend structure analysis (detailed in the third part)
• HYPE trading outlook and short-term operational strategies (detailed in the fourth part)
Validation of last week's trading strategies and core viewpoints by the market:
• BTC market analysis validated by market—last week's article emphasized: the probability of daily continuous upward wave c is quite high. Current market performance aligns with our predictions.
• HYPE market analysis validated by market—reviewing last week's article: The probability of a daily level rebound since the low on August 2 is significant. Current real-world performance is highly consistent with our analytical viewpoints.
1. Bitcoin Multi-Cycle Trend Structure Analysis
Last week, Bitcoin surged significantly under macroeconomic boosts, with a weekly maximum increase of 26.72%, reaching as high as $79,515, and is now nearing the psychological barrier of $80,000. With the strong price rally, market sentiment has significantly reversed, many investors have shifted their judgments on the medium-term trend from excessive pessimism to actively buying. The following will systematically sort out the current market situation from the perspectives of weekly trend structure, daily wave pattern breakdown combined with key resistance levels, clarifying the current phase of the market and future evolutionary paths, providing a reference for investment decisions.
1. Bitcoin Weekly Trend Structure Analysis: (Based on market analysis since October 6, 2025)
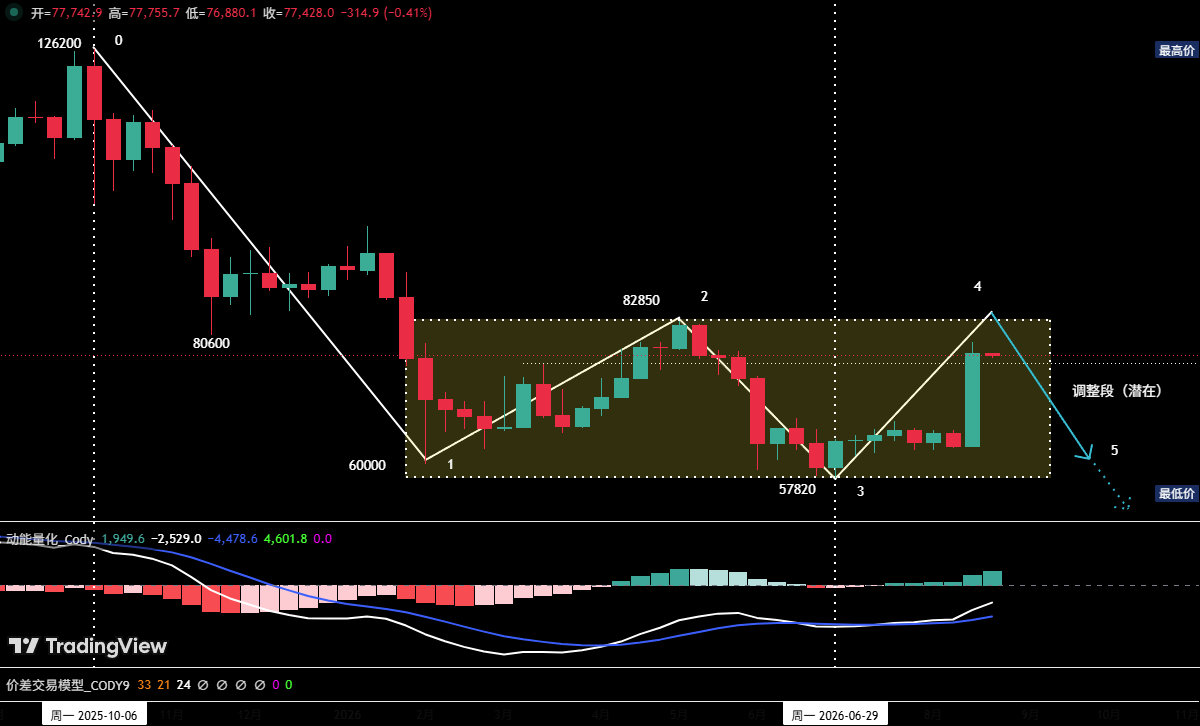
Figure 1 Bitcoin Weekly K-line Chart
① The weekly structure shows that since the high point of $126,200 on October 6, 2025, the medium-term adjustment trend has presented a four-stage adjustment structure of (0-1), (1-2), (2-3), (3-4), and is currently running the (3-4) rebound segment.
② Since breaking below $82,850 on January 31, overall, the price has been trapped in a wide box oscillation pattern between $57,820 and $82,850. The weekly chart shows that the current rebound has once again approached the upper boundary of the box at $82,850, which constitutes a short-term bull-bear dividing line.
③ Whether this (3-4) rebound segment can effectively break through the lower boundary of the box will determine the core variable of the medium-term trend. Based on technical shape deduction, the subsequent trend may present the following three paths:
Path One: Breakthrough Upper Boundary, Open Upward Space
The rebound segment (3-4) continues to rise, and the price effectively stabilizes in the strong resistance area of $80,600–$82,850, breaking through the upper boundary of the box to start a new round of rise, targeting the $90,000 round number.
Path Two: Pressure at Upper Boundary Rebounds, Maintaining Box Oscillation
The rebound shows stagnation signals near the upper boundary of the box, technical indicators emit top signals, and the rebound segment (3-4) ends near the upper boundary. The price falls back to seek support around the middle or lower boundary of the box, indicating a potential downward adjustment segment (4-5); after the (4-5) segment ends inside or near the lower boundary of the box, the price will again attempt to strike at the upper boundary of the box.
Path Three: Encounter Resistance at Upper Boundary, Continuing Downward Trend
The rebound segment (3-4) ends near the upper boundary of the box, the price continuously falls and effectively breaks through the lower boundary support at $57,820, indicating a potential downward adjustment segment (4-5). This segment, after breaking the box's lower boundary support, continues to descend, seeking lower-point support, thus allowing the downward trend to persist.
④ Based on the self-constructed quantitative model analysis, after a short-term strong rally, overbought signs are evident. Additionally, being pressed by the strong resistance area of $80,600–$82,850, the current (3-4) rebound segment is highly likely to end near the box's upper boundary. Combining the three evolutionary paths mentioned above, Path Two has the highest probability.
2. Bitcoin Daily Trend Structure Analysis:
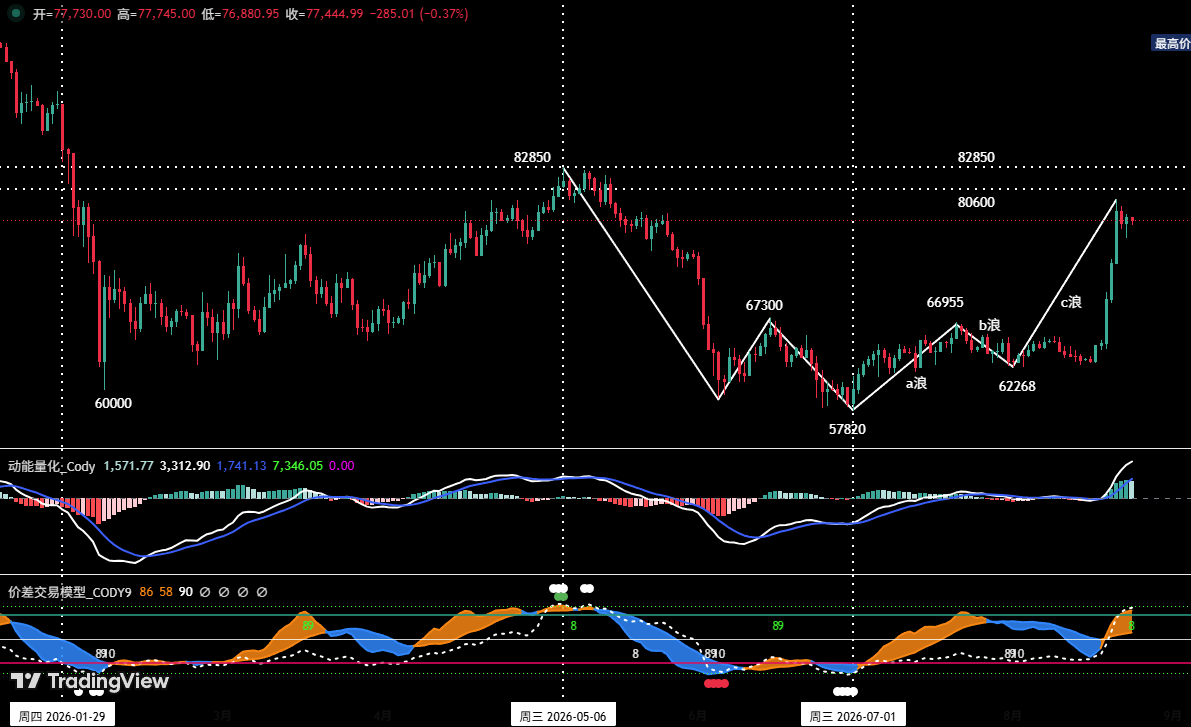
Figure 2 Bitcoin Daily K-line Chart
Daily wave structure analysis: The rebound trend starting from the low of $57,820 on July 1 corresponds to the weekly level (3-4) rebound segment. Below, we will break down this segment of the trend in the daily framework, clarifying the current stage of the rebound through wave-type divisions and providing technical support for short-term trend judgments.
1. Wave a (Rebound Wave): July 1 to July 21
▪ Starting Point: $57,820, Endpoint: $66,955
▪ Running Period: 21 trading days
▪ Maximum Increase in Interval: 15.8%.
2. Wave b (Adjustment Wave): July 21 to August 1
▪ Pullback Interval: $66,955→$62,268
▪ Adjustment Period: 11 trading days
▪ Technical Feature: The pullback precisely tested the 50% Fibonacci level of wave a's increase.
3. Wave c (Rebound Wave): August 1 to present
▪ Starting Point: $62,268
▪ Currently running for 22 trading days (ongoing).
▪ The maximum increase in the current interval is 27.8%, close to 1.9 times the increase of wave a.
4. The weekly (3-4) rebound segment corresponds to a high probability of daily wave 5 rebound
From the perspective of technical shape and volume coordination: as of now, the high point of wave c has reached around $79,571 (achieving 1.9 times the extension target of wave a), and the trading volume has increased over several consecutive days. This significant change enhances the probability of wave c becoming the main upward wave. If wave c ends, it is highly likely that a subsequent adjustment through wave d will occur, followed by an upward rise of wave e that breaks through the high point of wave c.
2. Bitcoin Trading Outlook and Operational Strategy for This Week
1. BTC Trading Trend Outlook for This Week:
This week's core viewpoint: Closely monitor the end point of the daily wave e rebound and the potential effective support for wave d adjustment.
2. Core Resistance Levels:
• First resistance area: $80,600–$82,850 (previously important level)
• Second resistance area: Around $84,500 (previously important resistance area)
• Third resistance area: $90,000 (key round number)
3. Core Support Levels:
• First support level: $73,500–$75,000 (previously important support level)
• Second support level: $67,300–$69,100 (previously important support level)
4. Operating Strategy for This Week (excluding sudden news impacts)
① Medium-term strategy:
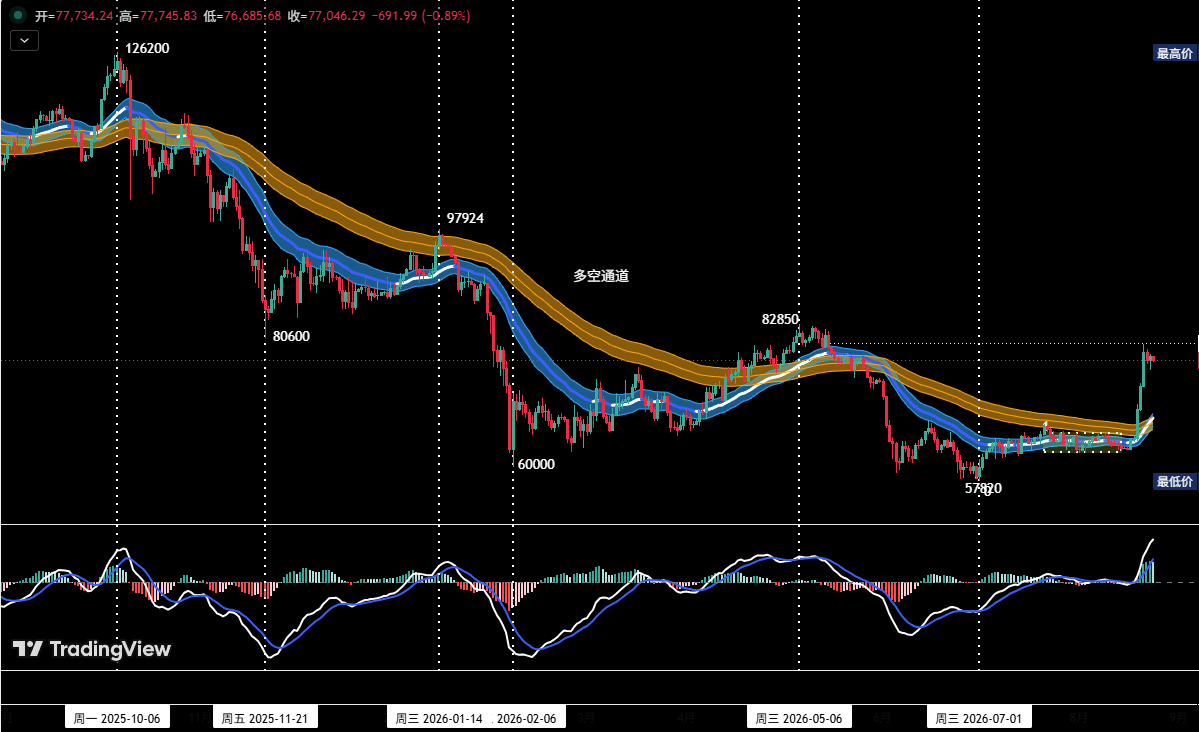
Figure 3 Bitcoin Daily K-line Chart: (Position Monitoring Model)
Position Monitoring Model: As shown in (Figure 3), the current price has effectively broken through the "bull-bear channel," indicating a change in market structure in the short term; the current medium-term position has dropped to zero and remains in a cash position awaiting observation.
② Short-term strategy: Use 30% of positions to set stop-loss points, based on support and resistance levels, seeking to make "price difference" opportunities. (Using 30 minutes/60 minutes as the operating period).
③ In short-term operations, to dynamically adapt to complex market changes, we have outlined the following operational plans in advance.
•Plan A: Lightly enter long positions in strong support areas.
• Open Position: If the wave c rebound ends and starts to pull back. When the price falls back to the above first or second important support levels, and shows a clear stabilizing pattern while the quantitative model synchronously sends out bottom signals, a long position of around 30% can be established.
• Risk Control: Set the initial stop-loss level.
• Closing: When the price rebounds near significant resistance points and combined with model signals, positions can be gradually closed for profit-taking.
3. HYPE Daily Level Trend Structure Analysis:
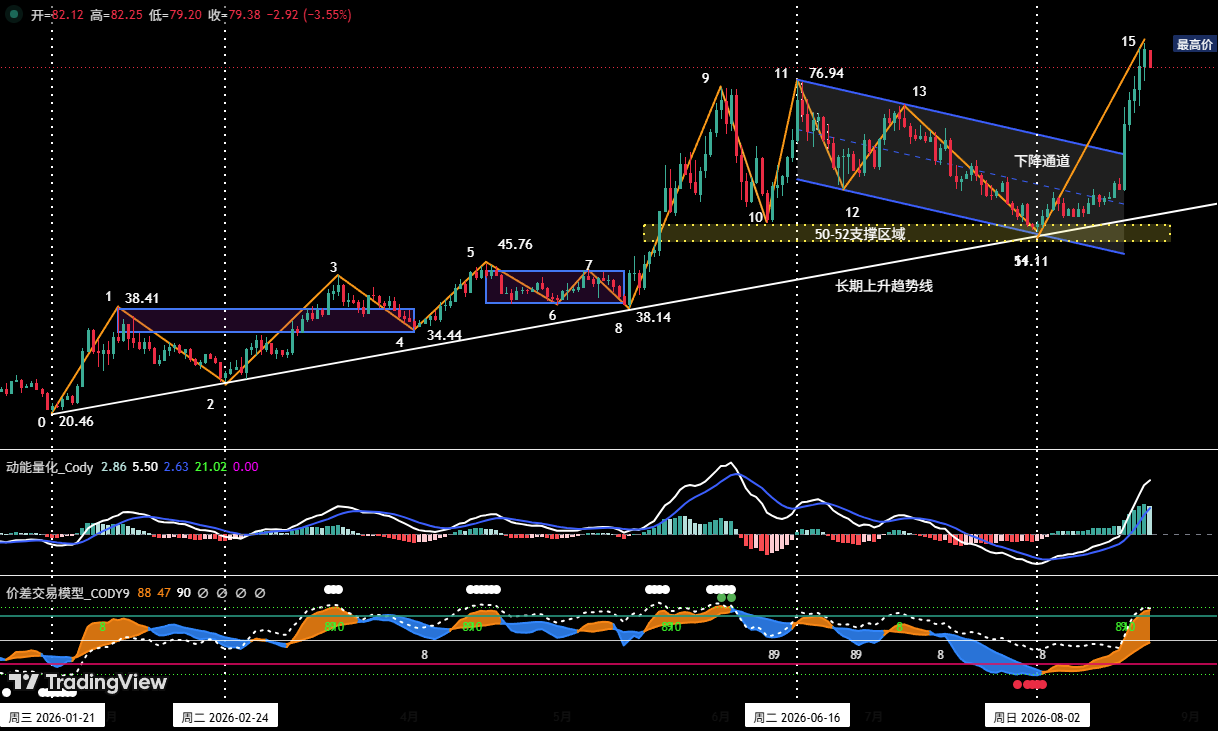
Figure 4 HYPE Daily K-line Chart
1. HYPE Recommendation Analysis History
① First Coverage and Rising Core Logic (February 23)
In the weekly review published on February 23, we first introduced the investment value and long opportunities for HYPE. At that time, the virtual currency market was in an extremely pessimistic environment, and we derived the following core judgments based on trend theory analysis:
First, Confirmation of Trend Theory Reversal
HYPE started a separate oscillation upward trend after completing the bottom at $20.46 on January 21, 2026. At that time, the price had confirmed the breakthrough of the long-term downward trend line connecting the highs of September 2025 (approximately $59.48) and October 2025 (approximately $50.17), marking a formal reversal of the previous bearish structure.
Second, Wave Theory Deduction
Using wave theory to break down HYPE's trend structure indicates:
▪ Medium-term Wave I (Driving Wave): From January 21 ($20.46) to February 3 ($38.41) ▪ Medium-term Wave II (Adjustment Wave): From February 3 to February 23, indicating the adjustment structure is close to the end
▪ Medium-term Wave III (Potential Main Upward Wave): To be launched at any time.
(For more detailed content, please read the February 23 Weekly Review article)
Currently, it can be seen from the daily chart that Medium-term Wave III (Main Upward Wave) officially started from the low of $25.60 on February 24, and we accurately captured this key starting point.
② Continuous Tracking and Performance Validation
Since February 23, we have published 26 consecutive special analyses, with this being the 27th time (maintaining weekly update frequency). Each period systematically deconstructed the trend structure evolution from multiple cycle dimensions and proposed clear investment decision recommendations and trading plans for the upcoming week.
▪ Price Milestone: Last week, driven by significant positive news, the price reached an all-time high since its listing, peaking at $83.38.
▪ Return Performance: Since the initial recommendation, the maximum increase has reached 225.7%, validating the effectiveness of the initial investment logic.
2. Daily Trend Structure Analysis:
Since the rising trend initiated from the low of $51.11 on August 2, it has been running for 21 trading days. Last week, catalyzed by significant positive news, the price reached a historical high. Currently, from the daily chart, the adjustment trend from June 16 to August 2 has ended. Last week, the market saw simultaneous rise in both price and volume, with sufficient upward momentum: as the price reached a historical high, it indicated that upward space is further opened, with the next target pointing towards the $90 round number.
4. HYPE Trading Outlook and Short-term Operational Strategy for This Week
1. HYPE Trading Trend Outlook for This Week:
① Core Resistance Levels:
• First resistance level: Near $90
② Core Support Levels:
• First support level: Near $77
• Second support level: Near $73
This Week's Core Viewpoints:
Focus on observing the price confirming the effectiveness of the breakout after surpassing the resistance at $77 last week.
2. HYPE Short-term Operational Strategy for This Week:
This week’s short-term operation:
① For those holding long positions: If you have established long positions in the $50–$52 area according to previous trading plans, it is recommended to move the initial stop-loss point up to protect existing profits and strictly adhere to stop-loss discipline, holding positions for potential gains.
② For those without positions: If the price confirms a breakout after pulling back to the previous high resistance at $77, consider lightly entering long positions, ensuring to set stop-loss points and strictly executing them.
5. Special Reminder:
1. When opening positions: Immediately set the initial stop-loss level.
2. When profits reach 1%: Move the stop-loss level to the opening cost price (break-even point) to ensure capital safety.
3. When profits reach 2%: Move the stop-loss level to the position of 1% profit.
4. Continuous tracking: After this, for every additional 1% profit obtained, the stop-loss level will be moved 1% correspondingly, dynamically protecting and locking in profits.
The financial market is ever-changing, and all market analysis and trading strategies need to be dynamically adjusted. All viewpoints, analytical models, and operational strategies mentioned in this article originate from personal technical analysis, serving only as personal trading logs, and do not constitute any investment advice or operational basis. The market carries risks, and investments should be approached with caution; do not make decisions based on this.
免责声明:本文章仅代表作者个人观点,不代表本平台的立场和观点。本文章仅供信息分享,不构成对任何人的任何投资建议。用户与作者之间的任何争议,与本平台无关。如网页中刊载的文章或图片涉及侵权,请提供相关的权利证明和身份证明发送邮件到support@aicoin.com,本平台相关工作人员将会进行核查。


