Crypto Circle Academic: Stay calm amidst the Ethereum (ETH) frenzy on 8.24, and understand the core of Ethereum's high-level fluctuations? Latest market analysis reference
Ethereum's current price is 2440. This wave of rise has directly broken the previous prolonged oscillation pattern. Many friends, after missing the opportunity, have become restless, fearing to enter at a high and also worrying that the market will continue to rise and leave them behind. This dilemma reflects the true state of most people in the current market. After a big bullish candle emerges, the market's bullish sentiment is ignited instantly, but the hotter the market gets, the more one should not let the excitement cloud their judgment.
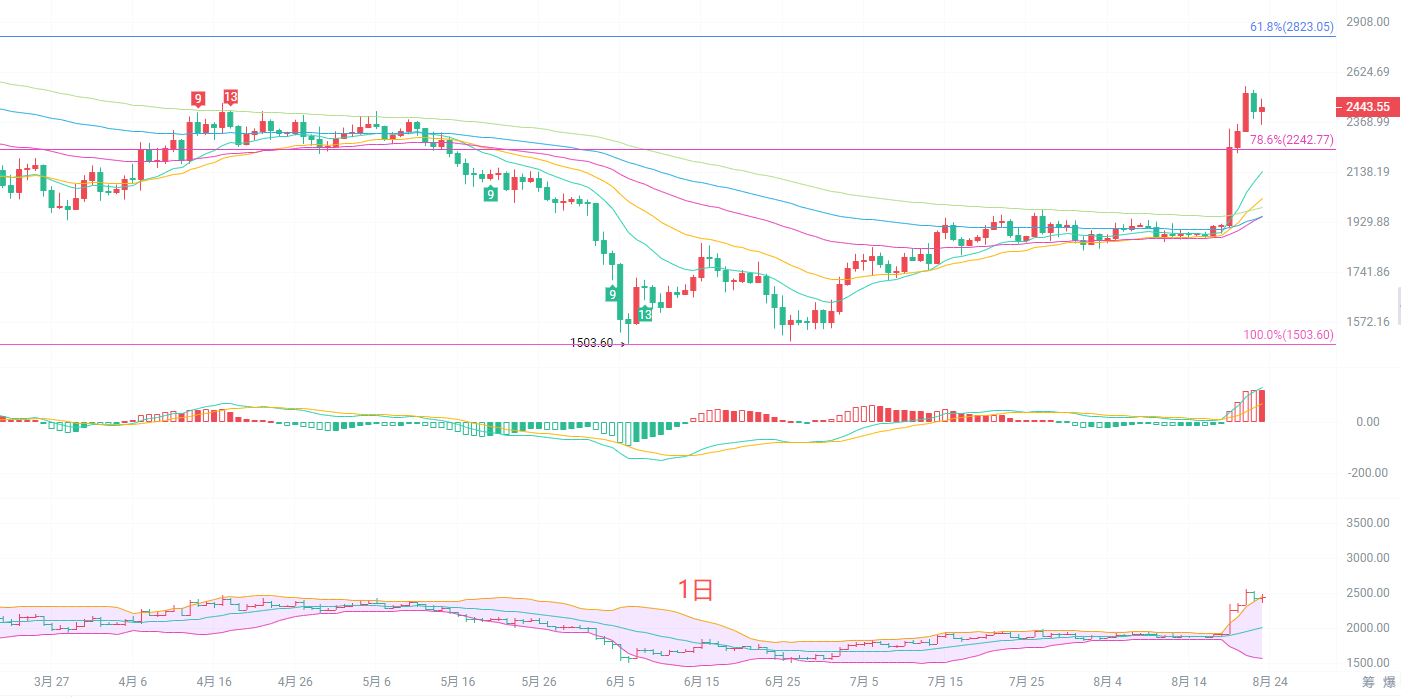
After the daily K-line big bullish candle breaks through the range, the price stands above all EMA moving averages, with the moving averages turning from flat to diverging upwards, indicating that the overall major trend has switched to bullish dominance. The Bollinger Bands open upwards, with the price operating near the upper band, and the MACD indicator maintains high red bar expansion, with bullish momentum still online, but the indicator has reached a high range, presenting potential risks of a top divergence. Key resistance above is around 2485, the peak of this round of rise. If it cannot effectively stabilize above this level, a correction will unfold on the daily chart; the important support below falls at the Fibonacci 78.6% position of 2242. This is the key watershed for this wave of increase. As long as this position is held, the bullish trend of this round will not be disrupted.
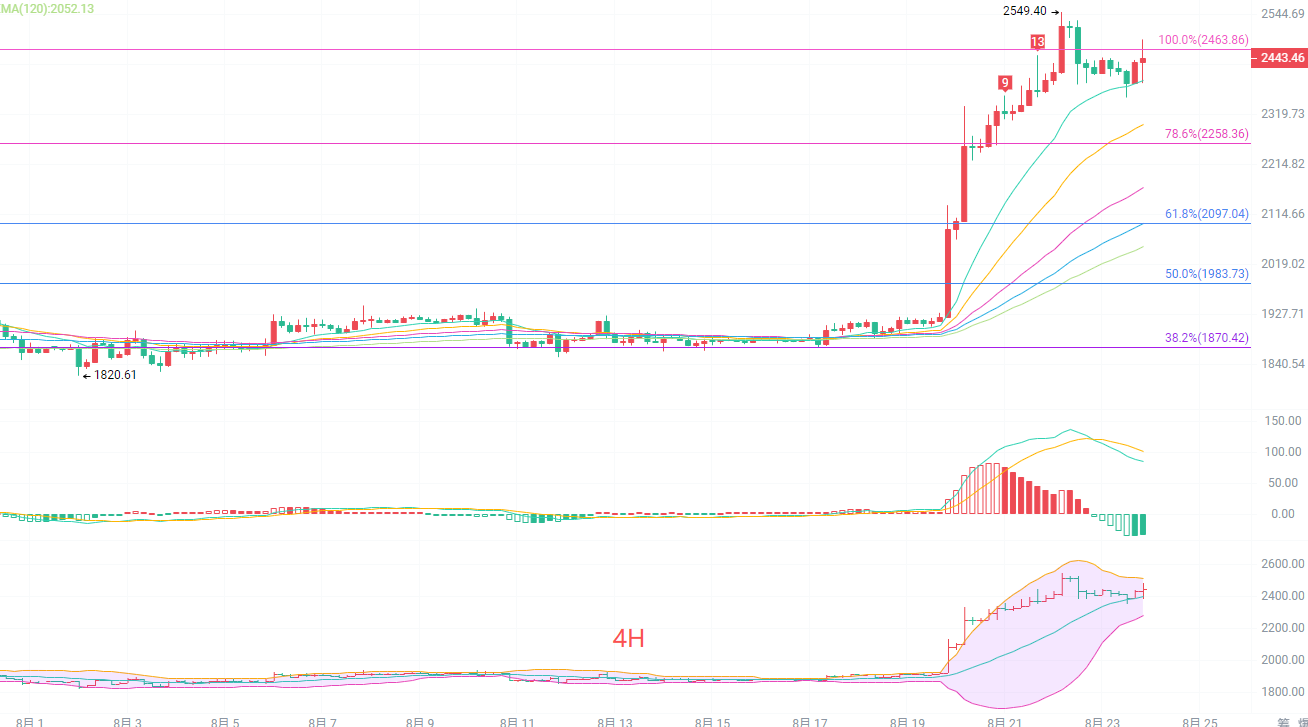
After the four-hour K-line peaked at 2549, it began to fall and oscillate at a high level. The short-term EMA moving average remains in a bullish arrangement; however, the MACD red bars continue to shrink, with upward momentum showing significant decay, which is a typical high-level stagnation pattern. After the upper Bollinger Band is under pressure, the price begins to converge towards the middle band, with the Fibonacci 100% position at 2463 becoming the first pressure level in the short term. There is no direct reversal at the four-hour level, just a depletion of bullish strength, likely leading to high-level oscillations and shakeouts. The first support below is near 2370; if this level is lost, it will further retrace to the 78.6% correction level of 2258. Operationally, it is no longer suitable to chase blindly; waiting for a retest to confirm support before making layouts will be safer.
Short-term reference:
Do not break below 2370 to 2340, set a stop loss of 40 points, target 2460 to 2530.
Do not break above 2460 to 2490, set a stop loss of 40 points, target 2330 to 2300.
Specific operations should primarily rely on real-time market data; for more detailed information, one can inquire with the author. The article publication may have delays and is recommended for reference only; risk is to be borne by oneself.

Warm reminder: The above content is solely created by the author of the public account. Ads at the end of the article and in the comments section are unrelated to the author; please discern carefully. Thank you for reading.
免责声明:本文章仅代表作者个人观点,不代表本平台的立场和观点。本文章仅供信息分享,不构成对任何人的任何投资建议。用户与作者之间的任何争议,与本平台无关。如网页中刊载的文章或图片涉及侵权,请提供相关的权利证明和身份证明发送邮件到support@aicoin.com,本平台相关工作人员将会进行核查。