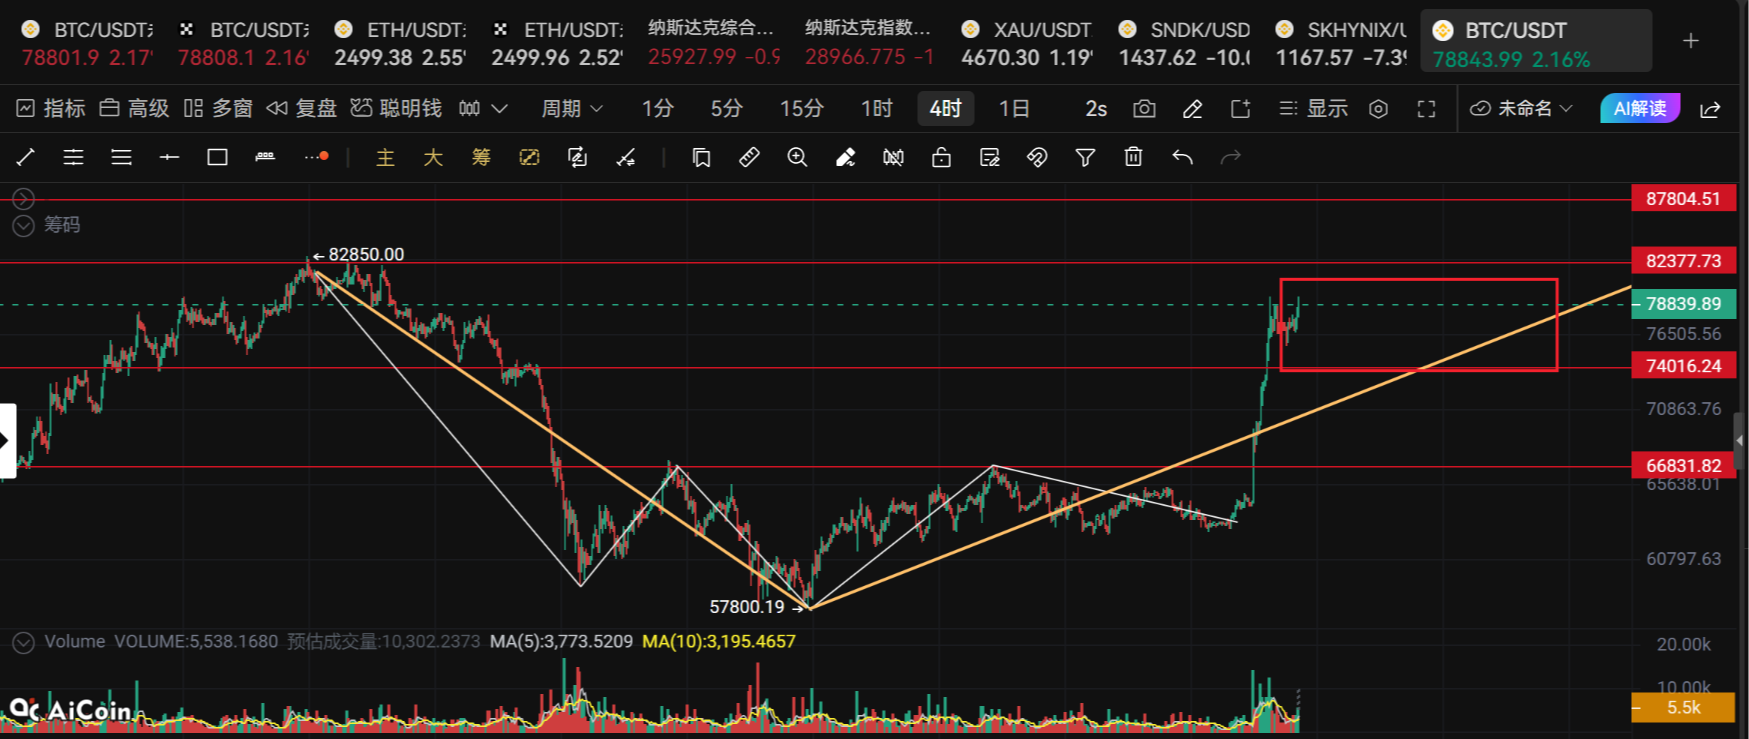
Bitcoin Hits $80,000: Is the High-Level Fluctuation Bullish or a Trap?
The recent trend of Bitcoin has clearly exceeded the expectations of most people.
After breaking through $70,450, the price strengthened consecutively, rising sharply from around $64,000, hitting a maximum of $79,550 in just a few days, just one step away from $80,000. The short-term increase exceeded 23%, rising by more than 15,000 points.
This level of rapid rise indicates that market funds are clearly returning, and the risk appetite in the crypto market is also rapidly warming up.
But problems also arise:
Bitcoin has risen to around $80,000, should we still pursue it?
My judgment is:We cannot simply define the current situation as reaching a top, nor should we immediately go short just because of a peak followed by a pullback. The more rational positioning right now is a bullish tendency in a strong upward trend with high-level fluctuations.
Daily sharing of real-time trading strategies, free provision of position diagnosis, liquidation strategies, and market practical insights, scan the code to follow the public account“Bitcoin Watermelon”,Join the community for strategy!
1. From $64,000 to $79,550, the Market has Entered a Strong Phase
Let’s first look at the hourly chart.
After starting around $64,000, Bitcoin has almost continuously moved up along a very steep rising trend line.
In just about two days, the price completed an increase of over 20%.
This kind of trend usually creates a certain psychology:
At the start of the rise, many people dare not buy;
When the price hits $70,000, it feels too high;
At $75,000, people start to worry “if I don’t get on now, I will miss my chance”;
When it gets close to $80,000, market sentiment tends to peak.
Historically, many rapid rises are most dangerous not when no one buys, but wheneveryone starts to believe it will keep rising.
Thus, the biggest risk right now is not that the price has risen a lot, but whether the market has entered an overheated emotional phase.
2. $79,550 Peaks and Retracts, but $76,200 Shows Clear Support
Today, it hit a maximum of $79,550, then quickly fell back, hitting a low near $76,200.
If you look solely at the K-line, it would be easy to think:
“Didn’t break through $80,000, looks like it’s topping out.”
But a further observation reveals that the situation is not that simple.
After the price retraced to around $76,200—$76,300, it quickly found support and returned above $77,000.
Especially on the hourly chart, although the MACD has shown a death cross, and short-term momentum has cooled, the price has not simultaneously made new lows.
This means:
Indicators have started to cool, but the price has not truly weakened.
This kind of trend resembles short-term digestion after a rapid rise, rather than a completed trend reversal.
Currently, the most important reference for the hourly chart is around $76,300.
If it can hold here, then the upward structure remains valid.
3. 4-Hour Chart: Upward Structure Has Not Been Destroyed
The 4-hour level is still a very critical part of the entire trend.
After reaching $79,550, a long upper shadow appeared, but the price did not continue to fall below $76,300.
At the same time, DMI remains bullish, ADX stays in a high position, and although MACD has not continued to expand significantly, it is still in a strong area overall.
Thus, the more reasonable understanding of the 4-hour level currently is:
The upward trend has not ended; it is just digesting earlier gains at a high level.
What truly needs vigilance is not the upper shadow at $79,550, but whether the next 4-hour can effectively break below $76,300.
As long as this level is not confirmed as broken by the 4-hour close, we cannot easily define the current situation as a trend reversal.
Daily sharing of real-time trading strategies, free provision of position diagnosis, liquidation strategies, and market practical insights, scan the code to follow the public account“Bitcoin Watermelon”,Join the community for strategy!
4. Daily Five Consecutive Up Days, Trend Inertia Still Very Strong
Now, let's look at the daily chart.
These past few days of continuous increase have formed a very obvious structure of consecutive up candles.
Today, although it retreated over $2,000 from $79,550, if the final daily line can still maintain a high position, then it remains a strong rising K-line.
Therefore, the real issue with the daily line is not:
“Has the trend turned bearish?”
But rather:
“How long will it take to digest the $79,550—$80,000 area?”
If the price can regain fresh funding support after fluctuating at a high level, the success rate of breaking through $80,000 will actually increase.
Thus, do not rush to judge a top just because a peak appears.
The most taboo in trading is trying to sell at the highest point and buy at the lowest point.
The truly stable way is to wait for the confirmation of key structures.
5. Weekly Chart: The General Direction is Still Bullish
The performance on the weekly chart is more direct.
This round of trend started from around $62,000—$63,000 and has risen close to $80,000.
From the weekly structure perspective, the general direction is still upward repair.
So putting together the hourly, 4-hour, daily, and weekly charts:
· Hourly: Cooling After Rise, Entering Short-Term Digestion
· 4-Hour: Strong Structure Remains Intact
· Daily: Upward Inertia Remains Very Obvious
· Weekly: General Direction Remains Bullish
· Therefore, the most reasonable judgment currently is not “imminent top,” but:
High-Level Fluctuation Bias Towards Bullish in a Strong Upward Trend.
Daily sharing of real-time trading strategies, free provision of position diagnosis, liquidation strategies, and market practical insights, scan the code to follow the public account“Bitcoin Watermelon”,Join the community for strategy!
6. Trading Volume and Open Interest: Funds Have Indeed Entered, But High Levels Begin to De-Leverage
Trading volume and open interest are currently a particularly noteworthy set of data.
During the process of hitting $79,500, open interest increased significantly, indicating that new positions did participate in the rise.
In other words, this round of rise is not entirely relying on stagnant funds.
However, after the peak, the position structure started to change.
The price did not fall noticeably, but open interest continued to decrease.
In this case, I tend to interpret this as:
De-leveraging at High Levels is Occurring.
It is particularly important to note that open interest reduction does not simply equate to “bears fleeing completely” or “bears pouring in.”
A decrease in OI simply indicates that positions are reducing; it is necessary to further assess which side is exiting by considering price, trading volume, active buying and selling, and funding structure.
However, one thing is relatively clear:
After reducing positions near $76,200, the price was quickly bought back, indicating that bears have not formed sustained pressure temporally.
Therefore, if there is another push towards $78,000—$79,550, and open interest can increase again while trading volume increases simultaneously, then new funding support will become clearer.
7. Moving Averages and Bollinger Bands: Short-Term Overheating, but the Larger Cycle Remains Strong
The moving average structure is currently still clearly in a bullish arrangement.
The hourly EMA12 is especially worth noting.
Since this round of increase started, there have been multiple rebounds each time the price tested the EMA12.
Therefore, the EMA12 can serve as a dynamic reference for the short term.
If the price effectively breaks below for 1—2 consecutive hours, then a further short-term retracement may occur.
However, at the 4-hour level, the EMA is still further below, currently around $73,000, indicating that there is still a significant gap before the larger cycle's upward structure is actually damaged.
Bollinger Bands are similarly structured.
The hourly chart has returned from outside the upper band back into the internal range, which signifies that the short-term extreme overheating state is being corrected.
Although the 4-hour chart has retraced, the Bollinger Bands are still expanding.
The daily chart is even more evident, with prices already running outside the upper band, and the bandwidth has begun to expand noticeably.
This implies:
The smaller cycles are cooling down, while the larger cycles remain in the trend release phase.
Therefore, the current pullback resembles a correction in time and space for an overextended divergence.
8. MACD and DMI: Significant Discrepancy Between Cycles
Currently, MACD displays a very typical multi-cycle divergence.
The hourly chart has already shown a death cross, indicating that short-term momentum is weakening.
However, the 4-hour remains strong, and both the daily and weekly charts continue upward overall.
DMI has also provided similar signals:
The hourly bullish advantage has cooled;
The 4-hour still has a clear bullish edge;
Daily bullish trends are forming;
Though the weekly has just witnessed a bullish cross, it has not yet completed a closing confirmation.
Thus, we cannot solely rely on the hourly MACD death cross to determine that the entire market has begun to turn bearish.
Cooling in the smaller cycles does not equate to a reversal in the larger cycles.
Daily sharing of real-time trading strategies, free provision of position diagnosis, liquidation strategies, and market practical insights, scan the code to follow the public account“Bitcoin Watermelon”,Join the community for strategy!
9. The Most Important Four Prices Going Forward
There’s no need to remember all the indicators right now.
I believe we only need to focus on a few key levels going forward.
First: $78,000
This is currently a very critical battleground between bulls and bears.
If it can regain $78,000 firmly, and if the 4-hour level can confirm, then the probability of the market testing $79,550 and even $80,000 again will significantly increase.
Second: $79,550—$80,000
This is the most direct pressure zone currently.
The previous high is right here.
If it storms back to this point, and trading volume and open interest can simultaneously expand, the significance of the breakthrough will be stronger.
Third: $76,300
This is the current most important defensive level.
As long as the 4-hour does not effectively break below $76,300, I still tend to define the current pullback as high-level digestion after the rise.
If the 4-hour confirms a break below, then the current judgment of “fluctuating towards bullish” will need to be reassessed.
Fourth: $75,500
If $76,300 is lost, then the next key support to watch closely is $75,500.
Further down, the short-term structure will significantly weaken.
Daily sharing of real-time trading strategies, free provision of position diagnosis, liquidation strategies, and market practical insights, scan the code to follow the public account“Bitcoin Watermelon”,Join the community for strategy!
11. If It Continues to Rise, Where to Look Upwards?
If $78,000 is firmly regained and the $79,550—$80,000 area is effectively broken, then the attention can sequentially focus on:
$81,300 → $82,000 → $83,600.
These levels can serve as phased targets for further rises.
However, it needs to be emphasized:
Target levels are not where you should chase the rise directly.
What truly matters is to observe whether trading volume, open interest, and K-line structure simultaneously support the breakthrough when the price approaches these areas.
12. Final Judgment: Fluctuating Toward Bullish, Not Blindly Chasing the Rise
Integrating all cycles, my core judgment is very clear:
Bitcoin is still in a strong upward trend, but has entered a high-level digestion phase after the first round of rises.
Thus, although a short-term pullback exists, it is not sufficient to confirm a trend reversal.
The next key points to observe are:
Can $78,000 hold firmly;
$76,300 can be defended;
Can $79,550—$80,000 be effectively broken through.
If the 4-hour continues to hold above $76,300, I will continue to interpret the pullback as a high-level fluctuation following the rise.
If $78,000 is firmly regained, focus on $79,550 and $80,000.
If the 4-hour effectively breaks below $76,300, then the current judgment of “fluctuating toward bullish” fails, and the next key level to watch is $75,500.
Therefore, the most important thing right now is not to guess the top.
Do not blindly short because it has risen too quickly, nor chase the rise recklessly just because the trend is strong.
Let the market first provide confirmation.
If the trend has not been broken, then go with the flow;
If the key support breaks, then adjust your judgment.
Current core conclusion: Fluctuating toward bullish in a strong upward trend.
Daily sharing of real-time trading strategies, free provision of position diagnosis, liquidation strategies, and market practical insights, scan the code to follow the public account“Bitcoin Watermelon”,Join the community for strategy!

免责声明:本文章仅代表作者个人观点,不代表本平台的立场和观点。本文章仅供信息分享,不构成对任何人的任何投资建议。用户与作者之间的任何争议,与本平台无关。如网页中刊载的文章或图片涉及侵权,请提供相关的权利证明和身份证明发送邮件到support@aicoin.com,本平台相关工作人员将会进行核查。