Academician of the cryptocurrency circle: The box suppression of Ethereum (ETH) on August 15 continues to unfold, and the signal for a change in Ethereum is quietly brewing! Latest market analysis reference
Ethereum is currently priced at 1883, fluctuating within a narrow range, and many friends are enduring the agony of holding positions, as it neither rises nor falls significantly, making stop-loss sweeps a regular occurrence. Many people chase after rises only to see a drop, and shorting leads to rebounds, being whipped back and forth by the market. There is no clear direction in the major trend, and short-term trading relies on the range for speculative plays. The more this kind of volatile market occurs, the less frequent and reckless opening of positions should be, as chasing highs and lows easily depletes capital. Don't always think about seizing every small fluctuation; sometimes, proper observation without involvement is also a form of trading.
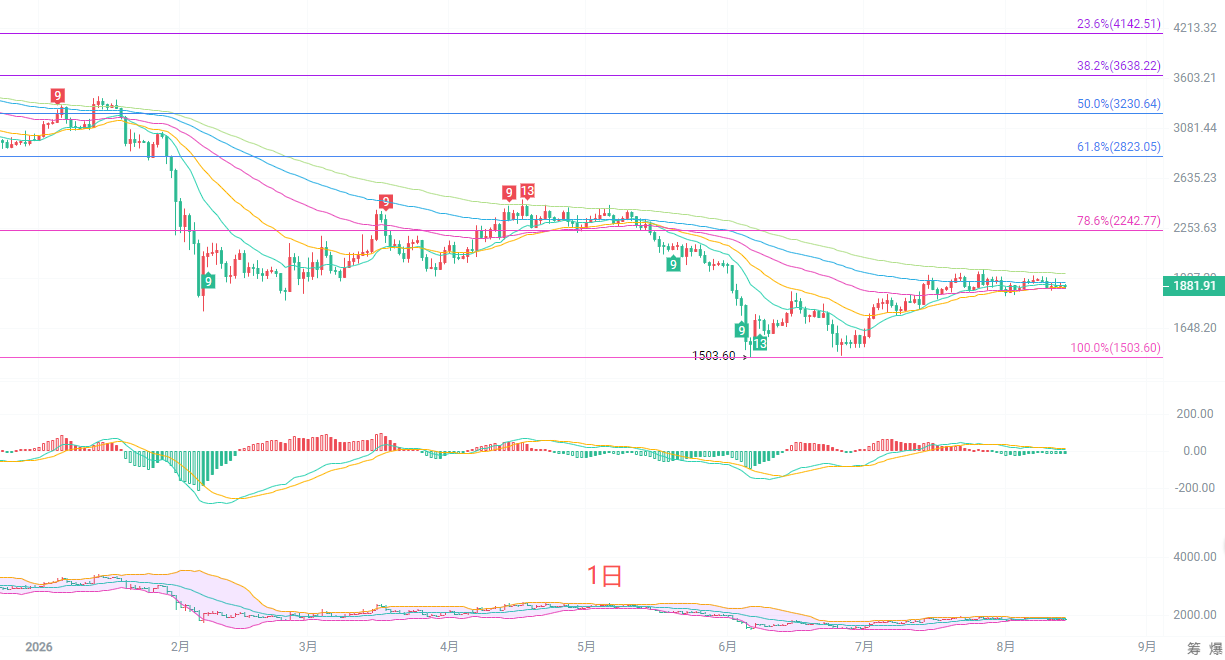
The daily candlestick is currently operating near the middle and lower bands of the Bollinger Bands, with multiple EMA moving averages gradually intertwining, indicating that the daily level is still in a bottom repair and consolidation pattern. The MACD indicator DIFF and DEA are slowly converging below the zero line, with bearish momentum continuously diminishing, but it has not yet formed a clear bullish reversal signal. The key resistance point above is around 2242, with strong support at the low point of 1503. At this stage, the daily line is defined as a rebound repair before breaking the key resistance; it is not a reversal into a major bull market. The larger framework should still be treated with a consolidation mindset, waiting for the price to choose a direction without subjectively predicting a unilateral surge or drop.
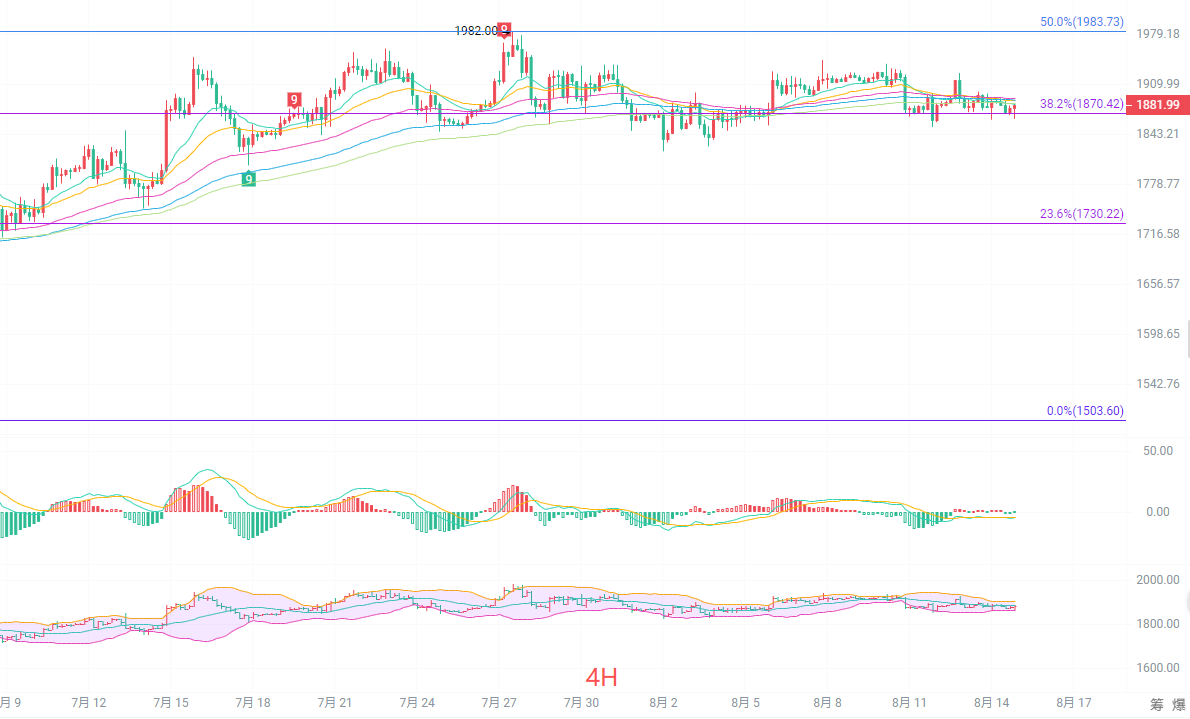
The four-hour candlestick is above the 38.2% Fibonacci retracement level at 1870, with the short-term moving averages EMA15 and EMA30 interweaving. The Bollinger Bands have a narrowing opening, presenting a typical box consolidation pattern. The important resistance above is near 1983, which is the 50% Fibonacci retracement level, where multiple attempts to break through have failed to establish a solid position. The MACD indicator hovers around the zero line, with long and short forces being relatively balanced. The support below is at 1730, which is the 23.6% retracement level. Without breaking the 1983 resistance in the four-hour chart, it is difficult for the market to open upward space; once the support at 1730 is broken, a retracement will be restarted. Currently, the four-hour chart does not show a one-sided trend; it is suitable for a range-based approach and not suitable for chasing positions.
Short-term reference:
Southern trial entry point 1875 to 1855, stop loss 50 points, target looking at 1940 to 1980.
Northern trial entry point 1970 to 1990, stop loss 50 points, target looking at 1910 to 1880.
Specific operations should rely on real-time market data. For more information, please consult the author. There may be delays in article publication, and it is recommended for reference only; risk is self-borne.

Warm reminder: The above content is solely created by the author of this public account. The advertisements at the end of the article and in the comments section are unrelated to the author. Please discern carefully; thank you for reading.
免责声明:本文章仅代表作者个人观点,不代表本平台的立场和观点。本文章仅供信息分享,不构成对任何人的任何投资建议。用户与作者之间的任何争议,与本平台无关。如网页中刊载的文章或图片涉及侵权,请提供相关的权利证明和身份证明发送邮件到support@aicoin.com,本平台相关工作人员将会进行核查。