Academician of the Cryptocurrency Circle: On August 15, Bitcoin (BTC) is being pressured layer by layer by moving averages, and the market is brewing a breakout at the directional level! Latest market analysis
Bitcoin is currently priced at 63000, and Bitcoin has entered a frustrating oscillating phase again. Many friends should have experienced this recently, watching the market fluctuate, getting crushed when going long, and being pulled when going short, frequently hitting stop losses, making it hard to hold positions has become the norm. The broader trend has not shown a clear unilateral move, as most people are always thinking about catching a big market wave, resulting in frequent trading back and forth, and the capital is slowly depleted in the oscillation.
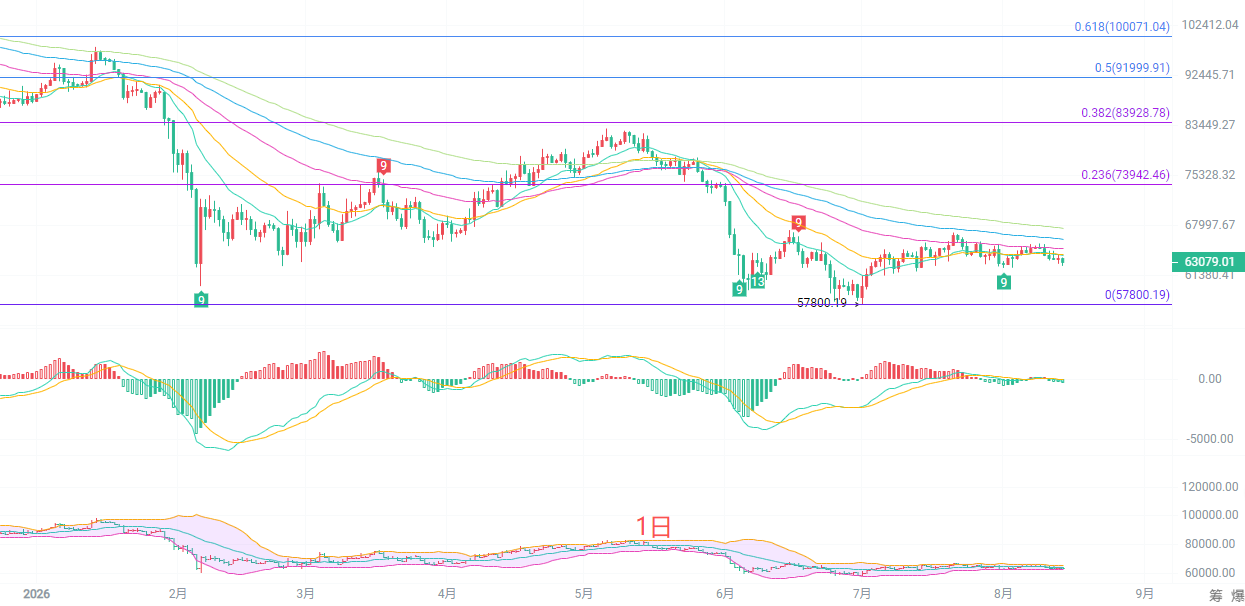
The daily K-line is still in a low-level repair oscillation pattern. The mid-to-long-term EMA60 and EMA90 are still moving downward, and the macro bearish pressure has not been completely lifted. The Bollinger Bands are continuously narrowing, and the volatility of the market is gradually shrinking, indicating that the window for a major trend reversal is approaching. The MACD indicators DIF and DEA are still below the zero axis, with the green bars slightly shrinking, indicating that the bearish momentum is waning, but no clear reversal signal has appeared. The key support below is at 57800, and the first resistance above is at 73942. The current price is in the middle of the range, and until an effective breakout occurs on the daily chart, it is difficult to open a trending market; it is more likely to continue oscillating within the range.
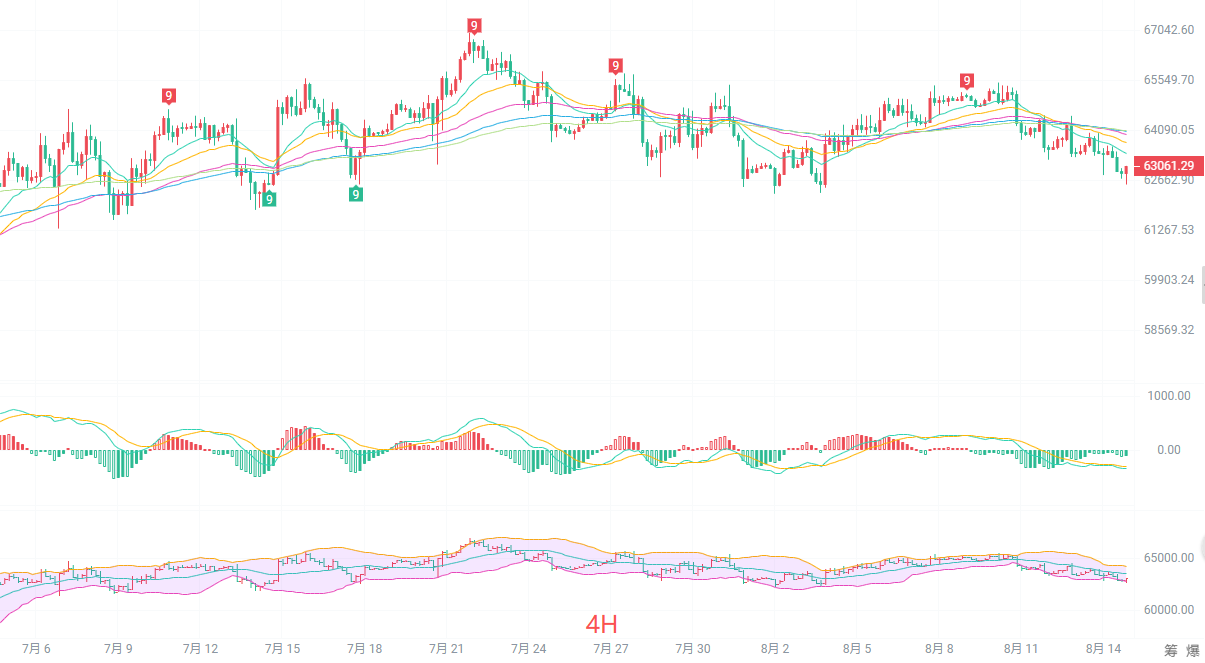
The short-term trend in the four-hour K-line is biased towards weakness, with the price breaking below multiple short-term EMA moving averages, and the moving average system starting to turn downward. The Bollinger Bands are also synchronously closing down, with the price operating below the middle band, indicating a weak short-term market. The MACD's DIF and DEA lines are both running downward, with the MACD green bars slightly increasing, indicating a release of short-term bearish strength. The key resistance above is at 64279, which is the upper band of the Bollinger Bands, and the support below looks towards 62804 which is the lower band. Before the four-hour level is back above the middle band, it is hard for bulls to regain short-term initiative, and it is highly probable to maintain a downward oscillation testing the lower support in the short term. It is not suitable to blindly chase high positions in terms of operations.
Short-term trading reference:
Long position trial point at 62900 to 62500, stop loss at 500 points, target looking at 63500 to 64500
Short position trial point at 64000 to 64500, stop loss at 500 points, target looking at 63200 to 62800
Specific operations should be based on real-time data from the market, more detailed information can be consulted with the author. The article release has a delay, and it is recommended for reference only, risk is borne by the reader.

Kind reminder: The above content is solely created by the author of the public account, and advertisements at the end of the article and in the comments section are not related to the author. Please be careful in distinguishing, thank you for reading.
免责声明:本文章仅代表作者个人观点,不代表本平台的立场和观点。本文章仅供信息分享,不构成对任何人的任何投资建议。用户与作者之间的任何争议,与本平台无关。如网页中刊载的文章或图片涉及侵权,请提供相关的权利证明和身份证明发送邮件到support@aicoin.com,本平台相关工作人员将会进行核查。