The recent trend of Bitcoin has still not escaped the pattern of fluctuation.
Previously, the price tested around $63,200 multiple times, and there is indeed some support in this area. However, it is important to note that each rebound has not reclaimed the previous high, and the height of the rebounds is gradually decreasing.
Therefore, although $63,200 can temporarily provide support, it cannot be simply understood as the end of the adjustment. On the contrary, from the current price structure, the market is forming an increasingly obvious converging state, with the upward pressure gradually decreasing and the downward support temporarily not being effectively broken, indicating that the market is gradually entering a critical phase before a trend change.
CPI Meets Expectations, but Market Recovery Remains Weak
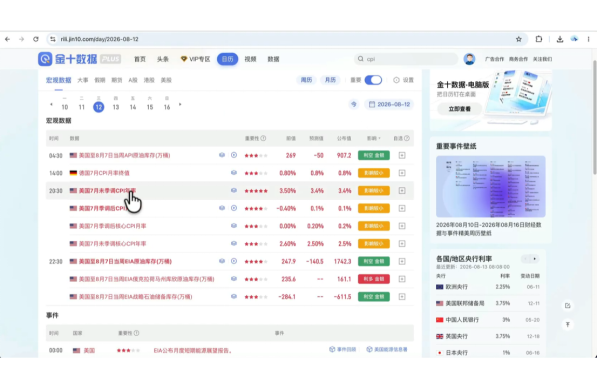
The U.S. CPI data released last night generally met market expectations.
The CPI year-on-year rate was 3.4%, and the core CPI was 2.5%, overall remaining in a relatively mild state, alleviating some of the market's concerns about further interest rate hikes.
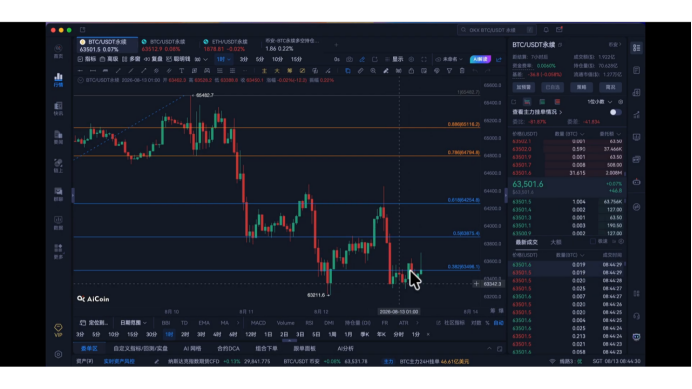
After the data release, Bitcoin did experience a surge, but this increase quickly revealed a problem:The price cannot truly stabilize in the key pressure zone.
The price once surged to around $64,400—$64,500, but quickly fell back on the hourly level, failing to effectively stabilize at $64,200, and then the price quickly dropped, returning to around $63,200.
This indicates that the biggest issue in the market right now is not the lack of positive news, but ratherinsufficient liquidity and ongoing selling pressure above.
In the current context of overall weak liquidity in the cryptocurrency market, even when there are positive stimuli, it is difficult for the market to maintain a sustained upward trend.
The previous geopolitical risks are also gradually weakening their impact on the market. Pakistan is seeking to extend the ceasefire period between the U.S. and Iran, and as the influence of geopolitical risks diminishes, the sources of volatility that the market originally relied on are also decreasing.
Therefore, recently, whether in terms of funds flowing into or out of the cryptocurrency market, the performance has been relatively restrained.
But from another perspective, when market liquidity and volatility are compressed to an extreme degree, it often also means that new volatility is brewing.Daily sharing real-time trading strategies, providing free position diagnostics, ideas for minimizing losses, and market practical tips, scan to follow the public account“Bitcoin Watermelon”, join the community for strategies!
Short-Term: Double Top Appears, Price Enters Convergence
From the hourly perspective, the price remained sideways for a long time during the day yesterday, with indicators gradually recovering during the fluctuation, and the MACD shifted from a death cross to a golden cross.
Previously, the hourly price once stood above the EMA12, so the short-term indeed has the conditions for an upward surge.
However, the problem is that this recovery has not transmitted to the higher cycles.
After the price impacted around $64,500, it did not continue to break through, and the hourly line did not truly stabilize at this position, subsequently falling back quickly.
This formed a fairly obvious short-term double top structure.
At the same time, a double bottom support formed near $63,200 below.
In other words, there are clear structures at both ends of the market:
There is support at $63,200 below and pressure at $64,000—$64,500 above.
As the price continues to operate within this range, the fluctuations are getting smaller, and the converging triangle is becoming increasingly obvious.
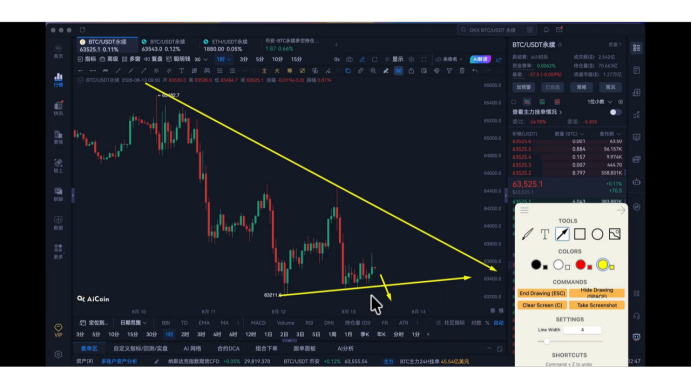
From the short-term structure, the biggest characteristic right now is:
The highs are continuously lowering, while the lows have not significantly moved down for now.
If this structure continues to be maintained, it will ultimately need to choose a direction.
4-Hour: Rebound Highs Continuously Lowering
The structure in the 4-hour cycle is clearer.
Previously, Bitcoin rebounded from around $62,200, rising to approximately $65,400—$65,500, and then a clear reversal occurred.
From the trend after the reversal, several consecutive bearish candles appeared, and the price quickly fell back.
Around August 12, the price formed a phased support around $63,200, consistent with the structure of the hourly level.
After failing to surge again last night, the 4-hour volatility further narrowed.
If we connect the previous rebound highs, a very obvious phenomenon can be seen:
Each rebound high is lower than the previous round.
Meanwhile, although the lows below have seen some elevation, the magnitude is not significant.
Therefore, the 4-hour level is actually forming a converging triangle close to a double bottom.
The continuously narrowing triangle also means the market is getting closer to a true directional choice.
Daily sharing real-time trading strategies, providing free position diagnostics, ideas for minimizing losses, and market practical tips, scan to follow the public account“Bitcoin Watermelon”, join the community for strategies!
Daily: Rebound Has Never Reclaimed Key Positions
From the daily cycle, Bitcoin started to rebound from around $57,000—$57,700 and had once repaired to around $67,000.
Around July 21, the highest price approached $67,000, but it never effectively broke through $67,200.
Subsequently, the market started to retreat.
From July 21 to August 13, more than three weeks have passed, yet the daily rebound highs have never reclaimed the previous key positions.
Currently, there remains support around $62,000 below, which is still more than $1,000 away from the current price.
The problem is that the rebound highs above have been consistently suppressed.
Yesterday, the price opened at about $63,500 and closed at about $63,454, showing little overall change, but during the day, it spiked to around $64,450 at the highest and dropped to about $63,280 at the lowest, ultimately forming a long upper shadow bearish candle.
Currently, the daily structure has not shown any significant recovery.
After three consecutive bearish candles, if the price wants to genuinely disrupt this bearish structure, it needs to reclaim the key positions.
In simple terms:
To the upside, it needs to stabilize at least at $64,000—$64,500; to the downside, it needs to effectively break below $63,200.
Before these two conditions occur, the market will still belong to a phase of fluctuation and consolidation.
Weekly: $63,200—$66,000 Remains the Core Range
The weekly level is still within the key range.
Since rebounding from around $57,000 at the end of June, Bitcoin has gradually repaired but then entered another round of adjustment.
The two most important positions in the market are still relatively clear:
Below: Around $63,200
Above: Around $65,800—$66,000
Among them, $63,200 has been tested multiple times this week, and each test was followed by a certain degree of rebound.
However, the problem is that the price has also consistently failed to return above $66,000.
Therefore, the entire market is actually operating within the interval of $63,200—$66,000.
This range has lasted for a while.
In terms of time and volatility, the market has shown clear compression.
Thus, the remaining time of this week is particularly worth watching.
If $63,200 continues to hold, then the market may still maintain its fluctuation; but if the price tests $63,200 again and effectively breaks below after a third test, then the market structure is likely to undergo significant changes.
OI and Volume: Bearish, but Cannot Be Simply Understood as Short Selling Entry
Let’s take a look at the trading volume and open interest.
Since observing from August 12, open interest experienced a drop followed by a quick rebound. Overall, open interest has increased compared to before.
However, during this time, the price did not show significant increase, instead fluctuating sideways at low levels or even falling back somewhat.
In this situation, we cannot simply conclude “price drop + rising open interest = large shorts entering the market.”
Because we also need to combine trading volume and active buying and selling forces to judge.
At present, a more reasonable understanding is:
The price is at a relatively low level, open interest has increased, but the market has not formed a clear one-sided trend.
Therefore, OI and volume can only serve as a supplementary indicator for bearish judgment currently, and cannot be the core basis for determining market direction.
Considering the continuously lowering rebound highs, the market focus is indeed slightly leaning downward.Daily sharing real-time trading strategies, providing free position diagnostics, ideas for minimizing losses, and market practical tips, scan to follow the public account“Bitcoin Watermelon”, join the community for strategies!
Moving Averages: Support Gradually Transforming into Pressure
The daily moving average structure currently puts clear pressure on the price.
The 5-day moving average and 7-day moving average are currently located at around $63,800 and $64,100—$64,200 respectively.
If the price wants to continue to rebound, it needs to break these short-term moving averages first.
The 20-day moving average is currently around $64,000, coinciding with the middle band of the daily Bollinger Bands.
More notably, the daily price has been below the 20-day moving average for three consecutive days.
This indicates that the medium-term structure still remains weak.
Currently, the main support for the price is provided by the 60-day moving average, approximately at $63,500.
Thus, the $63,400—$63,500 region is currently a very important defensive position.
If the price only briefly drops below the 60-day moving average but is able to quickly reclaim it the next day, it still cannot be directly defined as a trend turning bearish.
However, if the price cannot reclaim the 60-day moving average for more than 1—2 days, then the overall market will need to be treated as broadly bearish.
From a longer cycle perspective, the moving averages that once supported the price are gradually turning into pressure.
This is also one of the important signals of the current market structure changing.
Bollinger Bands: Volatility is Approaching the Limit
The bandwidth of the daily Bollinger Bands is still continuously narrowing.
Currently, the middle band of the daily Bollinger Bands is approximately at $64,000, while the price continues to operate below this position.
This extreme narrowing state usually means that the market is accumulating new volatility.
The 4-hour cycle, however, is somewhat different.
The 4-hour Bollinger Bands have previously expanded once, and it is still in the phase of releasing volatility, with the lower band around $62,900.
Therefore, from a short-term perspective, the market is actually:
The 4-hour volatility is gradually releasing, while the daily volatility remains extremely compressed.
This means that a round of volatility may occur short-term, but the signals that truly impact the larger trend level have not fully emerged yet.
MACD, RSI, and Trend Indicators
Regarding MACD, the daily chart formed a death cross around August 12, and although the downward momentum is not strong, it has indeed shown some degree of increase.
The downward momentum at the 4-hour level has alleviated, but it is still in a death cross structure.
At the hourly level, a small golden cross has appeared, indicating there is some demand for a short-term rebound.
Therefore, the signals currently given by MACD remain relatively complex:
A rebound exists at the hourly level, the 4-hour level appears weak, and the daily level remains bearish.
In terms of RSI, the hourly level has just touched around 50, the 4-hour level remains below 50, and the daily level is also below 50.
Several main periods’ RSI have not entered extreme overbought or oversold areas.
This means that it is currently neither suitable to blindly chase up nor to mindlessly chase down at this position.
The market is still in the middle area of its fluctuating structure.
ATR further verifies this point.
The daily ATR has dropped to about 1299, the weekly ATR has also dropped to about 5787, with overall volatility continuing to decrease.
In the 4-hour cycle, the normal volatility for a single K line is about $440.
At the current price range around $63,000—$63,500, normal volatility could very well reach $64,000, or even touch $64,200 through a spike.
Similarly, it could also test $63,200 downwards.
Therefore,simply touching $64,000 or $63,200 cannot immediately be regarded as a trend breakthrough.
What is truly important is whether the 4-hour closing line confirms the breakout.
Current Trading Thoughts: Fluctuation is Bearish with Focus Downward
Considering the current four cycles as well as moving averages, Bollinger Bands, MACD, RSI, ATR, trading volume, and open interest, the current situation is more suitable to be defined as:
Fluctuation is bearish, with focus leaning downward.
The hourly level may have some rebounds, but the rebound space should not be regarded too high for now.
The key focus above:
$64,000—$64,200
If the price cannot reclaim $64,200, then the short-term rebound remains a weak repair.
The key focus below:
$63,200
This position has already seen two tests.
If it tests downwards again, that is the third test of $63,200, and if it effectively breaks below, the market will need to look for further support downwards, with the next phase focusing on around $62,500.
Conversely, if the price tests $63,200 again and does not break below, and quickly pulls back above $63,600, then the current bearish judgment will face certain risks.
If it further reclaims $64,200, the current bearish structure can basically be seen as invalid.
Thus, what truly needs to be waited for is not prediction butconfirmation of the breakout.
Conclusion
The current Bitcoin trend has entered a very obvious converging stage.
The rebound highs above continue to lower, support at $63,200 has sustained multiple tests, daily volatility is continuously narrowing, the 4-hour cycle begins to release volatility, and the moving averages along with the Bollinger Bands continue to suppress the price.
Therefore, the market is getting closer to a true trend change node.
Even in the short term, if a rebound occurs, it will pay more attention to the pressure in the $64,000—$64,200 area.
If $63,200 is lost after the third test, then the next phase will focus on around $62,500.
If $63,200 continues to hold and quickly reclaims above $63,600 or even $64,200, then the current bearish judgment will need to be reassessed.
Currently, it is advisable not to chase up, nor blindly chase down; waiting for effective breakouts of key positions and confirmations of closing in cycles remains the relatively more prudent approach.
Daily sharing real-time trading strategies, providing free position diagnostics, ideas for minimizing losses, and market practical tips, scan to follow the public account“Bitcoin Watermelon”, join the community for strategies!

免责声明:本文章仅代表作者个人观点,不代表本平台的立场和观点。本文章仅供信息分享,不构成对任何人的任何投资建议。用户与作者之间的任何争议,与本平台无关。如网页中刊载的文章或图片涉及侵权,请提供相关的权利证明和身份证明发送邮件到support@aicoin.com,本平台相关工作人员将会进行核查。