Academician of the Coin Circle: On August 12, Ethereum (ETH) fluctuated and tested the bottom, hiding mysteries. Is a major trend reversal window approaching? Latest market analysis reference
The current price of Ethereum is 1862, unable to rise and also not falling, those going long fear a pullback after a rise, while those going short fear a sudden rebound, being washed back and forth makes it uncomfortable. Many people always think about catching a big trend, but the current market is precisely a frustrating range-bound scenario, where chasing rises and killing drops easily leads to being hit on both sides. In fact, there's no need to always fantasize about a big market move overnight; understanding key support and resistance and putting risk control first can help find a suitable trading rhythm even in a ranging market. There's no need to frequently stare at the market and repeatedly operate; wait for the right opportunity at key positions before acting. It’s better to miss a chance than to make a mistake; maintaining your trading rhythm amidst chaotic market conditions is more important than betting on direction.
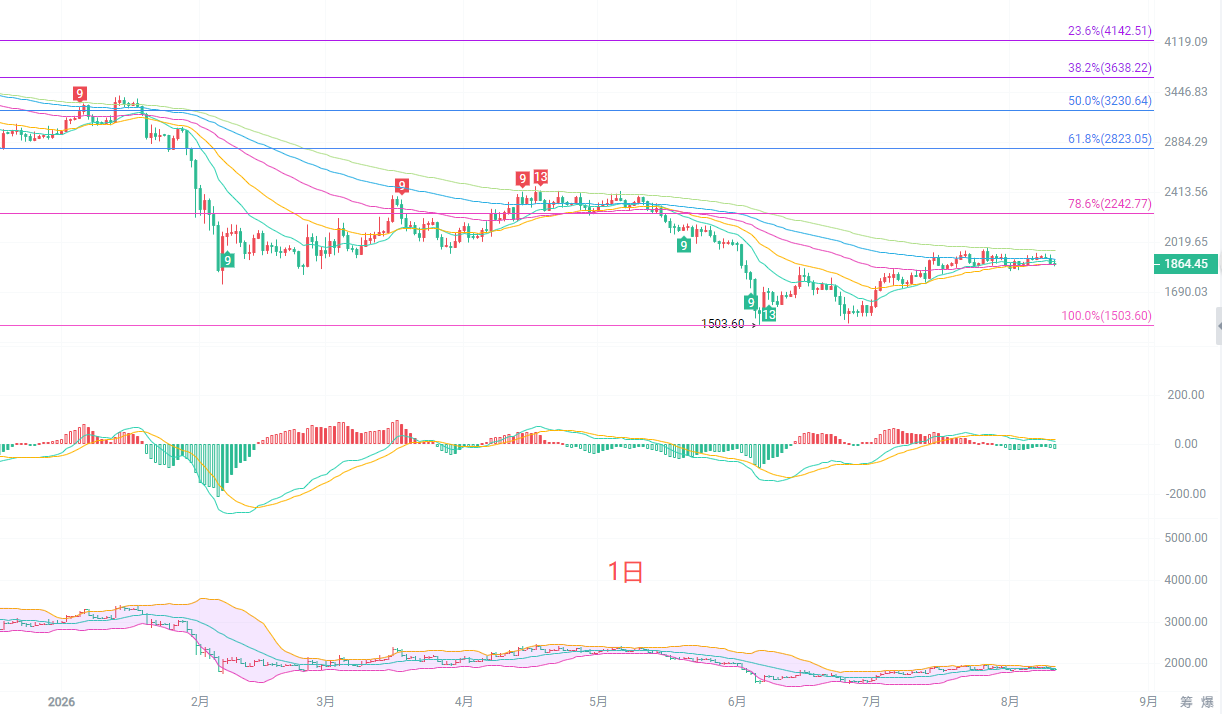
The daily candlestick is in a recovery phase, currently operating in the middle to lower range of the Bollinger Bands. Multiple EMA moving averages are diverging downwards, and the medium-term bearish pattern has not been completely reversed. The MACD indicator's DIF and DEA are flattening below the zero axis, with long and short momentum balanced and no clear directional signal. The Fibonacci 78.6% position at 2242 is strong resistance above, while 1503 below serves as support for this round's low point. Until an effective breakout is completed on the daily chart, it is still defined as a consolidation phase after a significant drop, and a stable hold above 1900 is required for further rebound space to open up.
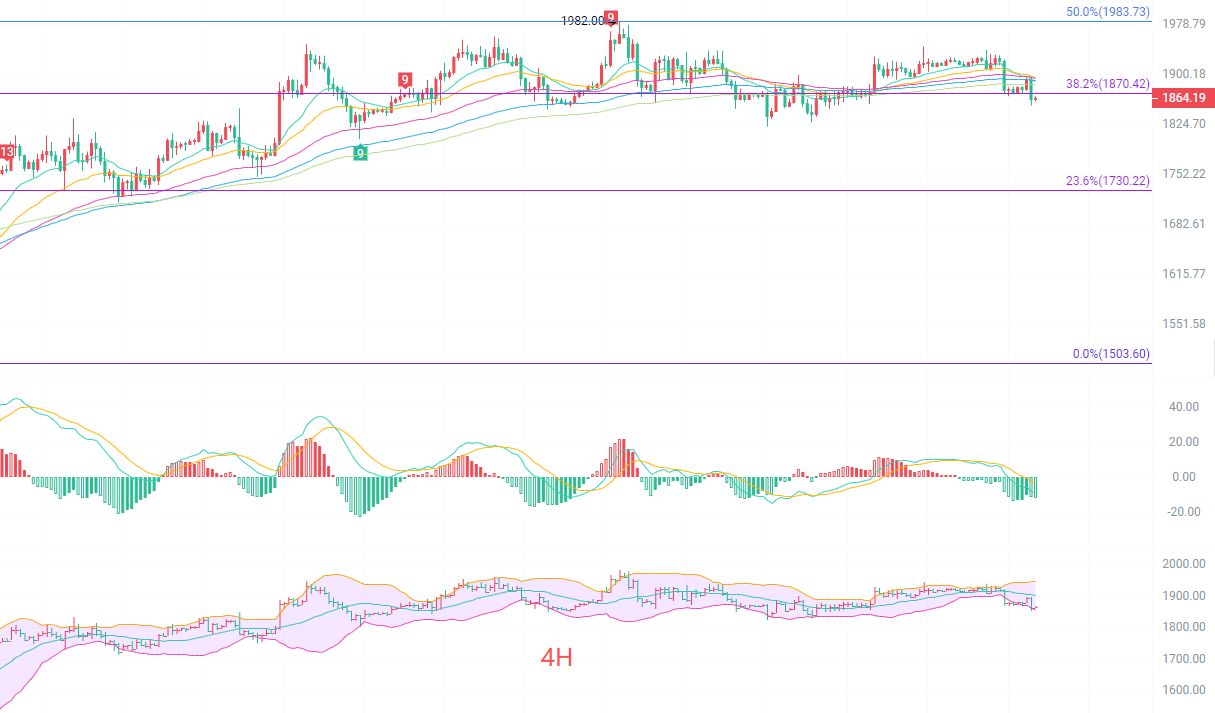
The four-hour candlestick shows that the short-term bullish strength is beginning to weaken as it tests the lower end of the moving averages. The Bollinger Bands are narrowing, with the upper band at 1946 and the lower band at 1856, with prices approaching the lower band. The MACD indicator has formed a dead cross downwards, and short-term bearish momentum is being released. The Fibonacci 38.2% position at 1870 has been pierced by the price and has turned from support into resistance; below, the 23.6% corresponding to 1730 is an important defensive support. The four-hour level is currently in a relatively weak range, with a large accumulation of trapped selling pressure in the 1900 to 1930 range. If it cannot quickly regain above 1870, it will continue to test the support below in the short term.
Short-term reference:
If the price does not break below 1850 to 1800, go long, stop loss at 1770, target at 1900 to 1950.
If the price does not break above 1930 to 1960, go short, stop loss at 1990, target at 1890 to 1850.
Specific operations should rely on real-time market data for more information; details can be consulted with the author. There may be delays in the publication of the article, hence suggestions are for reference only, and risks are borne by the reader.

Warm reminder: The above content is solely created by the author of the public account. The advertisements at the end of the article and in the comments section are unrelated to the author. Please discern carefully; thank you for reading.
免责声明:本文章仅代表作者个人观点,不代表本平台的立场和观点。本文章仅供信息分享,不构成对任何人的任何投资建议。用户与作者之间的任何争议,与本平台无关。如网页中刊载的文章或图片涉及侵权,请提供相关的权利证明和身份证明发送邮件到support@aicoin.com,本平台相关工作人员将会进行核查。