
Author: Huo Huo, Rhythm
In the last week of July, the AI-themed fund Situational Awareness sold most of its publicly traded stocks to the large hedge fund Citadel. An investor letter seen by Reuters on July 31 showed that the fund's portfolio value fell by 67% that month.
Five days later, according to investor information quoted by Reuters on August 5, Citadel's equity-focused fund rose by 14.2% in July. In the same round of AI stock pullbacks, one fund deleveraged under financing pressure while another took over some of the public positions.
This statement is only half true. In the return report for July, there are systematic products that recorded positive returns, as well as samples that adjusted positions after technology holdings declined. Putting them all under the term "quantitative" will actually lose the most important distinctions.
Does this wave of increase represent the quantitative industry?
According to Business Insider, the products mentioned come from five managers. The seven systematic products listed are merely a limited return sheet, not a census of the quantitative industry.
On this small list, the quantitative investment institution Renaissance Technologies' Renaissance Institutional Equities, abbreviated as RIEF, rose by 9.2% in July. Among the products listed in the same report, Qube's Torus strategy was the only one that recorded a decline. The neat blue bars in the chart cannot conclude for the entire industry.
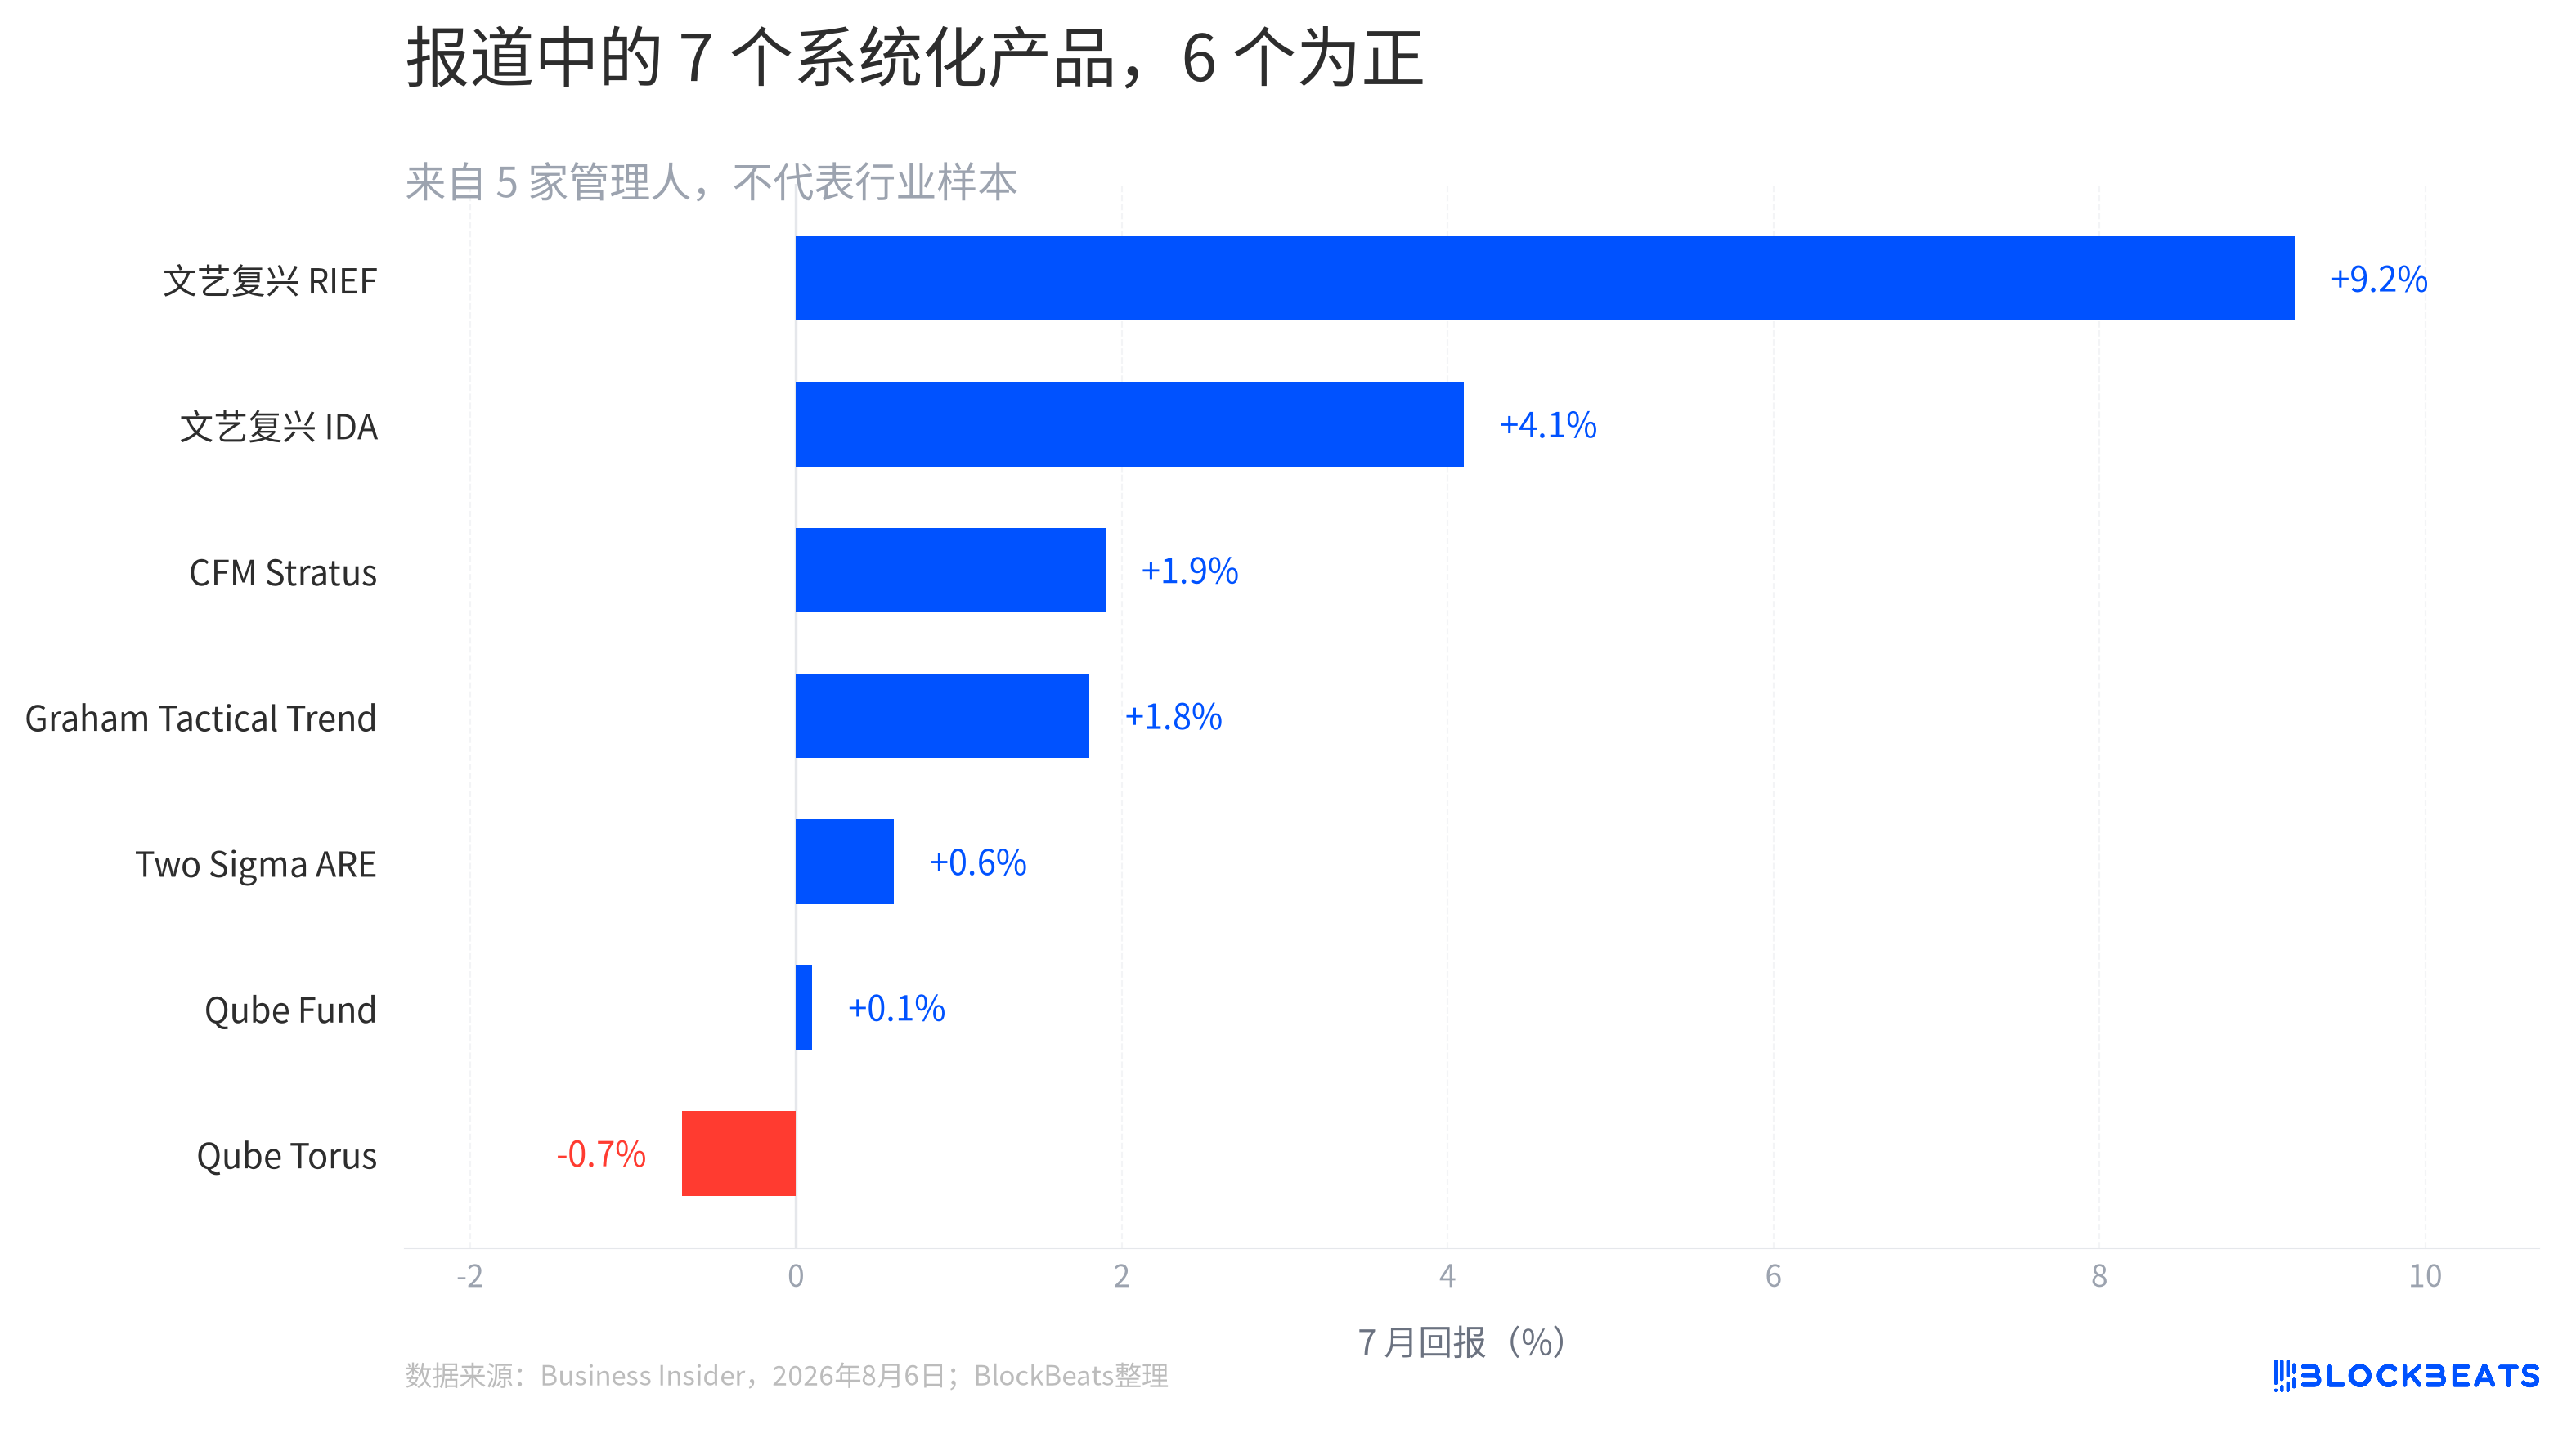
The truly useful part of these numbers is pulling "quantitative" back from an abstract label to specific products. RIEF, Renaissance Technologies' Institutional Diversified Alpha, and Two Sigma's Absolute Return Enhanced are not disclosed in terms of models, asset scope, and risk budgeting in the media report. What outsiders can see are the monthly returns cited by the media.
Monthly positive returns cannot automatically translate to "machines understand the market better." It only indicates that these systems recorded positive returns during that month.
In the same month, classification indices were also splitting
In Business Insider's multi-strategy fund scorecard, most products saw losses in July. However, estimates from hedge fund data platform BarclaysHedge show that the multi-strategy classification index rose by 0.60% during the same period. The two readings do not contradict each other; they draw from different samples and have different statistical criteria.
The numbers on the BarclaysHedge page only cover data that had been reported at that time; subsequent funds will continue to report and will still adjust. It is more suited to answer "which type of strategy faced pressure," not to label a particular private equity fund.
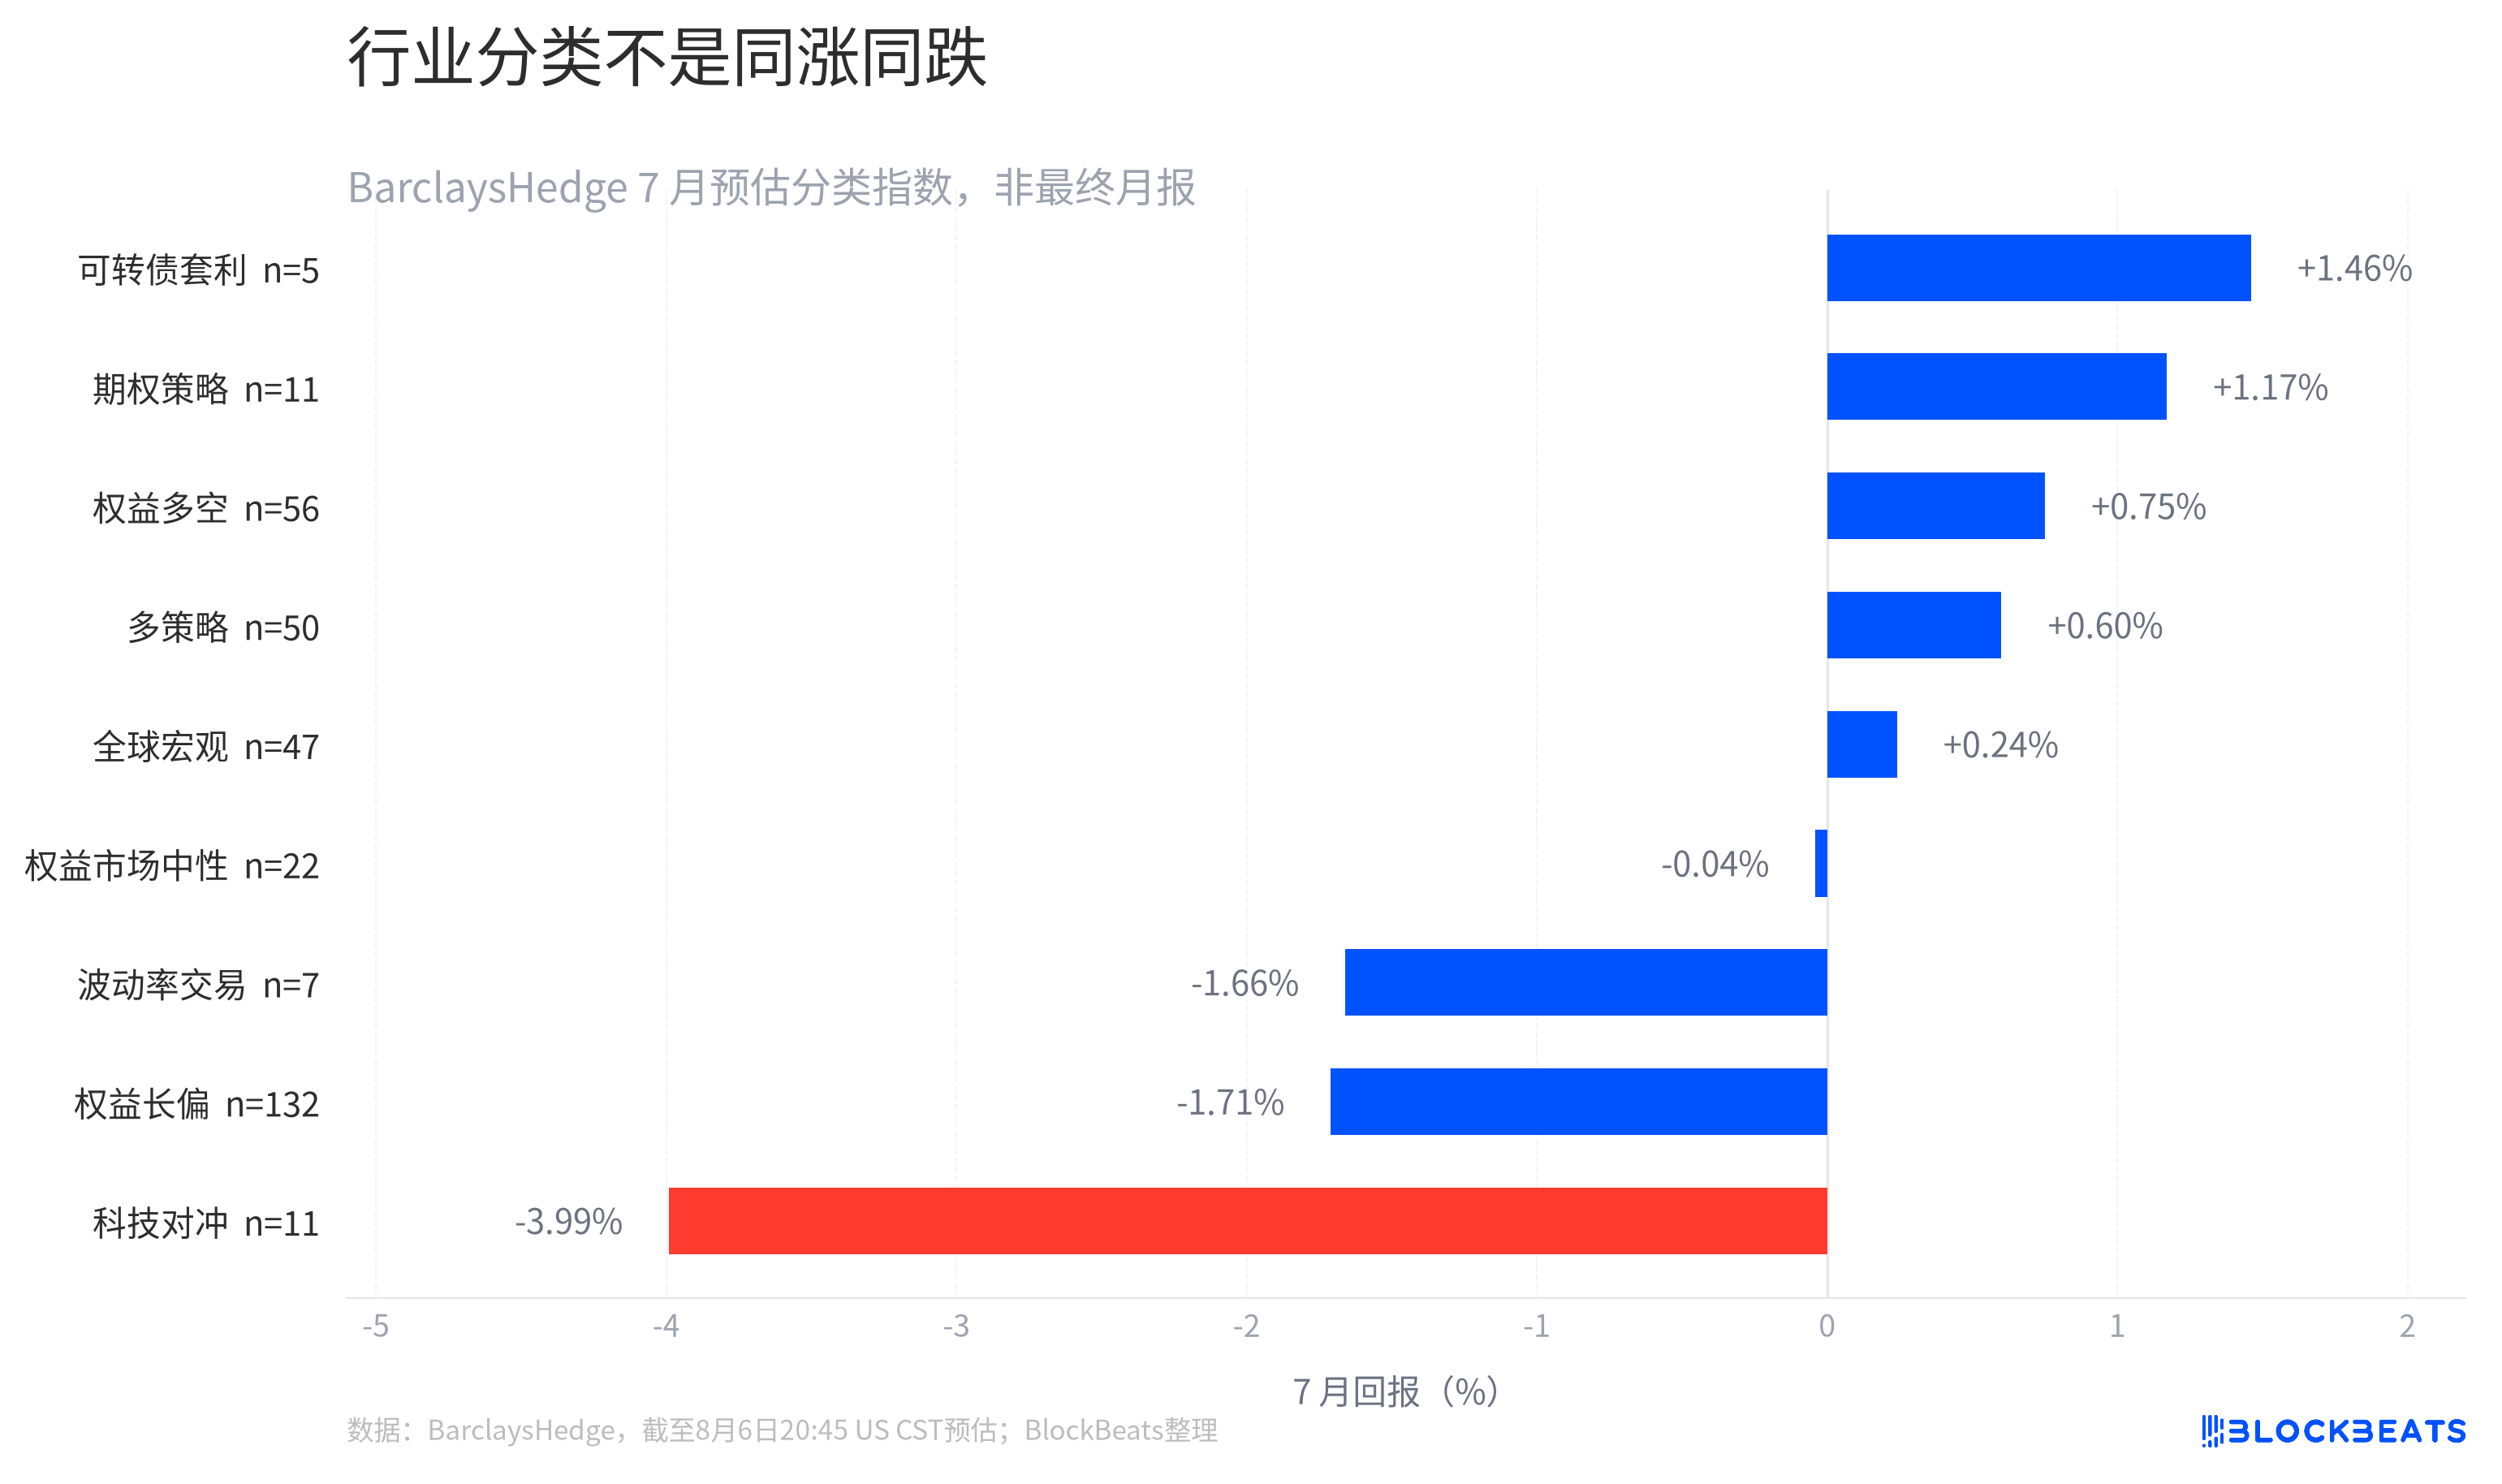
According to BarclaysHedge's estimates, the technology hedge classification index fell by 3.99% in July, while convertible bond arbitrage rose by 1.46%. Within the same month, there were significant differences in the monthly performance of classifications such as equity long bias and convertible bond arbitrage. This classification table reminds readers that each return must be interpreted within the specific strategy label.
This also explains why "multi-strategy generally stalls" cannot be oversimplified. Business Insider's sample has its news value, and BarclaysHedge's index has its scope of coverage. Both should be understood within their respective boundaries.
Is a monthly surge the same as year-to-date performance?
Not necessarily. According to Business Insider, RIEF's performance in July was the most notable, but its year-to-date return until the end of July was only 4.5%. The report described this wave of increase as compensating for the losses of the previous six months.
The same report also indicated that Graham Capital's Tactical Trend strategy had a year-to-date return of 23.7%, but its monthly increase was not as striking as RIEF’s. Although Qube's Torus strategy declined that month, its year-to-date return was still about 18%. When monthly rankings and year-to-date rankings are displayed on one chart, the positions quickly change.
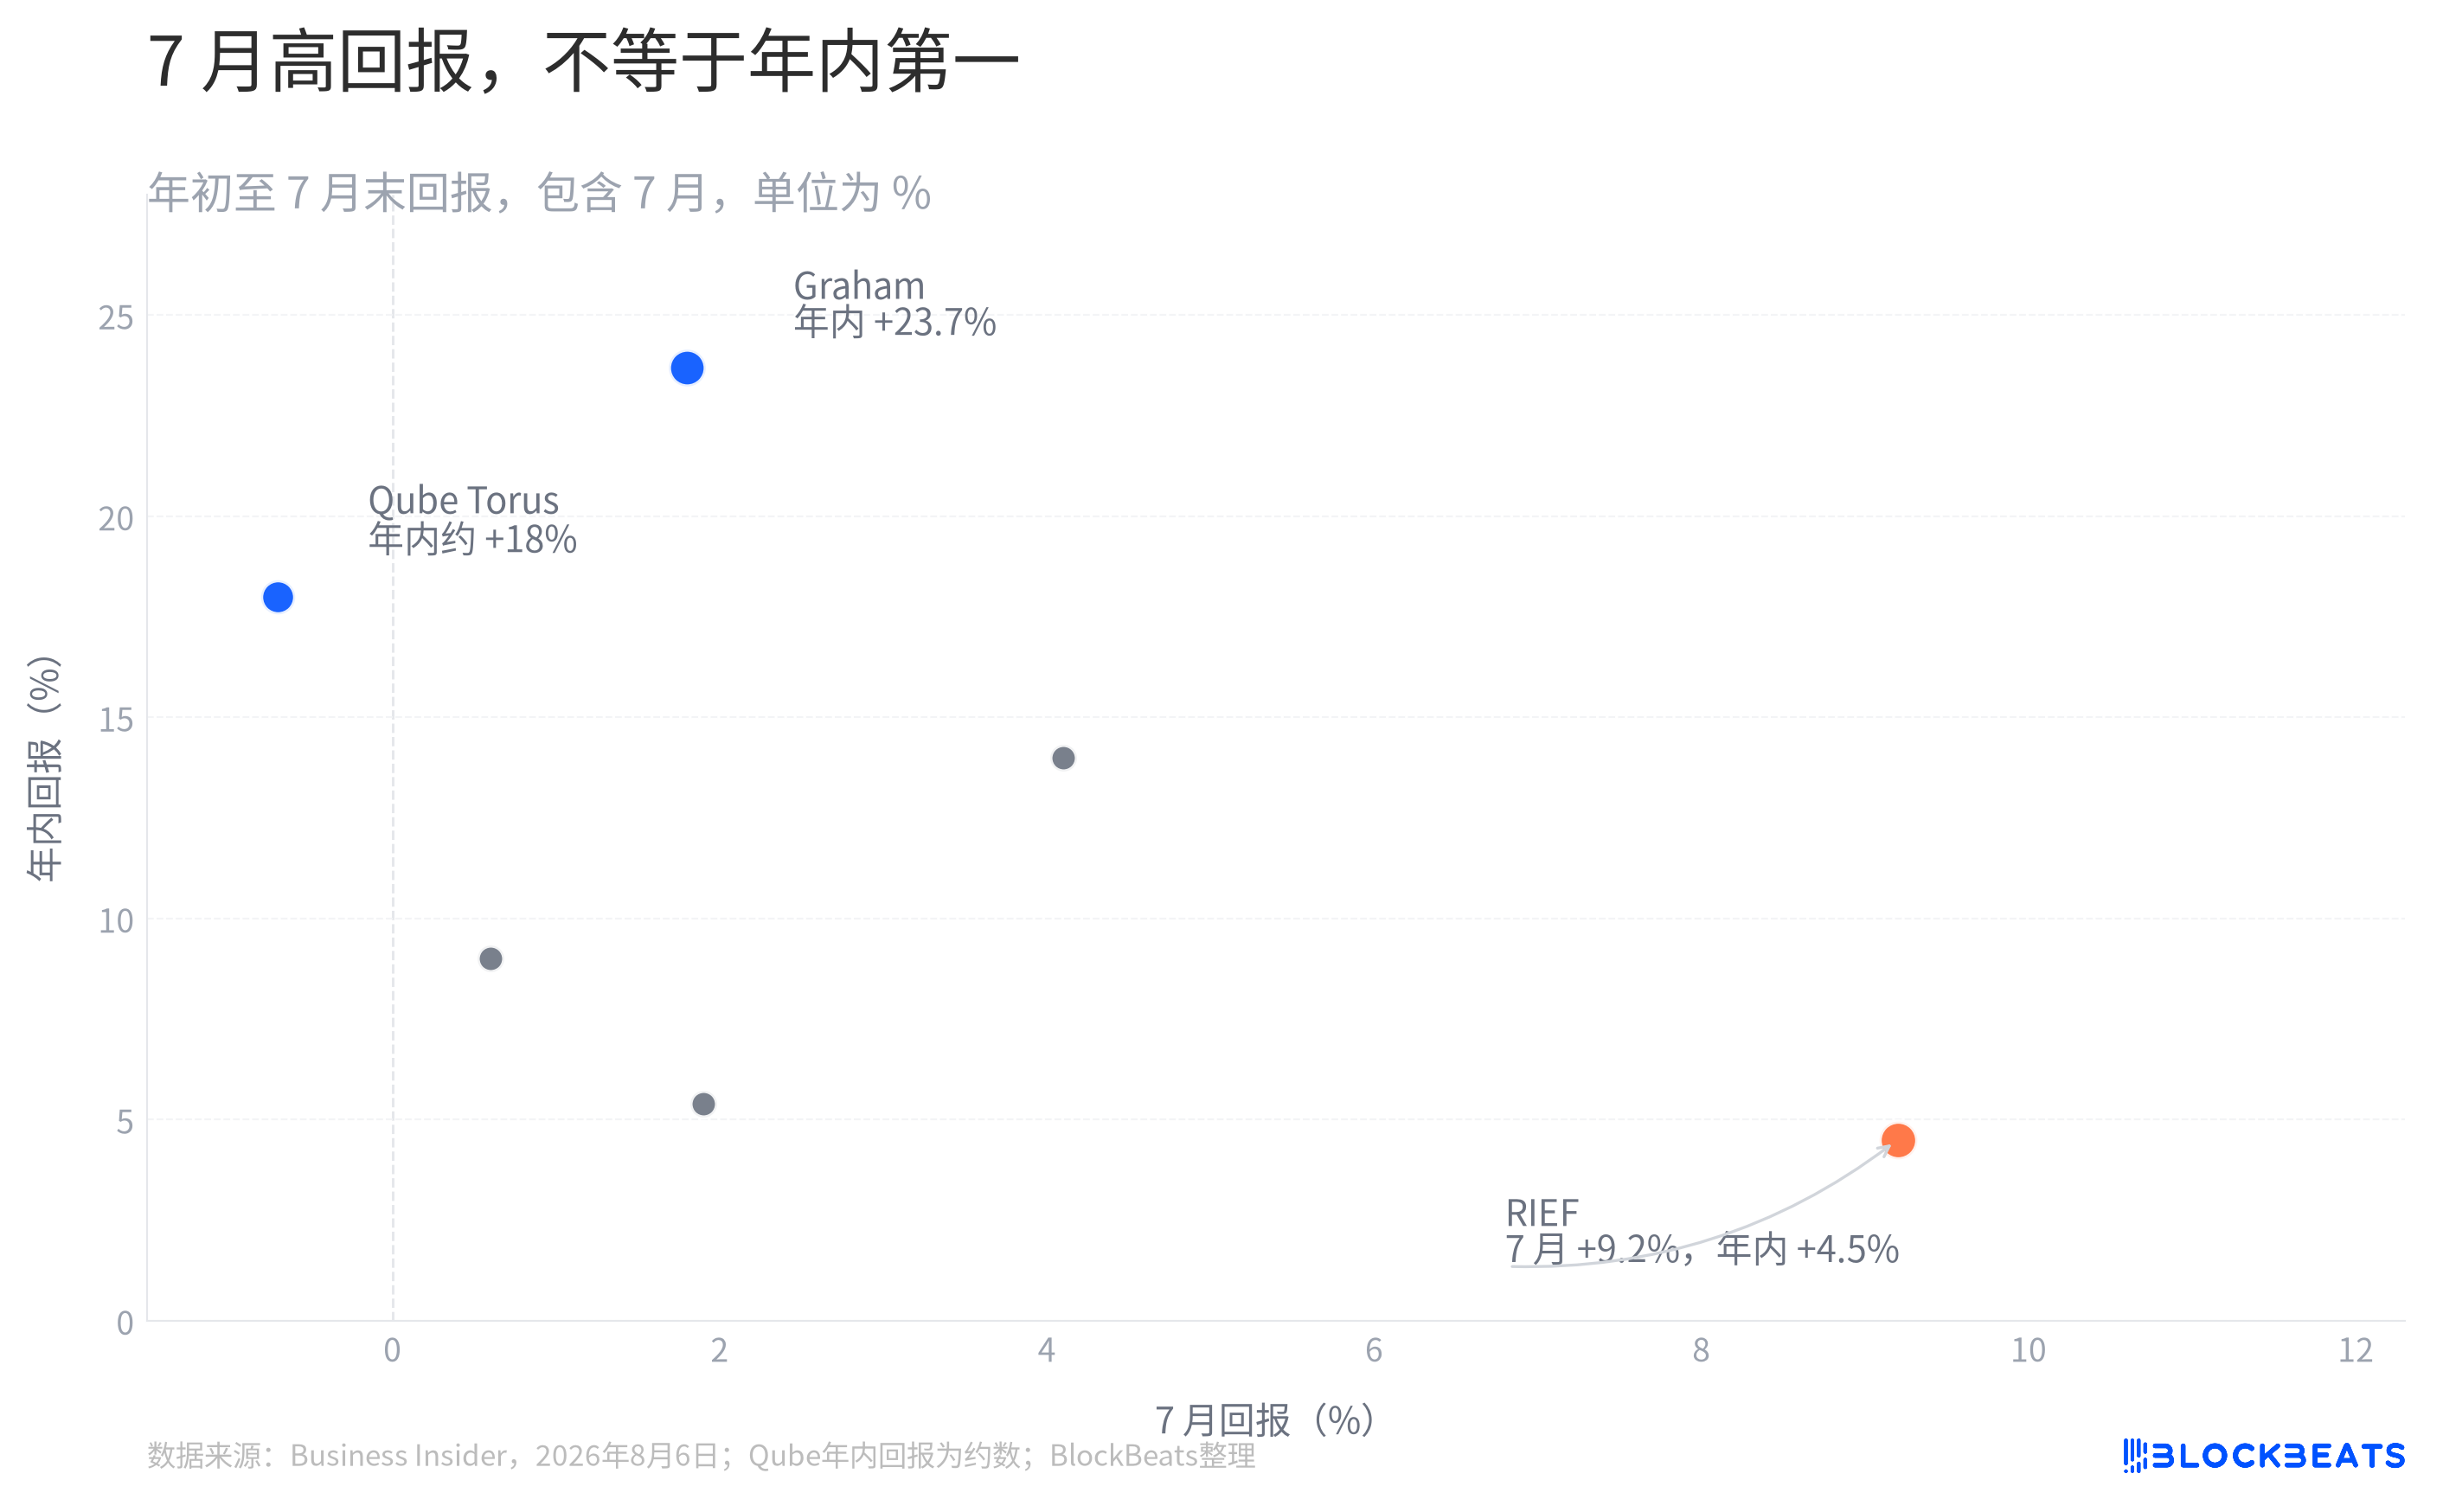
This chart does not prove that the two sets of numbers are independent of each other. The returns from the beginning of the year to the end of July inherently include July's performance. It only serves to remind readers that monthly rankings are like snapshots; when the lens is lengthened, the trends and rankings can morph together.
Beyond the rankings, there is an asset sale
Reuters reported on July 31 that Situational Awareness, after experiencing an AI stock pullback and deteriorating liquidity, sold most of its publicly traded stocks and stated that it has removed portfolio leverage. The report did not confirm whether it had received a formal margin call, so a more cautious interpretation is that it's a deleveraging under financing pressure.
According to a Reuters report on August 5, Citadel took over some of the public positions at a discount of over 10%. This sale occurred in the same month, while according to investor information cited by Reuters, Citadel's equity-focused fund rose by 14.2% in July.
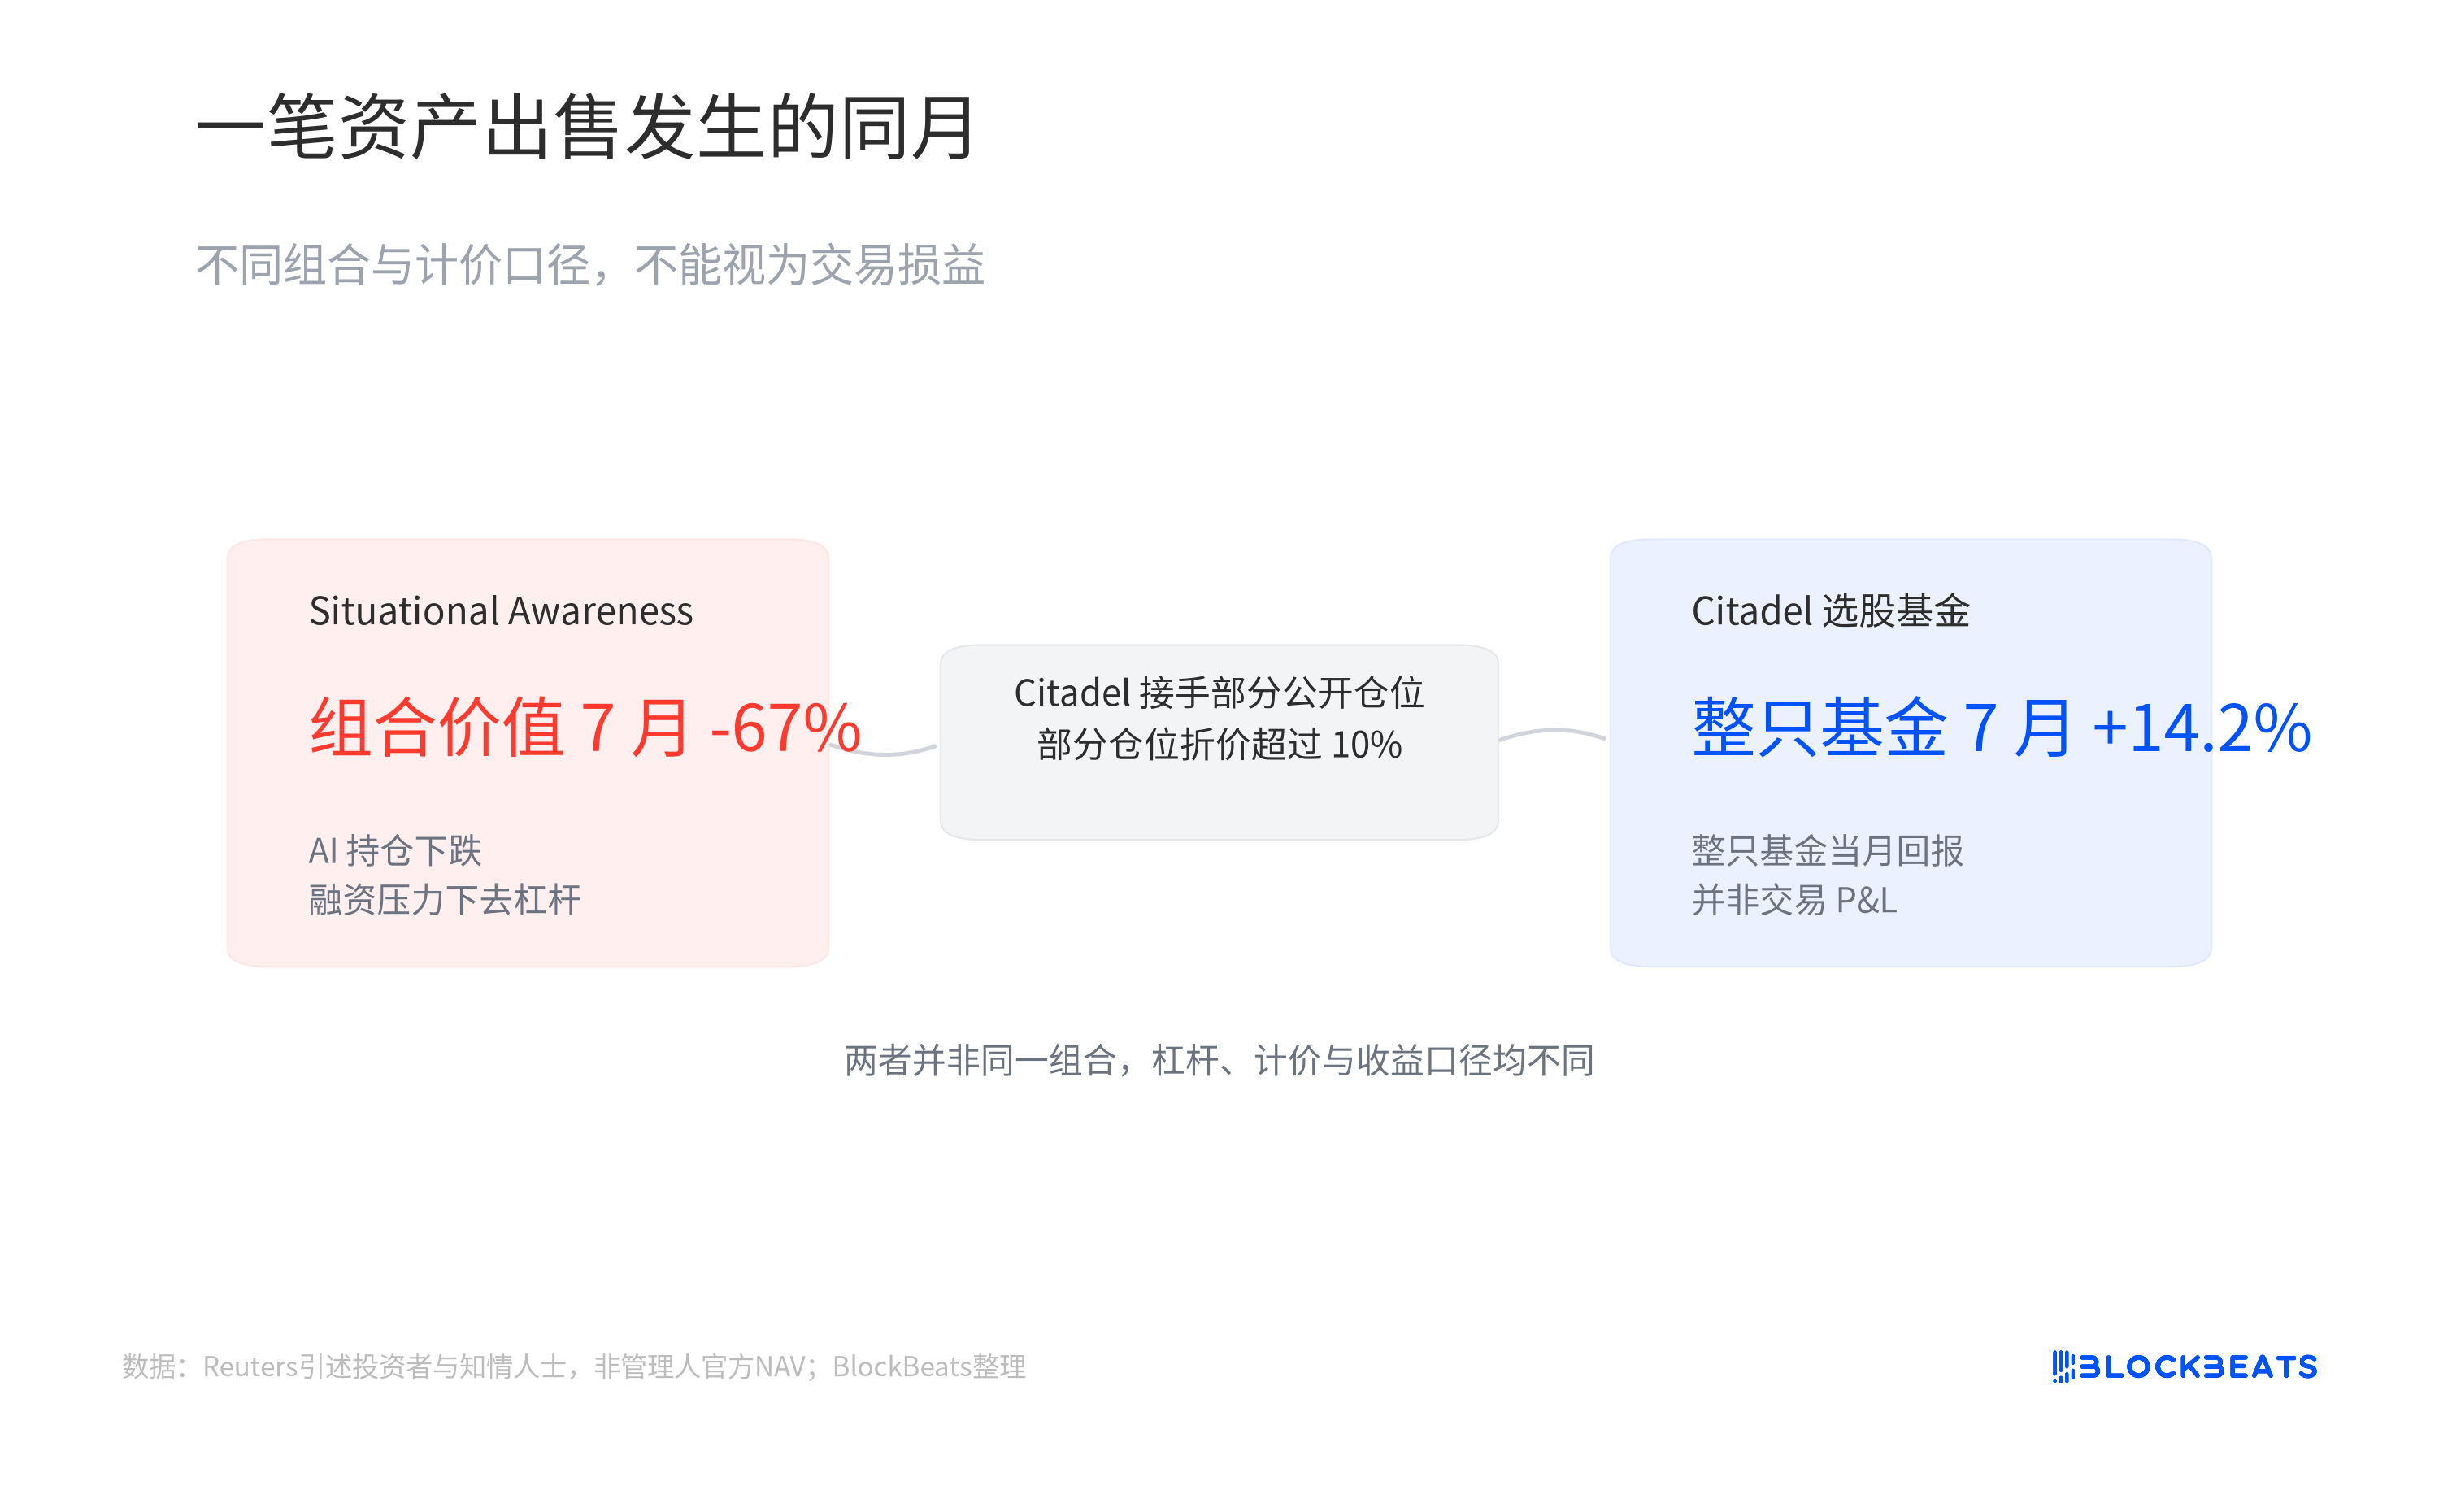
The two figures cannot be subtracted to represent a profit from a transaction. Situational Awareness disclosed changes in portfolio value, while the figures reported by the media regarding Citadel represent the monthly performance of an entire fund, with differences in positioning, leverage, and valuation criteria. Including this footnote in the chart is closer to the event itself than portraying this asset disposal as a miraculous arbitrage.
Breaking down this return sheet, the differences between systematic trading, position direction, and financing methods may present as different returns within the same fluctuation.
免责声明:本文章仅代表作者个人观点,不代表本平台的立场和观点。本文章仅供信息分享,不构成对任何人的任何投资建议。用户与作者之间的任何争议,与本平台无关。如网页中刊载的文章或图片涉及侵权,请提供相关的权利证明和身份证明发送邮件到support@aicoin.com,本平台相关工作人员将会进行核查。


