Crypto Circle Academy: Bitcoin (BTC) at 8.1 has a continuous narrowing warning on Bollinger Bands, how should we position ourselves at the end of this volatility? Latest market analysis and operational advice.
Bitcoin is currently priced at 63000, the volatility is exhausting; it can't push up and it doesn't fall deeply. Holding onto long positions feels risky due to potential pullbacks, while placing short positions brings worries of sudden surges. Many people always want to catch a massive trend, but overlook the current core state of the market: the power of bulls and bears has entered a brief equilibrium range. After a long-term low rebound, Bitcoin has entered a consolidation phase, with no clear short-term direction. Frequent buying and selling can easily lead to repeated losses. The hardest part of trading is not capturing significant rises or falls, but understanding the volatility pattern and exercising restraint. Don't let short-term price spikes disrupt your pace; first, identify key support and resistance levels, then develop corresponding operational strategies. Blindly chasing trades will only continuously deplete your capital.
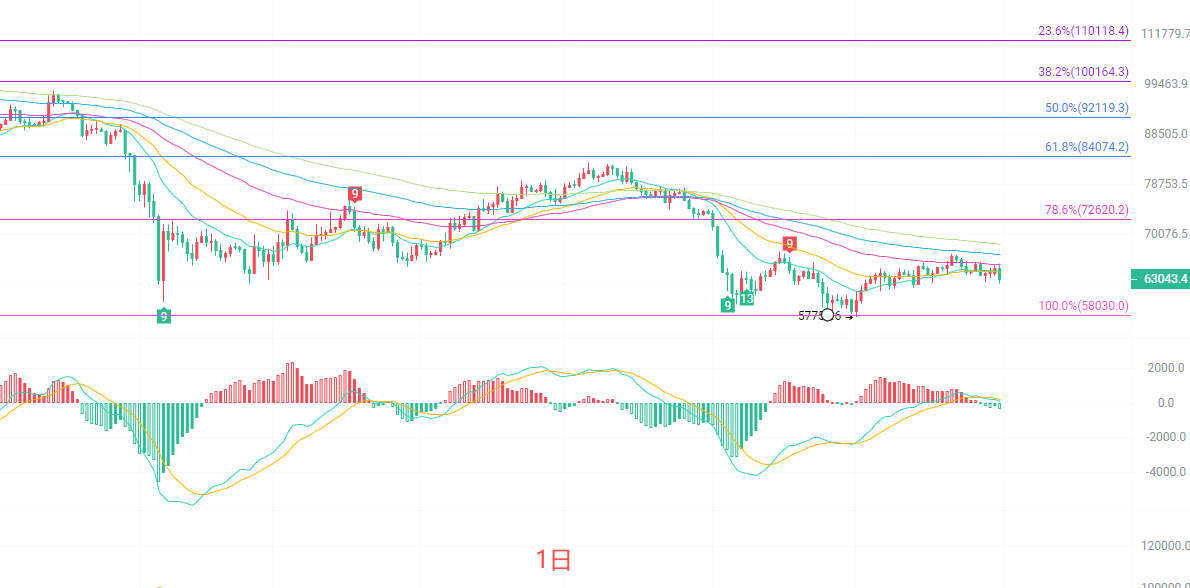
The daily K-line operates below the EMA15 and EMA30 moving averages; the medium-term moving averages are forming resistance. The first short-term resistance is near 64200. The Bollinger Bands are continuously narrowing, indicating that a directional choice will soon come. The MACD red bars are continuously shrinking, and the DIF shows signs of turning downward, with bullish momentum gradually weakening. The primary support below is at 62400, with strong support at 60500. The daily level is currently in a post-rebound correction phase. Before an effective breakthrough at 64200, it is difficult for the bulls to reopen upward space, so aggressive long positions are not advisable.
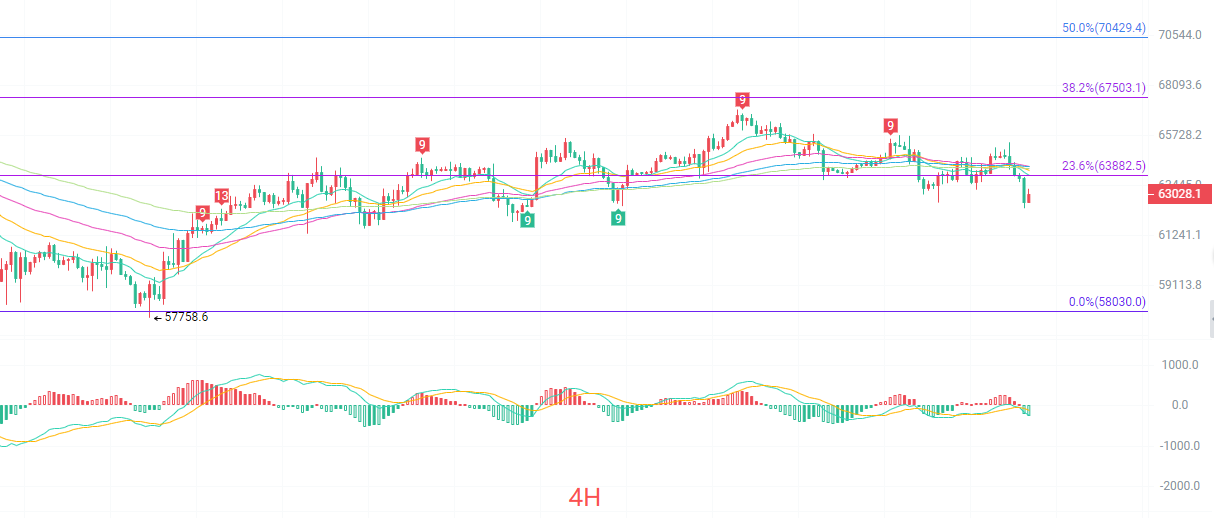
The four-hour K-line has broken below the short-term moving average cluster, and the moving averages are starting to turn, forming resistance at 63800-64000. The Bollinger Bands channel is slightly narrowing downward, with prices approaching the lower band looking for support. The MACD dual lines are turning downward, and the green bars are beginning to expand, indicating a slight advantage for short-term bears. Key resistance above is at the Fibonacci 23.6% level at 63880. Support first looks at 62600; if this support is broken, the market will further test the 62000 level. The short-term trend is weak and volatile; rebounds represent opportunities to short under pressure; directly chasing shorts carries high risk; waiting for a rebound to make a move is safer.
Short-term reference:
If the price stays above 62500 to 62000, go long with a stop loss at 61500, aim for 63500 to 64500.
If the price stays below 63800 to 64200, go short with a stop loss at 64600, aim for 63000 to 62500.
Specific operations should primarily rely on real-time market data, for more details and information, please consult the author. The publication of this article may be delayed; advice is for reference only; risks are to be borne by the reader.

Warm reminder: The above content is solely created by the author of this public account; advertisements at the end of the article and in the comments section are unrelated to the author. Please discern carefully. Thank you for reading.
免责声明:本文章仅代表作者个人观点,不代表本平台的立场和观点。本文章仅供信息分享,不构成对任何人的任何投资建议。用户与作者之间的任何争议,与本平台无关。如网页中刊载的文章或图片涉及侵权,请提供相关的权利证明和身份证明发送邮件到support@aicoin.com,本平台相关工作人员将会进行核查。