Cryptocurrency Scholar: The low-level repair of Ethereum (ETH) on 8.1 is not a reversal, and the pressure zone should not be underestimated? Latest market analysis reference
The current price of Ethereum is 1870. Buying long has risen and fallen, while shorting hasn't dropped deep, triggering stop losses back and forth. Many friends are starting to feel anxious and frequently changing directions, ultimately leading to a continuous shrinkage of their principal. The current market has not shown a one-sided drive; essentially, it is a range-bound oscillation. Do not pursue highs and lows with a one-sided mindset. Frequent trading is the biggest taboo in oscillation markets; patience is key to waiting for key support and pressure levels before re-engaging, capturing higher certainty opportunities. The market will not always present opportunities; learning to wait and manage hands is essential to maintain profits amidst the back-and-forth market.
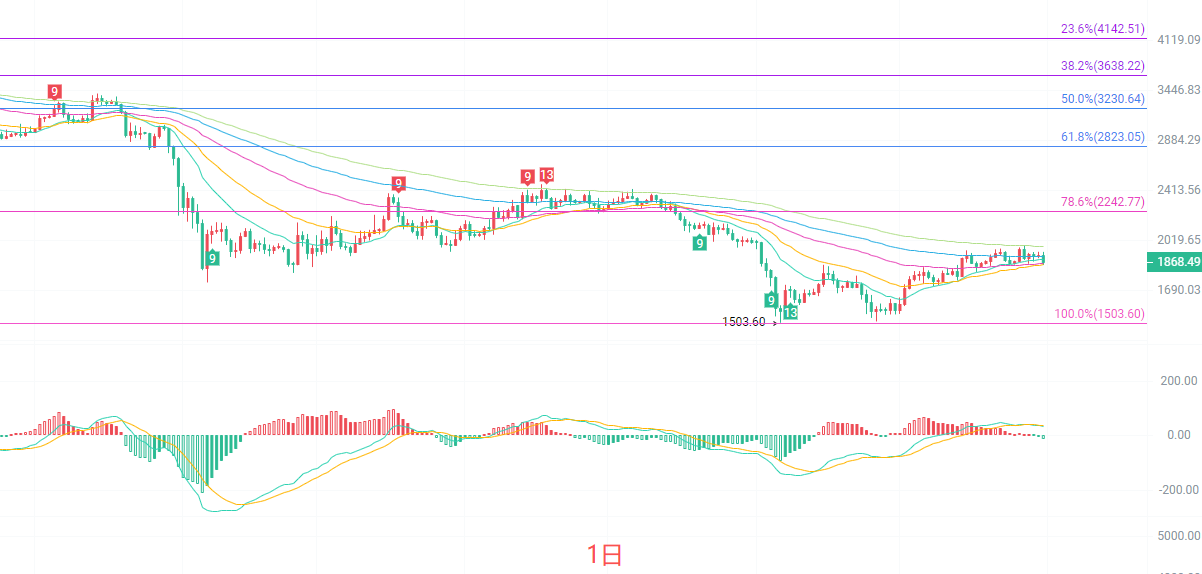
The daily candlestick is currently in the bottom repair stage. Prices are under pressure, operating below the upper Bollinger Band of 1967. The medium to long-term EMA moving averages are still in a bearish arrangement, with strong pressure above at 1909 and 1976. The MACD indicator's DIF is flat against the DEA, with both long and short momentum balanced and no obvious volume signal present. The daily level bounce has not yet formed a reversal structure, belonging to a repairing oscillation after a big drop. Only a breakout above 1967 can open up upward space, while key support below is at 1799. Once this level is lost, the rebound structure will be damaged.
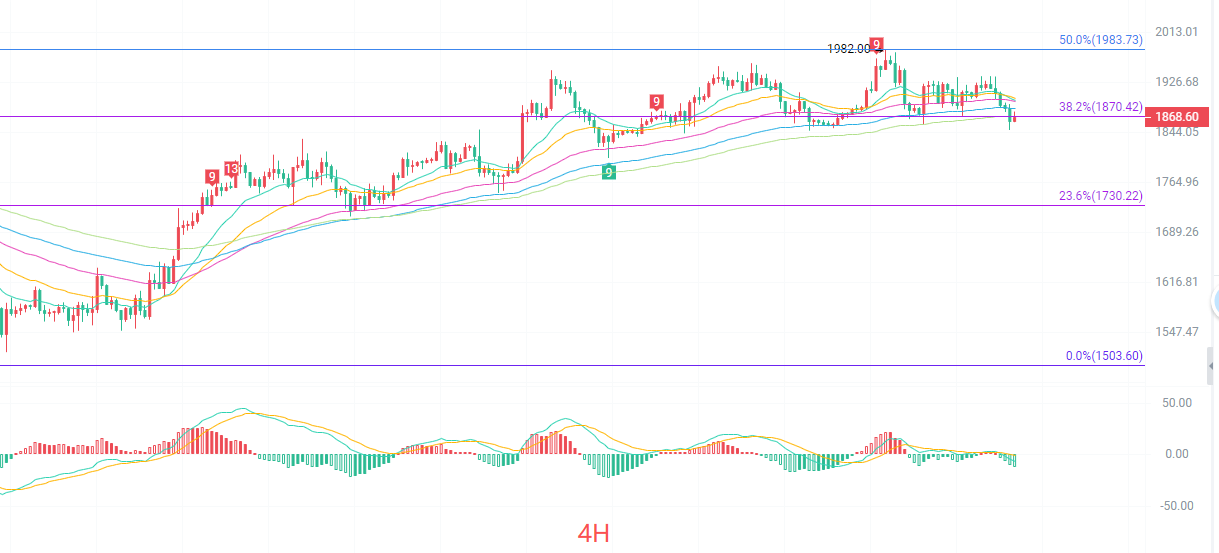
The four-hour candlestick Fibonacci 38.2% pressure level is at 1870, and the current price is exactly under this position. The moving average system is starting to intertwine, and the short-term trend is entering a decision window. The Bollinger channel continues to narrow, indicating that a directional choice is approaching. The MACD red bars are gradually shrinking, with bullish power waning. The first support below looks at the EMA120 moving average at 1869, and then 1833. If it stabilizes above the 1870 pressure, bulls will have the opportunity to test the previous high of 1982; persistent pressure will lead to a re-test of the moving average support area below.
Short-term reference:
If the lower range of 1800 to 1850 does not break, aim upwards, stop loss at 1760, target at 1880 to 1920.
If the upper range of 1980 to 2020 does not break, aim downwards, stop loss at 2050, target at 1930 to 1890.
Specific operations should focus on real-time market data. For more information details, you can consult the author. This article may have a delay in publication; it is suggested for reference only and risk is borne by yourself.

Gentle reminder: The above content is solely created by the author of the public account. Any advertisements at the end of the article or in the comment section are unrelated to the author. Please discern carefully. Thank you for reading.
免责声明:本文章仅代表作者个人观点,不代表本平台的立场和观点。本文章仅供信息分享,不构成对任何人的任何投资建议。用户与作者之间的任何争议,与本平台无关。如网页中刊载的文章或图片涉及侵权,请提供相关的权利证明和身份证明发送邮件到support@aicoin.com,本平台相关工作人员将会进行核查。