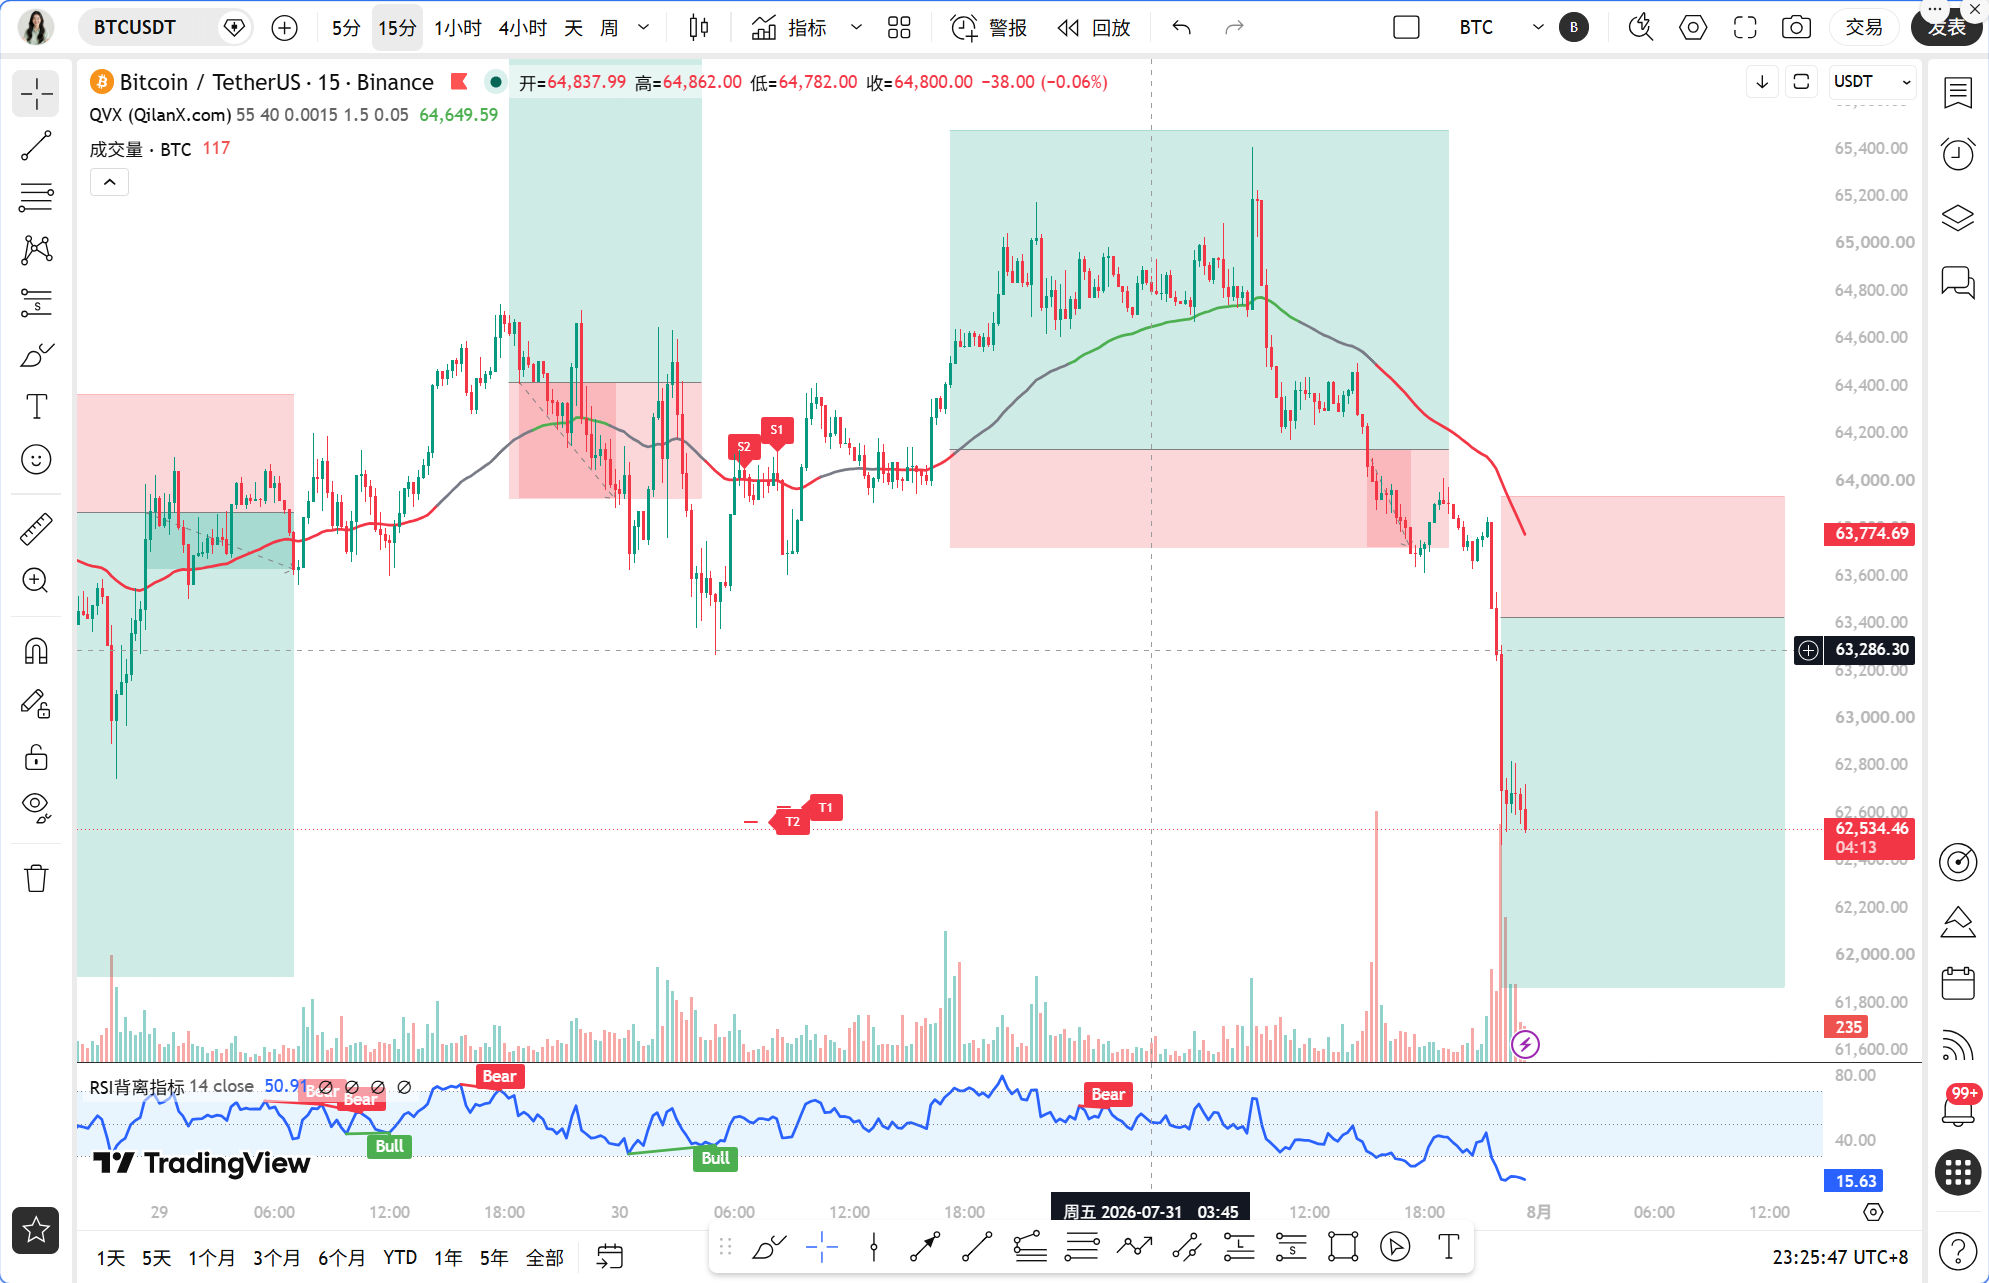
Tonight's market conditions are once again being pressed down by news. Federal Reserve official Kashkari came out hawkish, saying that inflation risks are solidifying and leaning towards gradually tightening policy. Once this statement was made, risk assets immediately faltered. Soon after, there were reports from the Bank of Japan that it may raise interest rates in September or October, causing panic emotions to heat up again over unwinding carry trades. A more direct bearish signal was a giant whale transferring five hundred BTC to Binance, with potential selling pressure hanging like a sword above. With these three bearish signals stacking up, Bitcoin plunged directly from above 64,000, now reported at 62,500, with a 24-hour drop of over 3%. The big question tonight is whether this level can be maintained.
Currently, the BTC price is reported at 62,500 USDT, with time frozen at the late night of July 31. From an hourly perspective, the price has completely broken through all short to medium-term moving averages, with MA5, MA10, and MA30 all in a bearish arrangement, the MACD double lines deeply diverging below the zero axis, and the RSI indicator at 12.34, having entered the extreme oversold area. Such extreme readings often correspond to the brewing of short-term rebounds in history, but before a trend reversal occurs, bottom hunting and catching falling knives are only a hair's breadth apart.
Looking at the multi-timeframe states, the daily MACD histogram is still shortening, but both DIF and DEA are above the zero axis, indicating that the mid-term bullish structure is not completely destroyed, only that momentum has slumped significantly. The RSI is reported at 43.76, which is in a neutral to weak area. The four-hour chart looks even worse, with the MACD just forming a death cross, the histogram's negative value expanding, and the RSI at 28.84, having entered the oversold area. The one-hour level is even more dismal, with the MACD double lines deeply plunging, and the RSI at 12.34, reflecting extreme oversold conditions. The fifteen-minute RSI is also hovering around 12.55, with short-term technical demand for a rebound after overselling, but the rebound strength is in doubt.
Using the Qinglan TPV system to verify the current signals. The core rule is that the 1-hour EMA55 serves as the dividing line between bullish and bearish, with the current EMA55 at 64,072 and the price at 62,500, clearly in the bearish trend zone. Of the past eight one-hour candlesticks, the number of times the closing price has risen above EMA55 is zero, and the number of times it crossed is also zero, making it completely inconsistent with the definition of a fluctuating range, belonging to a standard one-sided downtrend. For shorting conditions, the price has consecutively closed below the EMA55 for multiple candlesticks, satisfying the trend conditions. However, in terms of structure, the current price has strayed far from EMA55, with a range of 2.45%, so the risk-reward ratio for chasing shorts is not ideal. In terms of momentum indicators, the RSI has dropped to around 12, indicating extreme oversold conditions, and a technical rebound may occur at any moment. Therefore, the conclusion given by the TPV system is that the trend is bearish, but chasing shorts is not advisable; wait for a rebound near EMA55 before reassessing shorting opportunities, or wait for a clear bottom reversal signal before going long.
On-chain data shows that the Fear and Greed Index is at 25, which falls into the extreme fear range. This value often corresponds to stage bottom areas in history, but after extreme fear, there is also potential for even greater fear, so it cannot be solely relied upon as a basis for bottom hunting. Bitcoin's market dominance is reported at 56.1%, indicating that funds are still concentrating on BTC, and the liquidity of altcoins is worse, meaning their declines could be greater. On the news front, Circle's obtaining of a New York trust license is a regulatory positive, but has limited immediate impact on the market. The eleventh-anniversary upgrade expectations for Ethereum and news of whales staking ETH provide support for ETH, but BTC remains the current market barometer.
Regarding key support and resistance levels, the first support below is at the 62,000 psychological level, which is also a dense trading area from earlier. If it breaks below 62,000, the next support is seen around the 61,000 to 61,500 area, which is an important support zone on the daily chart. The first resistance above is around 64,000, which is the location of the 1-hour EMA55, and the second resistance is in the 65,000 to 65,500 area, which is a resistance zone after the previous level was broken. In terms of short-term operations, the 62,500 position is quite awkward, neither up nor down, where chasing shorts risks a rebound and bottom hunting risks further declines.
As for trading strategy, I provide two scenarios. The first scenario is if the price shows signs of a halt in the 62,000 to 62,500 range, such as a bottom formation appearing on the fifteen-minute level, or if the RSI recovers from the oversold area combined with the MACD histogram shortening over two consecutive lines, a small position can be tried long, entering around 62,500, with a stop-loss below 61,800, and a target at 64,000, close to EMA55, reducing positions upon reaching the target. The second scenario is if the price rebounds to the 64,000 to 64,500 range, and a top formation or long upper shadow appears, while the RSI turns down again after correcting from the oversold area, a short can be entered, with a stop-loss above 64,800, and a target at 62,000, breaking below 61,000. If the price directly drops below 62,000 with volume, don’t rush to chase shorts; wait for a bounce to confirm resistance between 62,500 to 62,800 before entering, with a stop-loss at 63,200 and a target at 61,000.
Risk warning in one sentence: under extreme oversold conditions, even the slightest change in news could trigger a violent rebound; careful consideration is needed for heavy positions.
Follow Qinglan Crypto Class for more trading opportunities! Welcome to visit the official website www.qinglan.org
📊 Qinglan TPV trading strategy backtest reference
🕒 Last backtest time 07-31 07:00:01
Total analysis: 3324 Backtest: 2538 Accuracy: 78.3% (1987/2538)
免责声明:本文章仅代表作者个人观点,不代表本平台的立场和观点。本文章仅供信息分享,不构成对任何人的任何投资建议。用户与作者之间的任何争议,与本平台无关。如网页中刊载的文章或图片涉及侵权,请提供相关的权利证明和身份证明发送邮件到support@aicoin.com,本平台相关工作人员将会进行核查。