Academician of the Currency Circle: Why has the one-sided market for Bitcoin (BTC) on July 26 not arrived? Latest market analysis and operational advice explained
Currently, Bitcoin is at 64300, many people have lost money in the fluctuations, more than in a one-sided market, not because the direction is wrong, but because the mindset is chaotic. People always want to seize every fluctuation, but the result is being slapped back and forth. In fact, the best operation during fluctuations is to control your hands and only act on signals you understand. Set stop losses properly, don’t let emotions replace judgment; the money in the currency circle can never be fully earned, but it can be completely lost. Taking it slower and steadier might actually lead you further
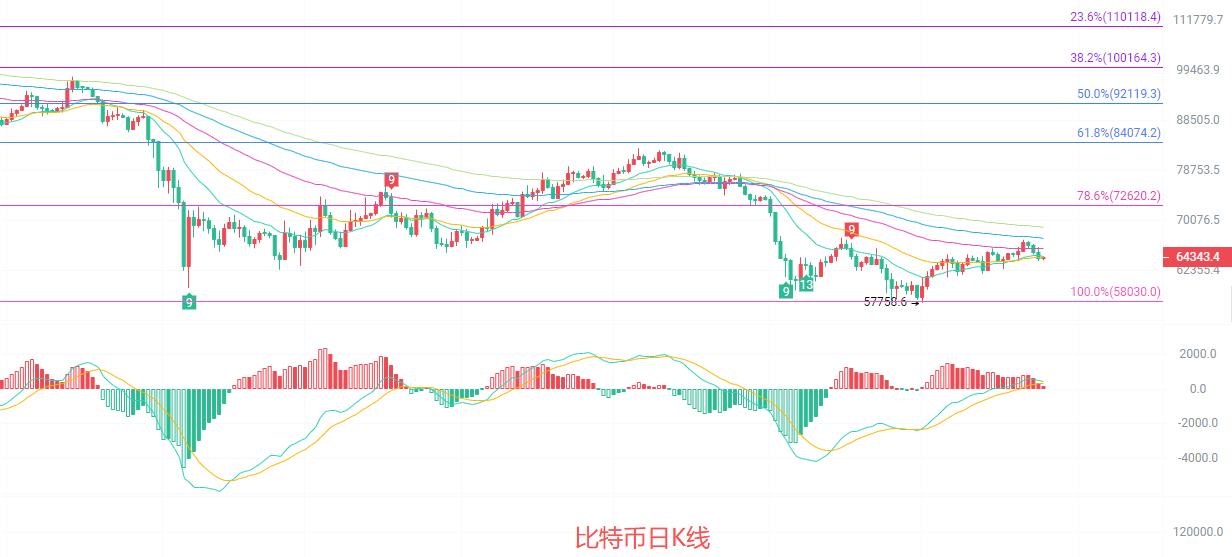
The daily K-line is running below the EMA15, sticking to the EMA30, and short-term moving averages are forming a tangled pattern, with obvious long-short divergences. The key resistance level above is the 78.6% Fibonacci retracement line at 72620, and the strong support below is the previous low at 58030. The recent price oscillates in the range of 61800-67000. In the MACD indicator, the DIF and DEA are still above the zero axis, with the red bars continuously shortening, indicating that the bullish momentum is gradually weakening; the middle line of the Bollinger Band at 64254 is basically coinciding with the current price, and the price is repeatedly testing around the middle line, lacking clear directional guidance in the short term, overall in a weak consolidation phase
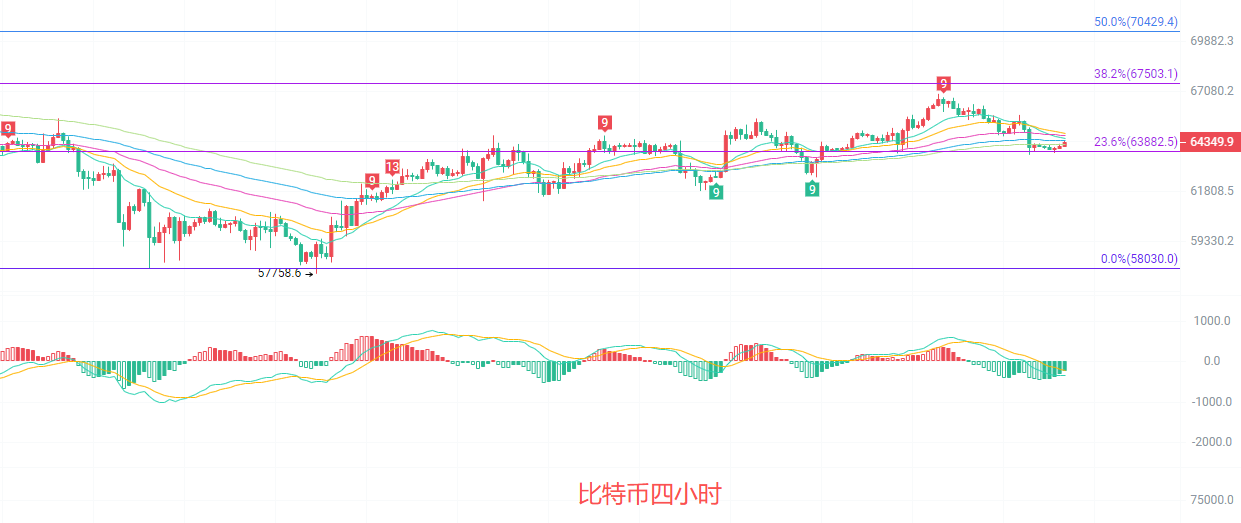
The four-hour K-line is running below the EMA15, and EMA30, EMA60, EMA90 are in a bullish arrangement but with a slowing slope, indicating an increase in short-term moving average congestion and significant oscillation characteristics. The 23.6% Fibonacci retracement line at 63882 is the current critical support below, with the price testing this position multiple times without effectively breaking down. The resistance level above is at the 38.2% retracement line at 67503. The MACD indicator shows DIF crossing below DEA, with green bars continuously expanding, and short-term bearish momentum prevailing; the middle line of the Bollinger Band at 64911 presses down, and the lower line at 63464 forms support, with the price moving between the middle and lower lines of the Bollinger Band, leaning towards weak oscillation in the short term, requiring attention to the effectiveness of the support level
Short-term reference:
If the price does not break below 64000 to 63500, target for upward movement, stop loss at 63000, target looking at 65500 to 66500
If the price does not break above 67000 to 67500, target for downward movement, stop loss at 68000, target looking at 65500 to 64500
Specific operations focus on real-time market data; for more detailed information, you can consult the author. The article is published with a delay, intended for reference only, risks are to be borne by yourself

Kind reminder: The above content is created solely by the author of the public account, and the ads at the end of the article and in the comments section are not related to the author. Please discern carefully, thank you for reading
免责声明:本文章仅代表作者个人观点,不代表本平台的立场和观点。本文章仅供信息分享,不构成对任何人的任何投资建议。用户与作者之间的任何争议,与本平台无关。如网页中刊载的文章或图片涉及侵权,请提供相关的权利证明和身份证明发送邮件到support@aicoin.com,本平台相关工作人员将会进行核查。


