ETH 1-hour level market situation objective interpretation
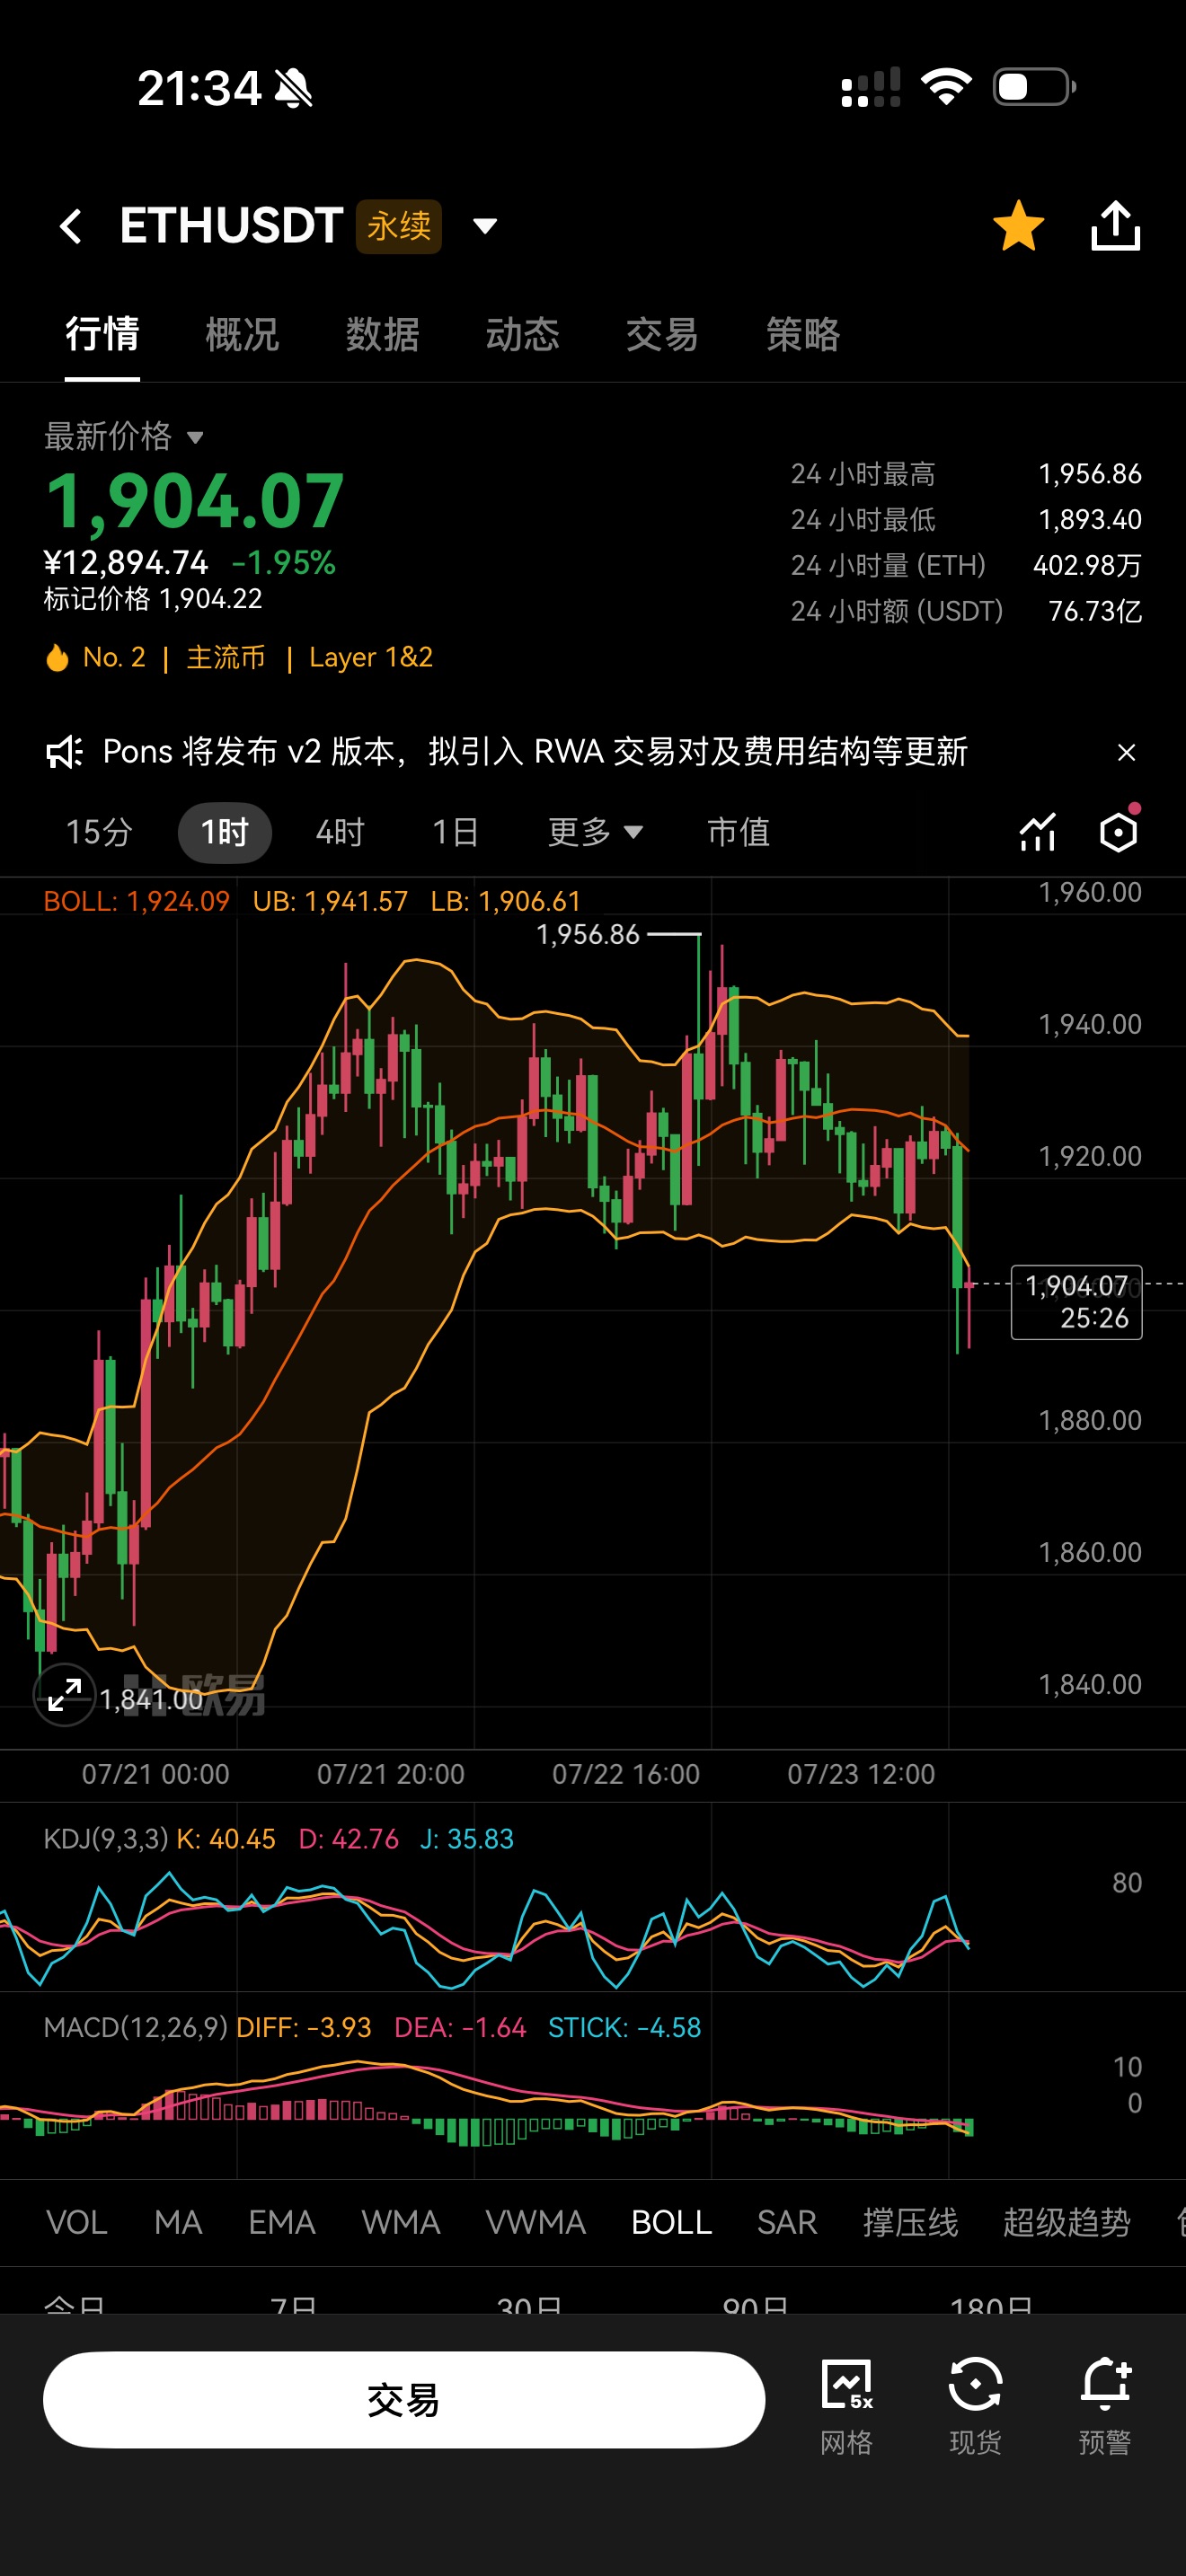
1. K-line and Bollinger Band pattern
The 1-hour Bollinger Band middle line is 1924.09, and the current price of 1904.07 has directly broken through the middle line with a large bearish candle, quickly touching the lower Bollinger Band around 1906.61.
After previously rising to 1956.86 and hitting strong resistance at the upper Bollinger Band, the bulls completely lost strength, resulting in a long period of horizontal consolidation at high levels. Ultimately, a breakout to the downside occurred with a large bearish candle, breaking through the short-term consolidation range, allowing bears to dominate in the short term.
The Bollinger channel has shifted from flat to opening downward, indicating further downward potential in the short term.
2. Technical indicator signals
1. KDJ: After a high position turnaround, it is operating with a bearish cross, staying in a downward channel, with sufficient short-term bearish momentum, only slightly oversold, with no strong rebound or recovery signals yet;
2. MACD: DIFF crossing below DEA forming a bearish cross, the green momentum bars continue to expand, with bullish upward power completely exhausted, confirming the downtrend with indicators.
3. Key resistance and support
Resistance level (rebound resistance)
1. First resistance: 1924 (Bollinger middle line, which turns from support to strong resistance after breaking)
2. Strong resistance: 1941.57–1956.86 previous upper range of consolidation + stage high point
Support level
1. Short-term immediate support: 1906 (Bollinger lower line)
2. Next level of support: 1893 daily low, effective breakdown will open deeper downward space
4. Overall market characterization
A long period of high-level horizontal consolidation is a typical down continuation pattern, with multiple attempts to test previous highs all failing, and the bullish buying power unable to hold, ultimately leading to a volume breakout downward leading to an adjustment. Even with a slight short-term rebound, it is just a technical pullback after the breakout, making it difficult to return to the middle Bollinger Band and reverse the short-term weak pattern; the overall downward consolidation structure has already been established.
BTC 1-hour market complete situation interpretation
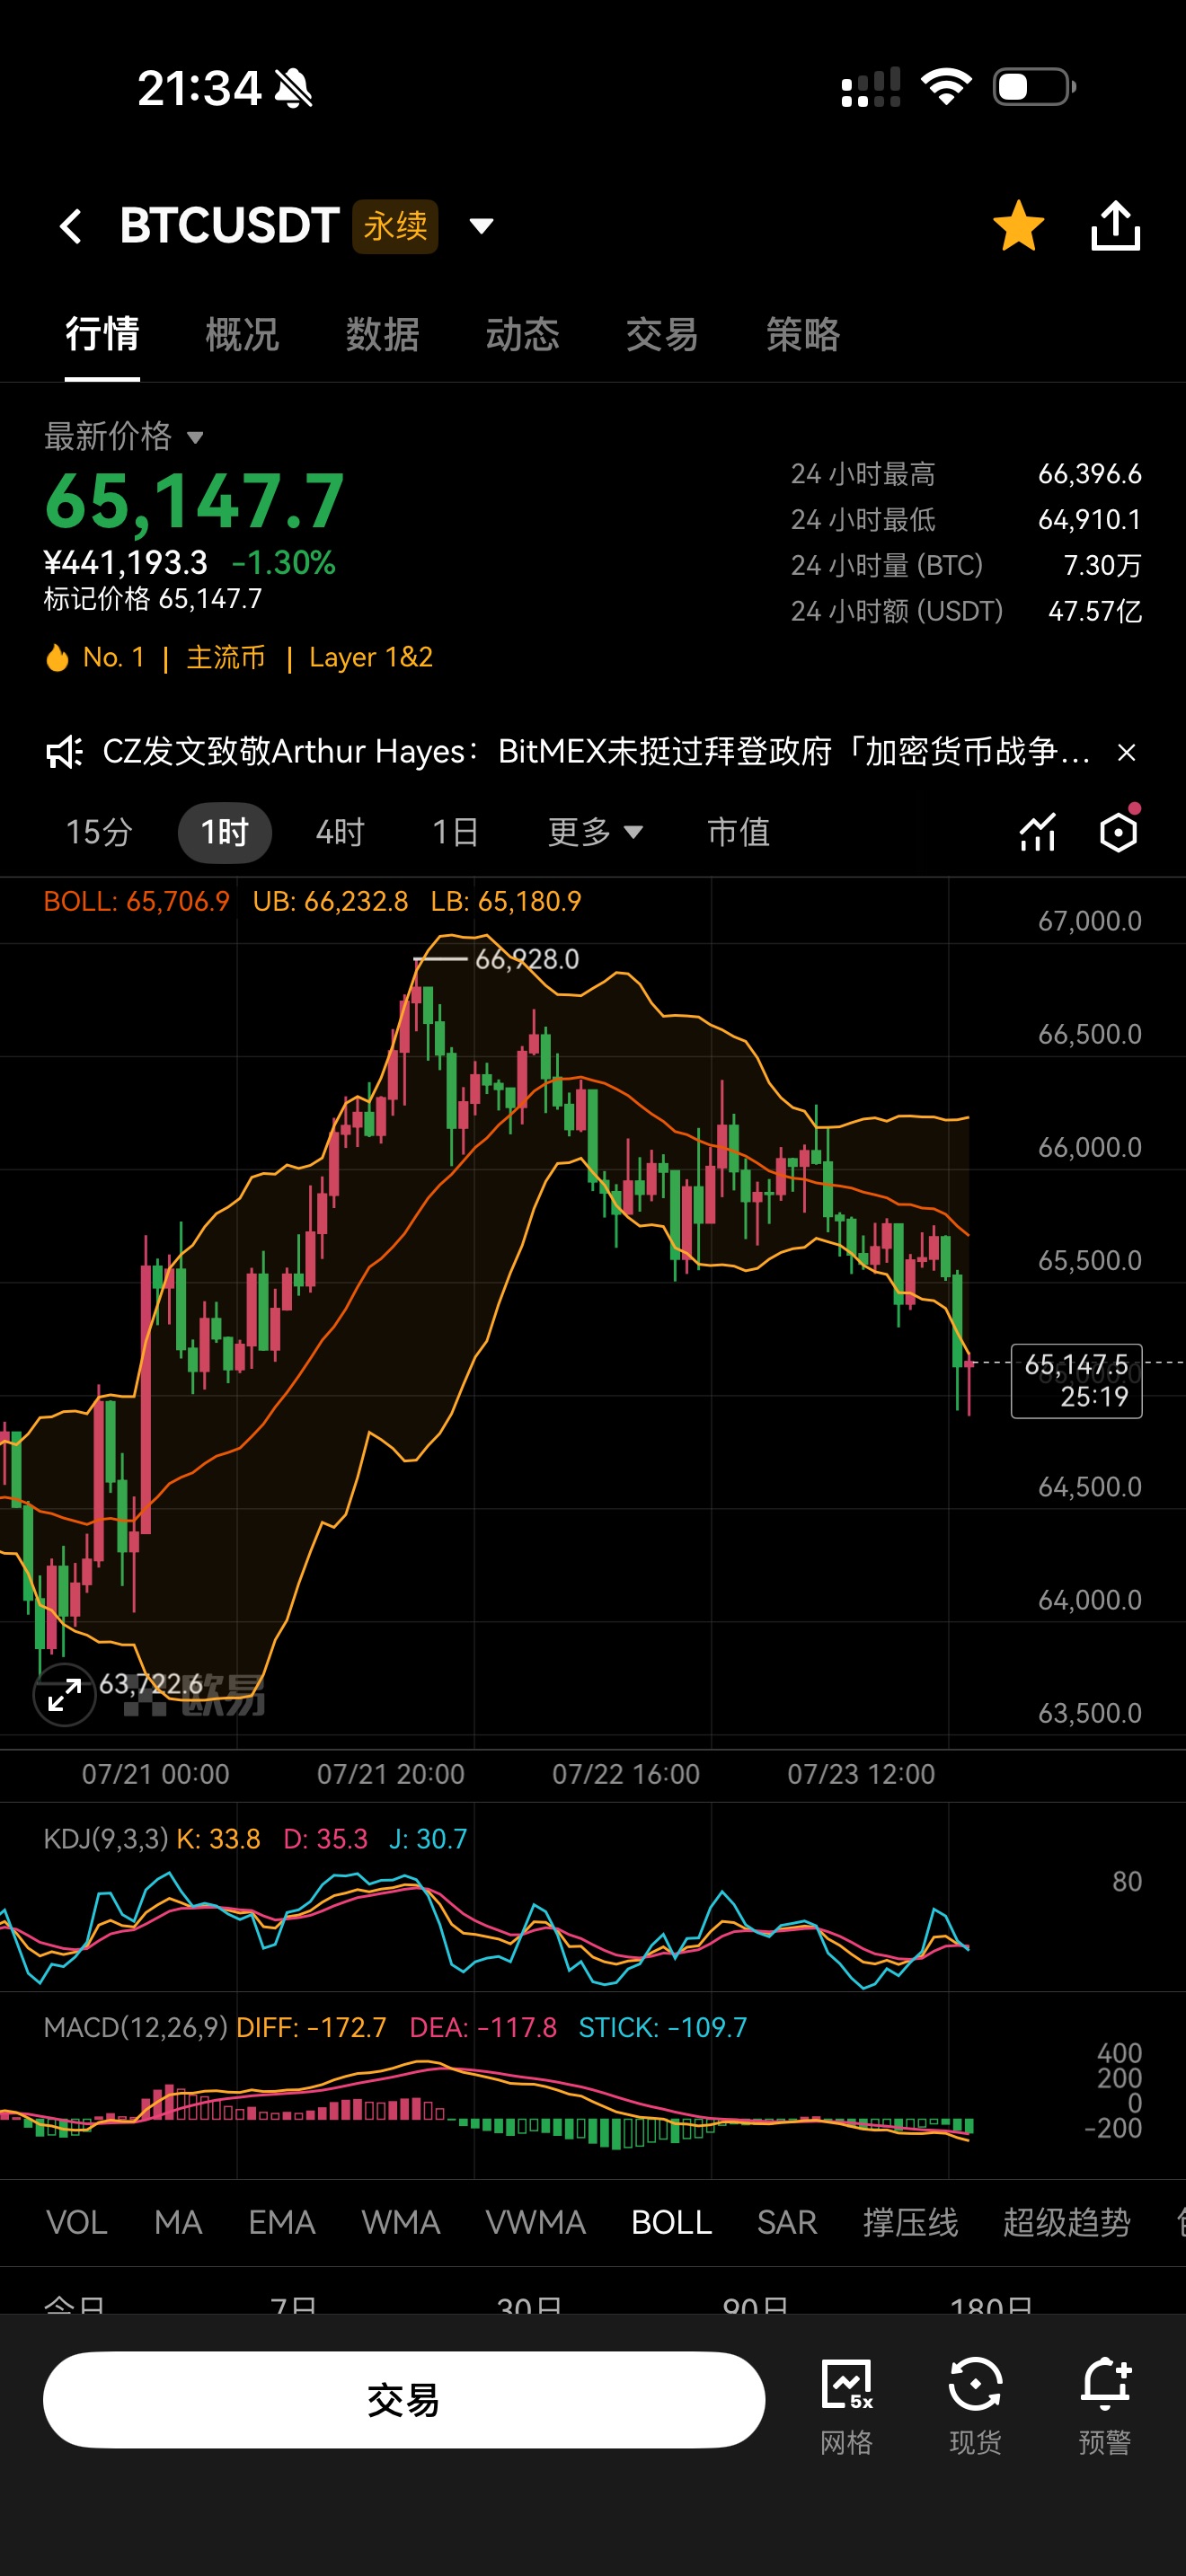
1. Bollinger Band and K-line structural pattern
The 1-hour Bollinger middle line is 65706.9, and the current price of 65147.7 has directly broken through the middle line with a large bearish candle, testing support near the lower Bollinger Band at 65180.9.
After previously rising to 66928 and hitting resistance at the upper Bollinger Band, the bulls were completely unable to refresh the high point, leading to a long period of horizontal consolidation at high levels, characteristic of a typical down continuation pattern. Ultimately, a large bearish candle broke down, and the Bollinger Band track began to slightly open downward. The short-term bearish trend has opened up, with the original middle Bollinger line now directly turning into strong resistance.
K-line highs are shifting downward step by step, with the fluctuation range constantly descending, upward momentum completely exhausted, and the bullish support funds insufficient, with concentrated selling pressure released.
2. Technical indicator status
1. KDJ: Continuous decline after a bearish cross at a high position, values are in a weak range, with sufficient short-term bearish momentum, only slightly oversold, the rebound and repair force are limited;
2. MACD: DIFF continues to operate below DEA, with green bars further expanding, bearish volume continuously releasing, and the stage adjustment market is completely confirmed by indicators.
3. Key resistance and support price levels
Rebound resistance area
1. Short-term first resistance: 65706 (Bollinger middle line breakdown resistance)
2. Strong resistance interval: 66232–66928 previous upper range of consolidation and stage high point
Lower support area
1. Immediate short-term support: 65180 (Bollinger lower line)
2. Important defensive support: 64910 daily low, effective breakdown will open a deeper downward space
4. Overall market characterization
The prior high-level repeated fluctuations of Bitcoin are not a buildup for upward momentum but a buildup for downwards after the exhaustion of bullish power. All previous attempts to breach the highs have failed, and the lack of buying power has led to concentrated selling outflows.
This large bearish candle represents a breakdown after consolidation; even if a slight technical rebound occurs afterward, it is merely a temporary fix during the downturn. It is difficult to return to the middle Bollinger Band and reverse the short-term weak structure, reinforcing the overall downward movement.
The overall trend perfectly confirms the previous judgment, with both BTC and ETH experiencing deep downward breaks. All 1-hour level large bearish candles break through the middle Bollinger Band, and the prolonged horizontal consolidation at high levels ultimately chooses to break downward. MACD and KDJ sync in a bearish cross, providing clear adjustment signals from a technical perspective. The previous reiteration of the need to avoid chasing the buy at high positions was accurate; the consolidation was merely a down continuation, with the market's reality falling as expected. The dual-currency short positions that were laid out in advance successfully harvested this round of trend decline, with ETH even directly doubling its profits. Trading does not rely on luck to bet on direction but on the dissection of K-line structure, control of position systems, and the steadfast holding power against the backdrop of fluctuating and liquidating positions. The market verifies logic, and the results speak for themselves.
Public account——Bitcoin Great Bear X
(Note: 📣 Due to the limited timeliness and depth of information on public platforms, and the rapidly changing market, key turning points, precise operational strategies, and emergency risk alerts need to be synchronized in real time on the public account. Here you can receive: real-time strategy push, in-depth analytical support, interactive Q&A, risk warnings and optimization suggestions tailored to individual positions. 🚨 Remember: the market rewards those who act faster and have more accurate information! Be a winner among the minority.)

免责声明:本文章仅代表作者个人观点,不代表本平台的立场和观点。本文章仅供信息分享,不构成对任何人的任何投资建议。用户与作者之间的任何争议,与本平台无关。如网页中刊载的文章或图片涉及侵权,请提供相关的权利证明和身份证明发送邮件到support@aicoin.com,本平台相关工作人员将会进行核查。


