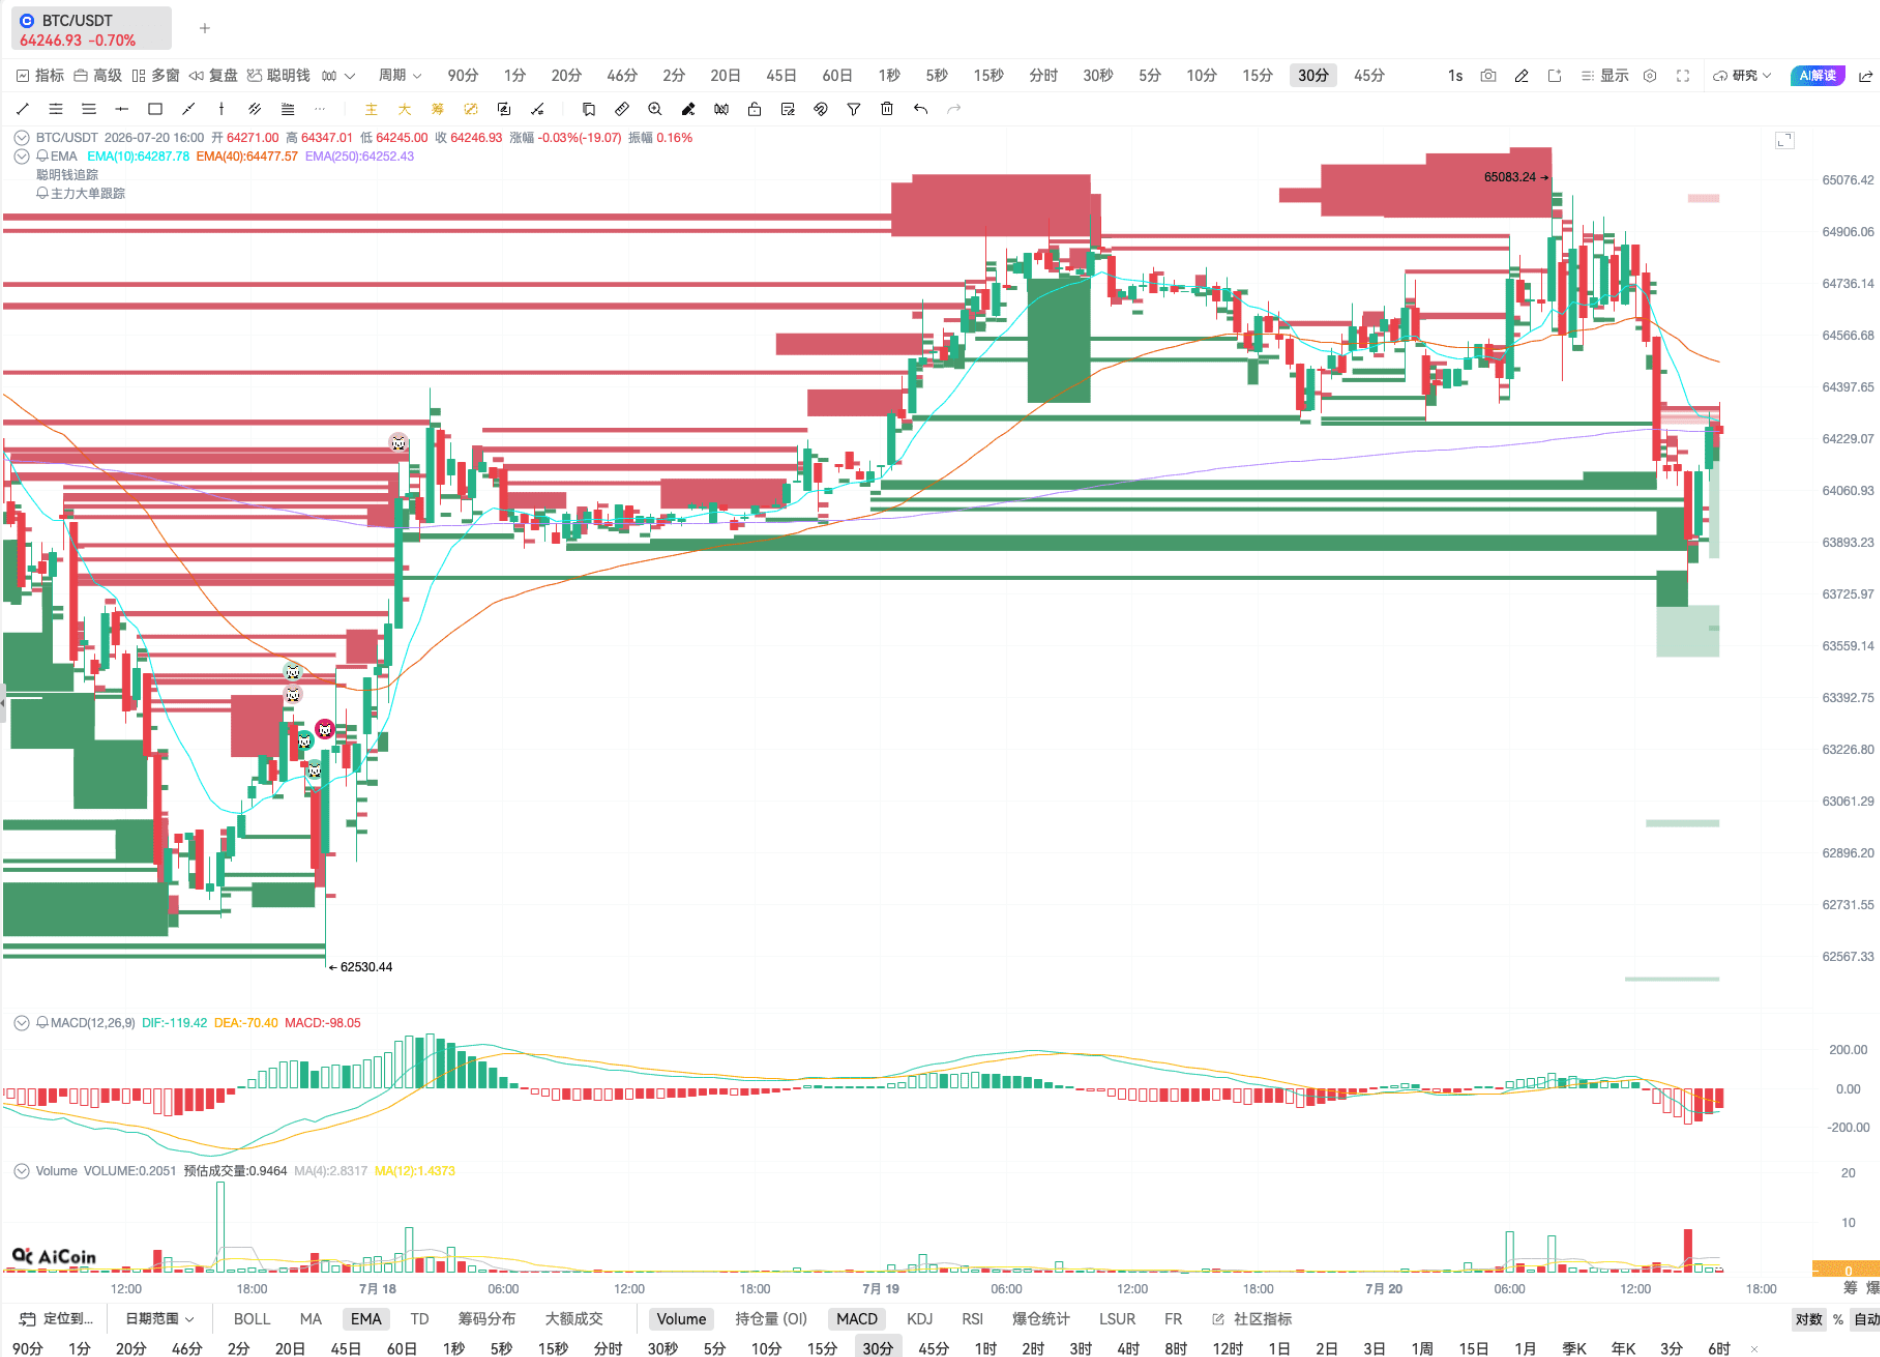
Today, we will talk about a very classic indicator—BOLL Bollinger Bands. Especially for those who like to play grids, do trend following, or enjoy chasing highs and lows, Bollinger Bands are really useful.
I used to love this indicator a while ago because I was playing grids, and grids happen to require fluctuating markets.
How did Bollinger Bands come about?
Bollinger Bands were officially created, named, and popularized by John Bollinger in the 1980s. Before him, there were already two types of primitive channel tools in the market—fixed percentage channels and high-low price channels. But both had fatal flaws: fixed percentages could not adapt to market fluctuations, channels became too narrow during extreme volatility and too wide during consolidations; high-low channels lagged significantly and could easily be fooled by false breakouts.
So, Bollinger began to ponder—is there a dynamic channel that can automatically expand and contract with market volatility? He repeatedly back-tested stocks, futures, and forex, ultimately creating this Bollinger Bands that incorporates the concept of statistical standard deviation.
He also tested different parameters: a 1 standard deviation channel was too narrow with too much noise; a 3 standard deviation channel was extremely broad, almost inaccessible, losing its warning significance. The version we see now is the final version he settled on.
Because of its simple logic, adaptability to all varieties, and triple functions of judging trend, volatility, and overbought/oversold conditions, Bollinger Bands were quickly integrated into major trading software, becoming a standard indicator.
Where to find Bollinger Bands?
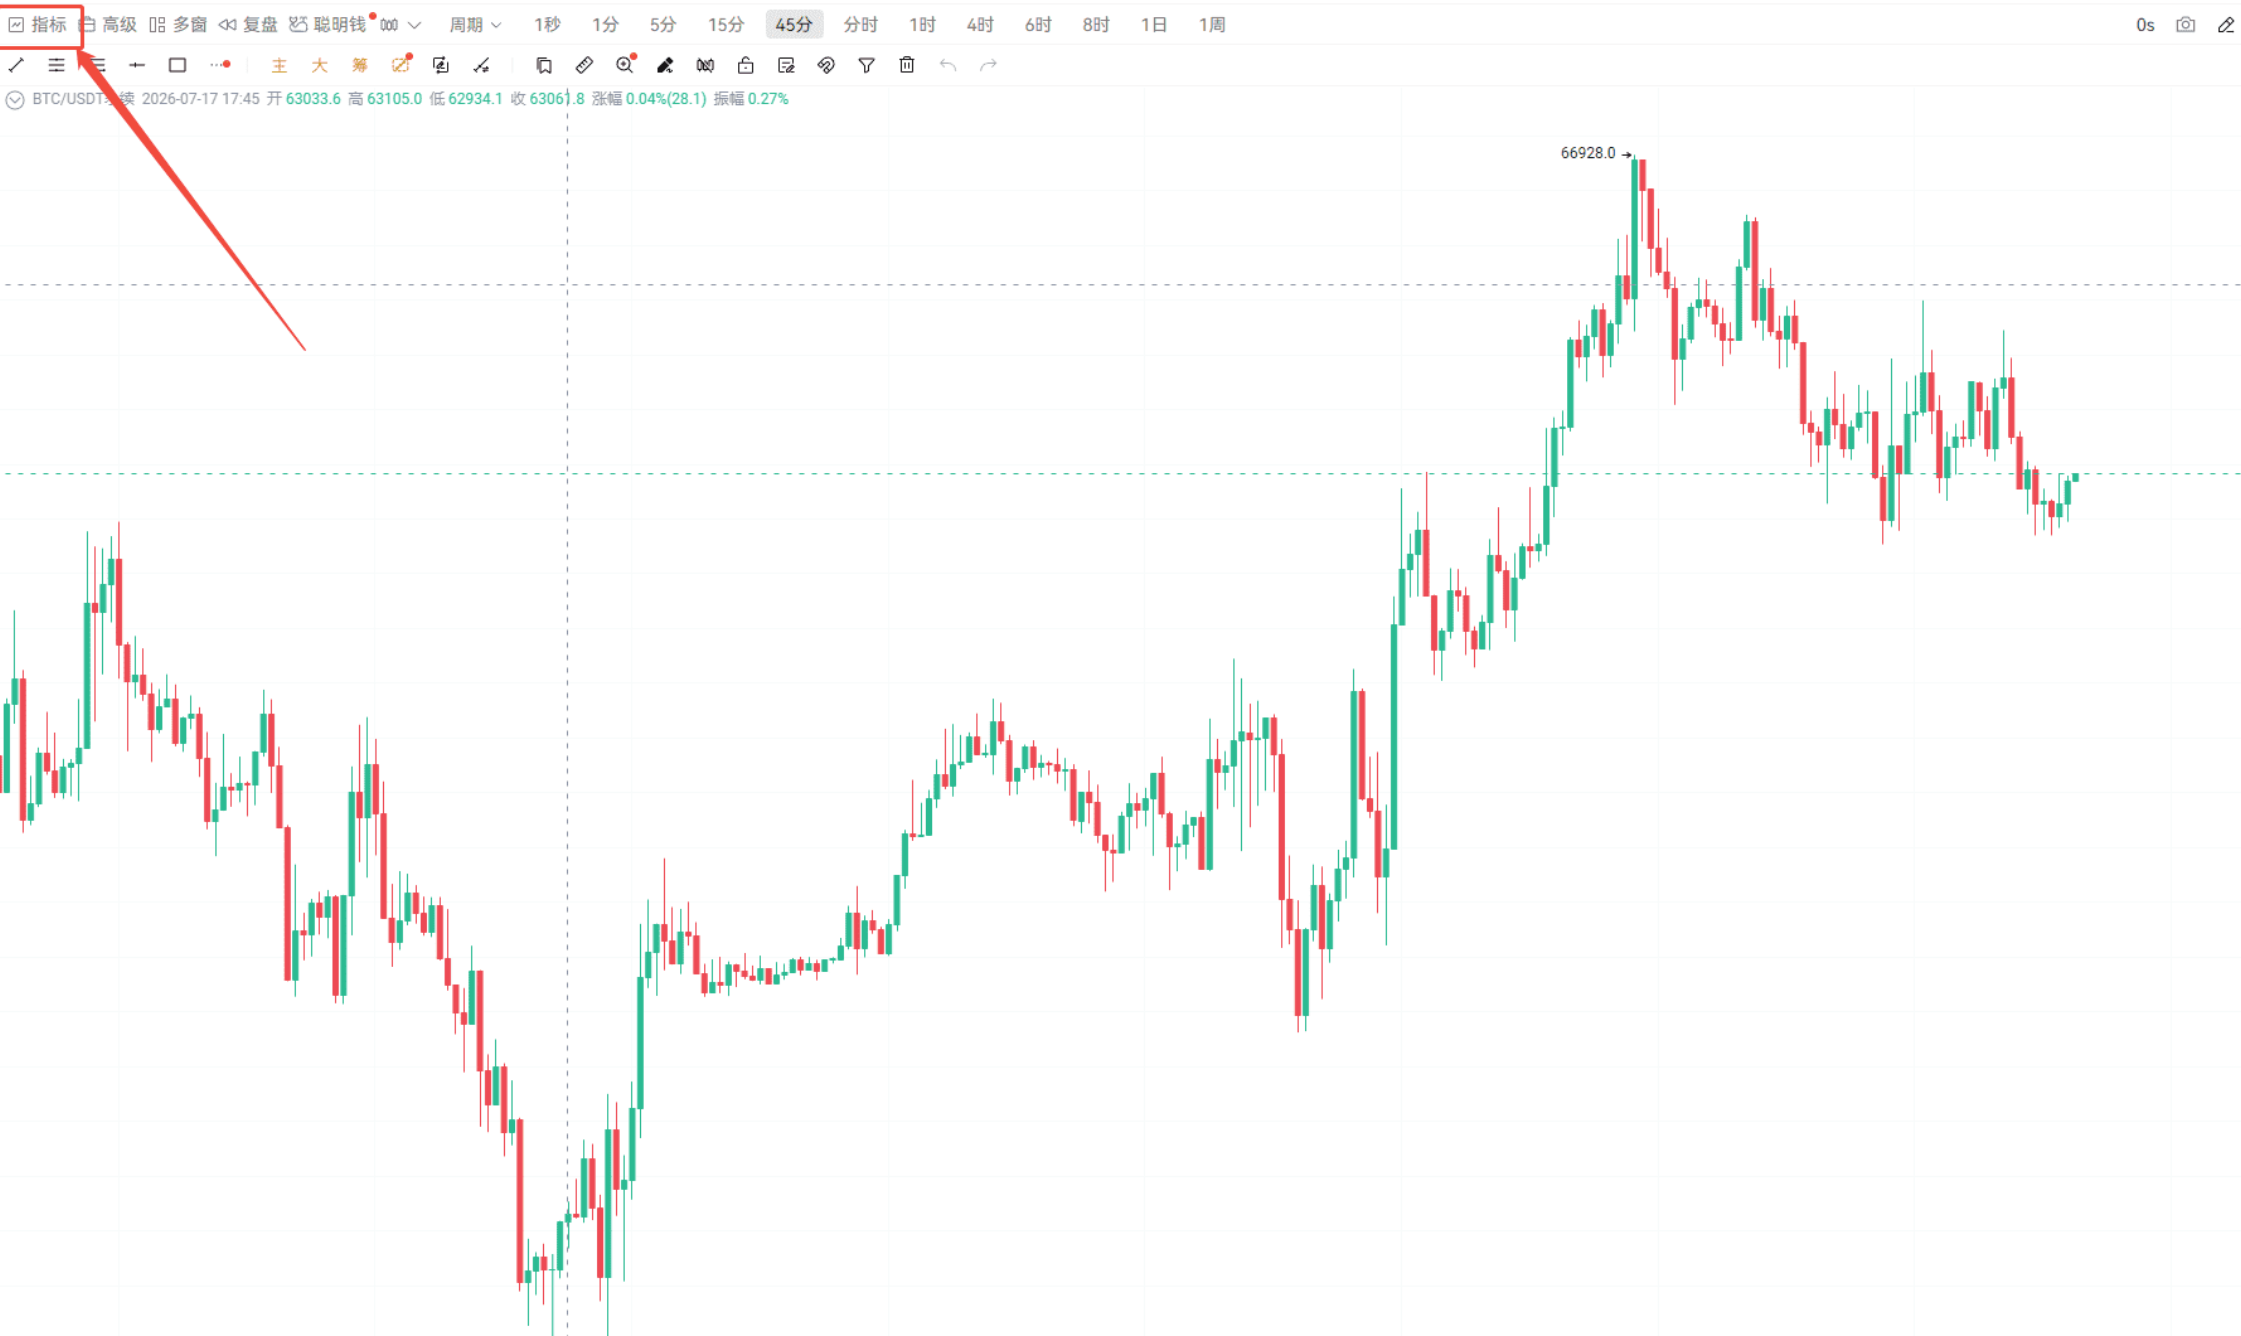
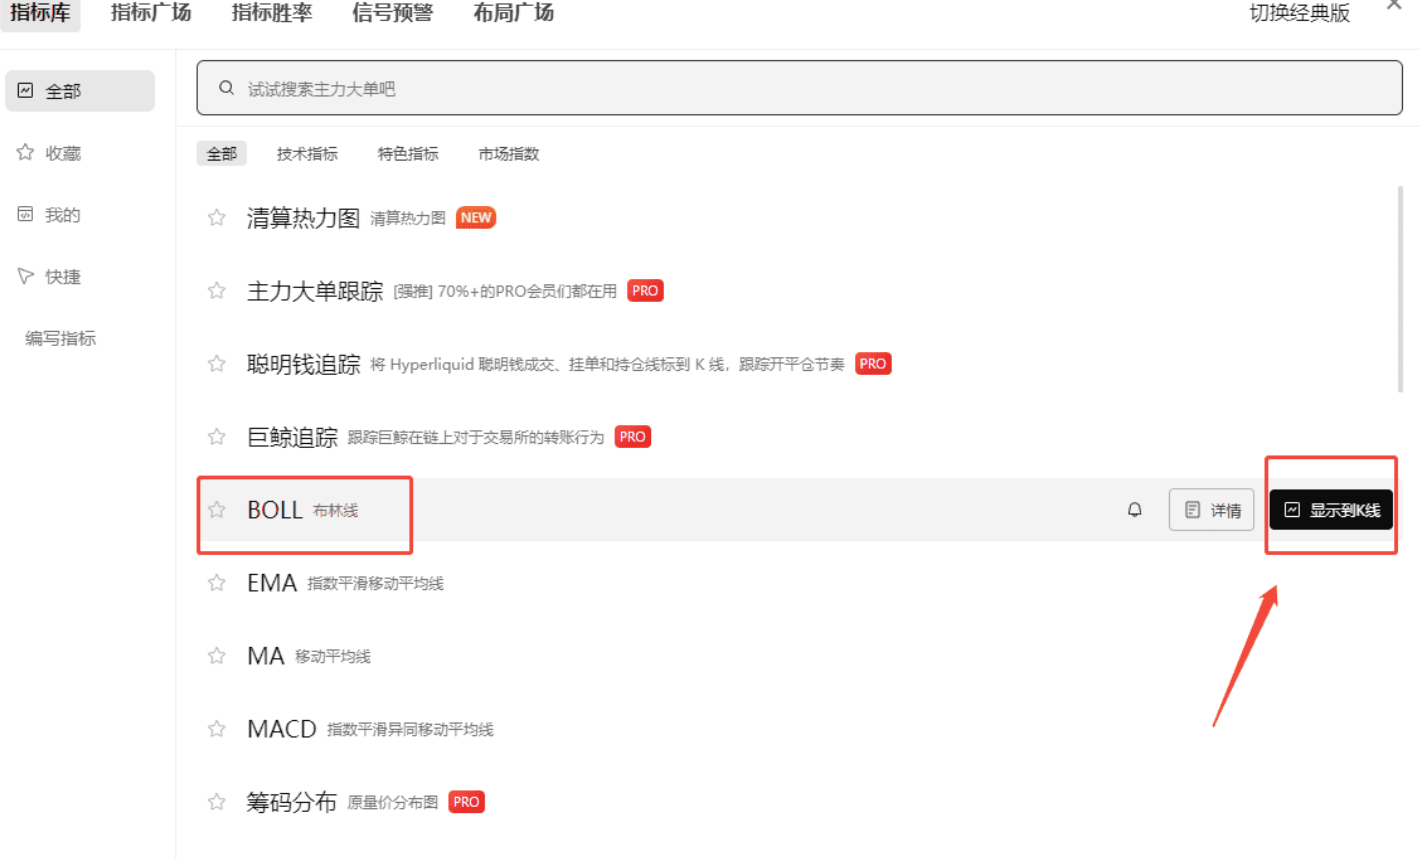
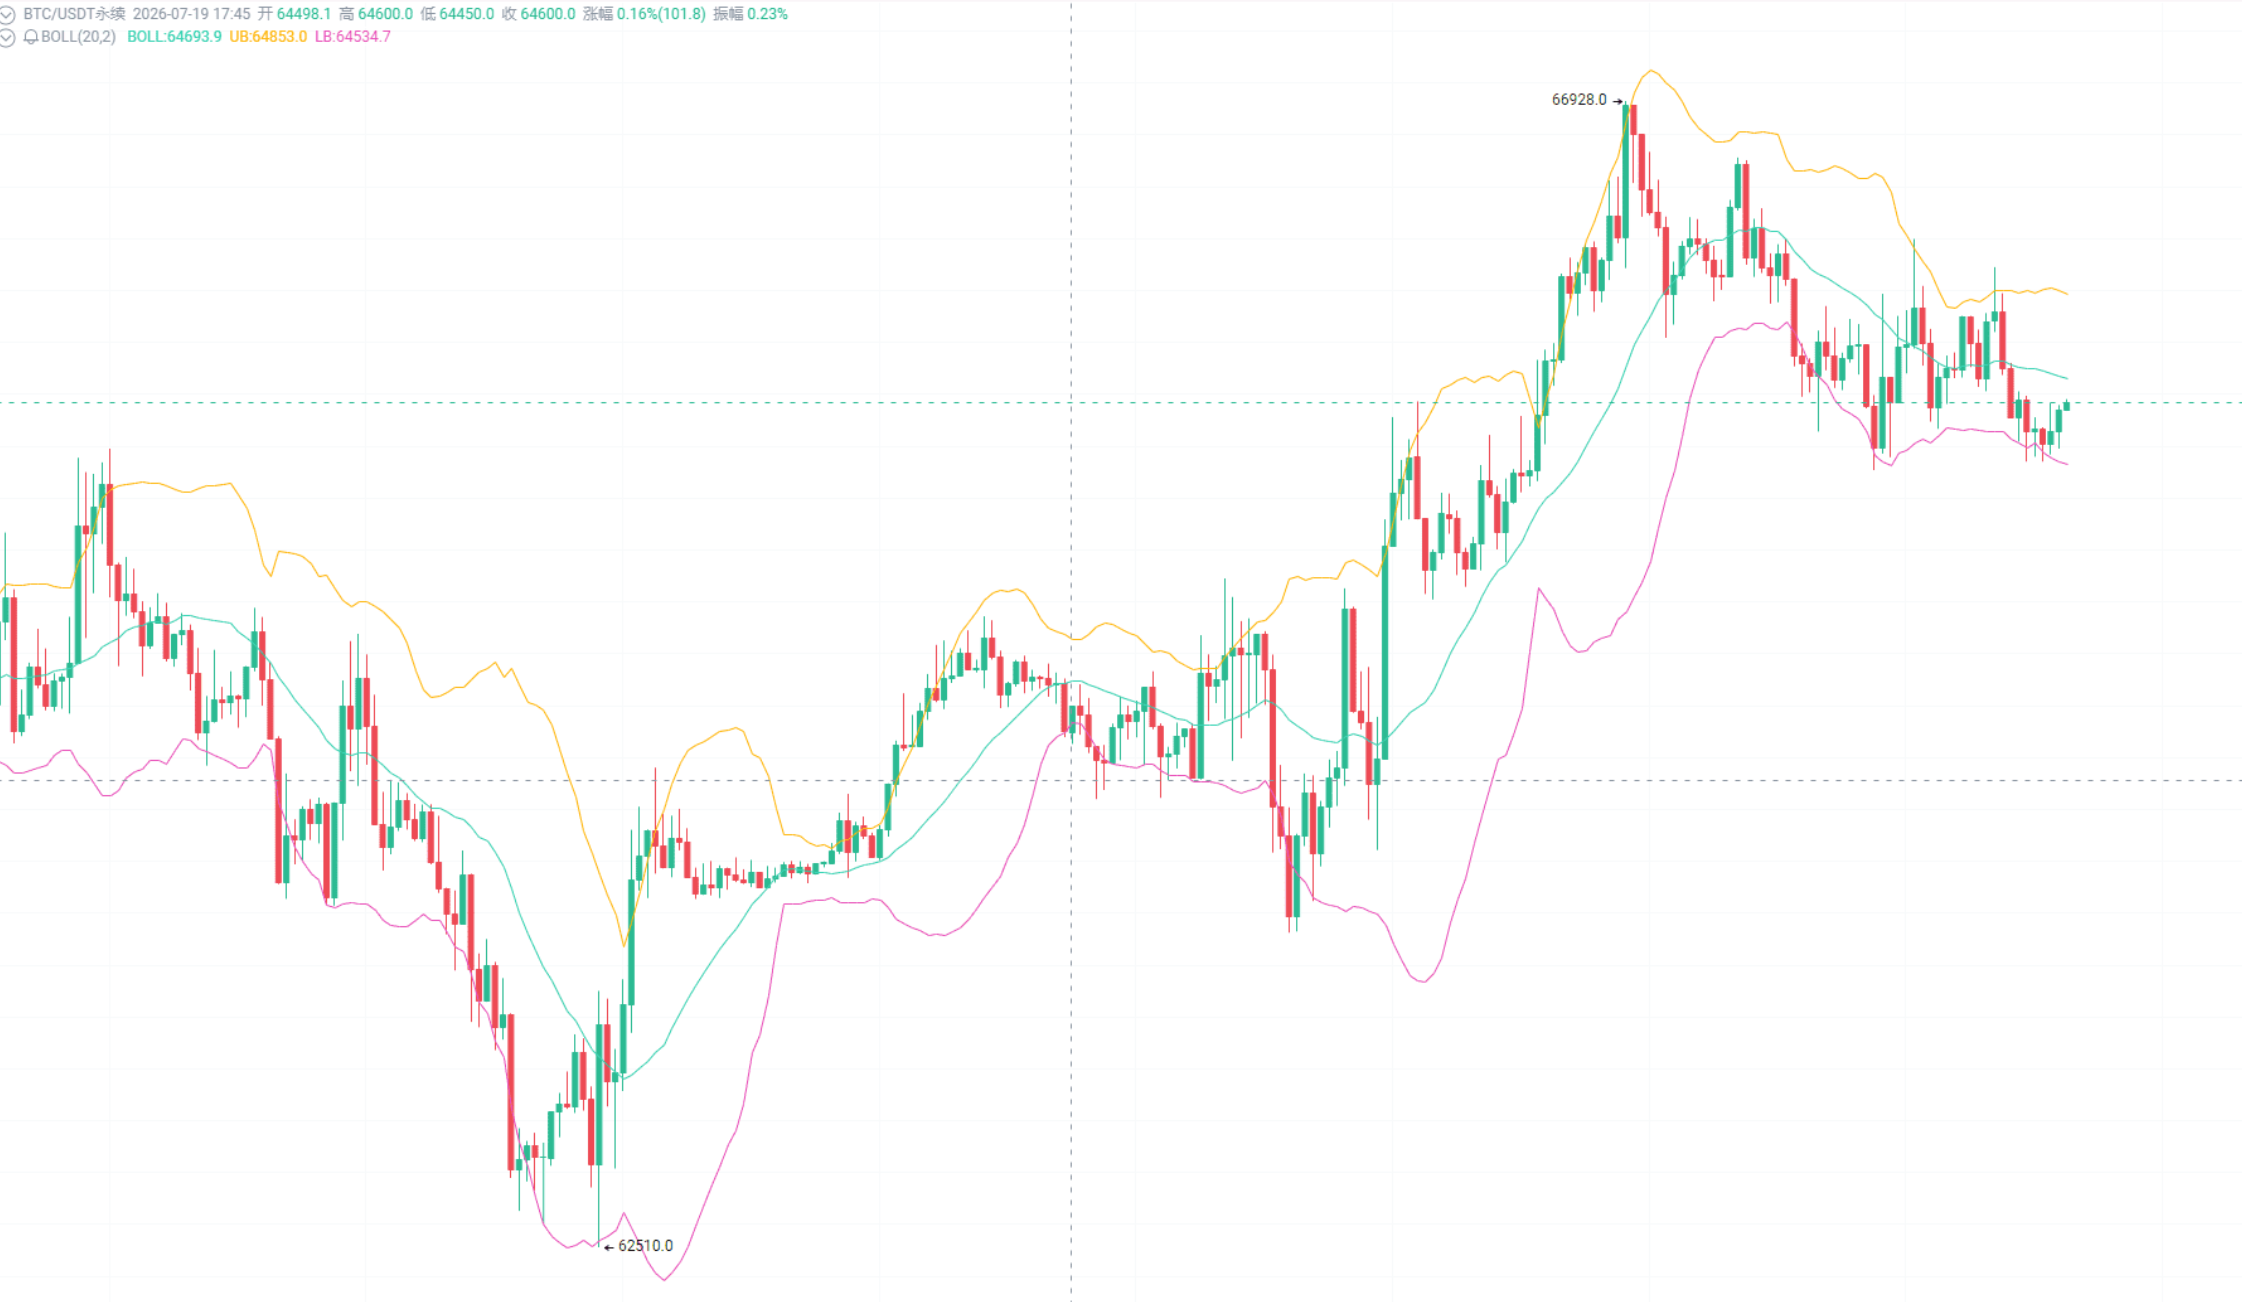
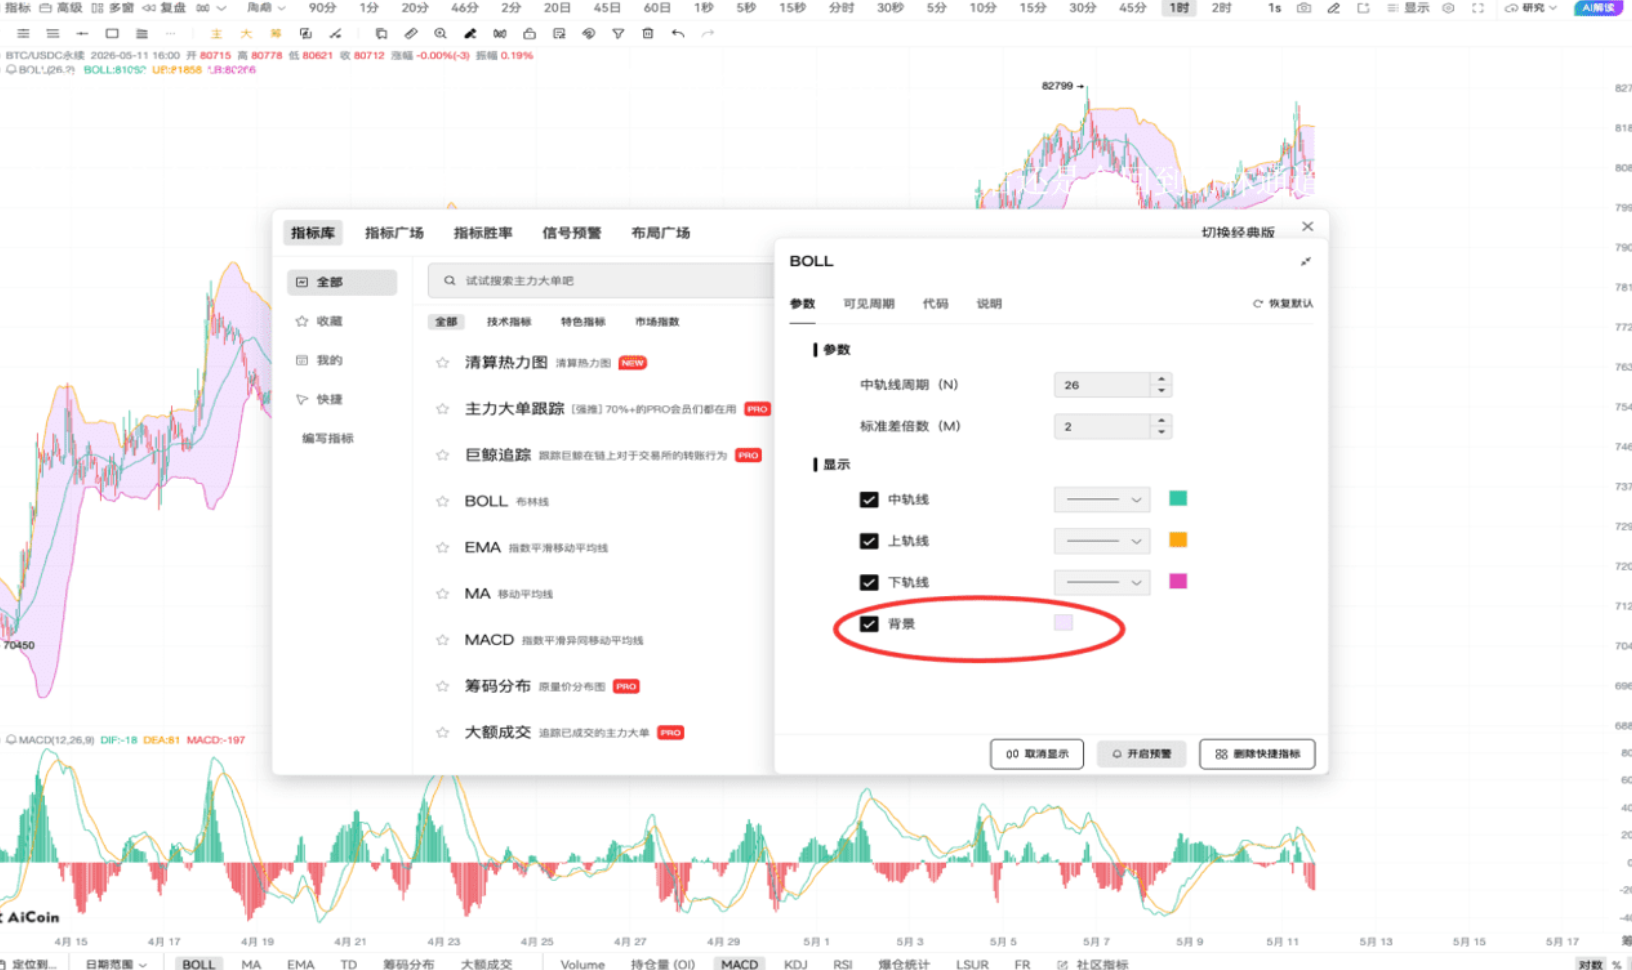
In the upper left corner of the market page, click on indicators, find Bollinger Bands and click it to overlay it on the candlestick chart.
How to tell if it's a sideways or trending market?
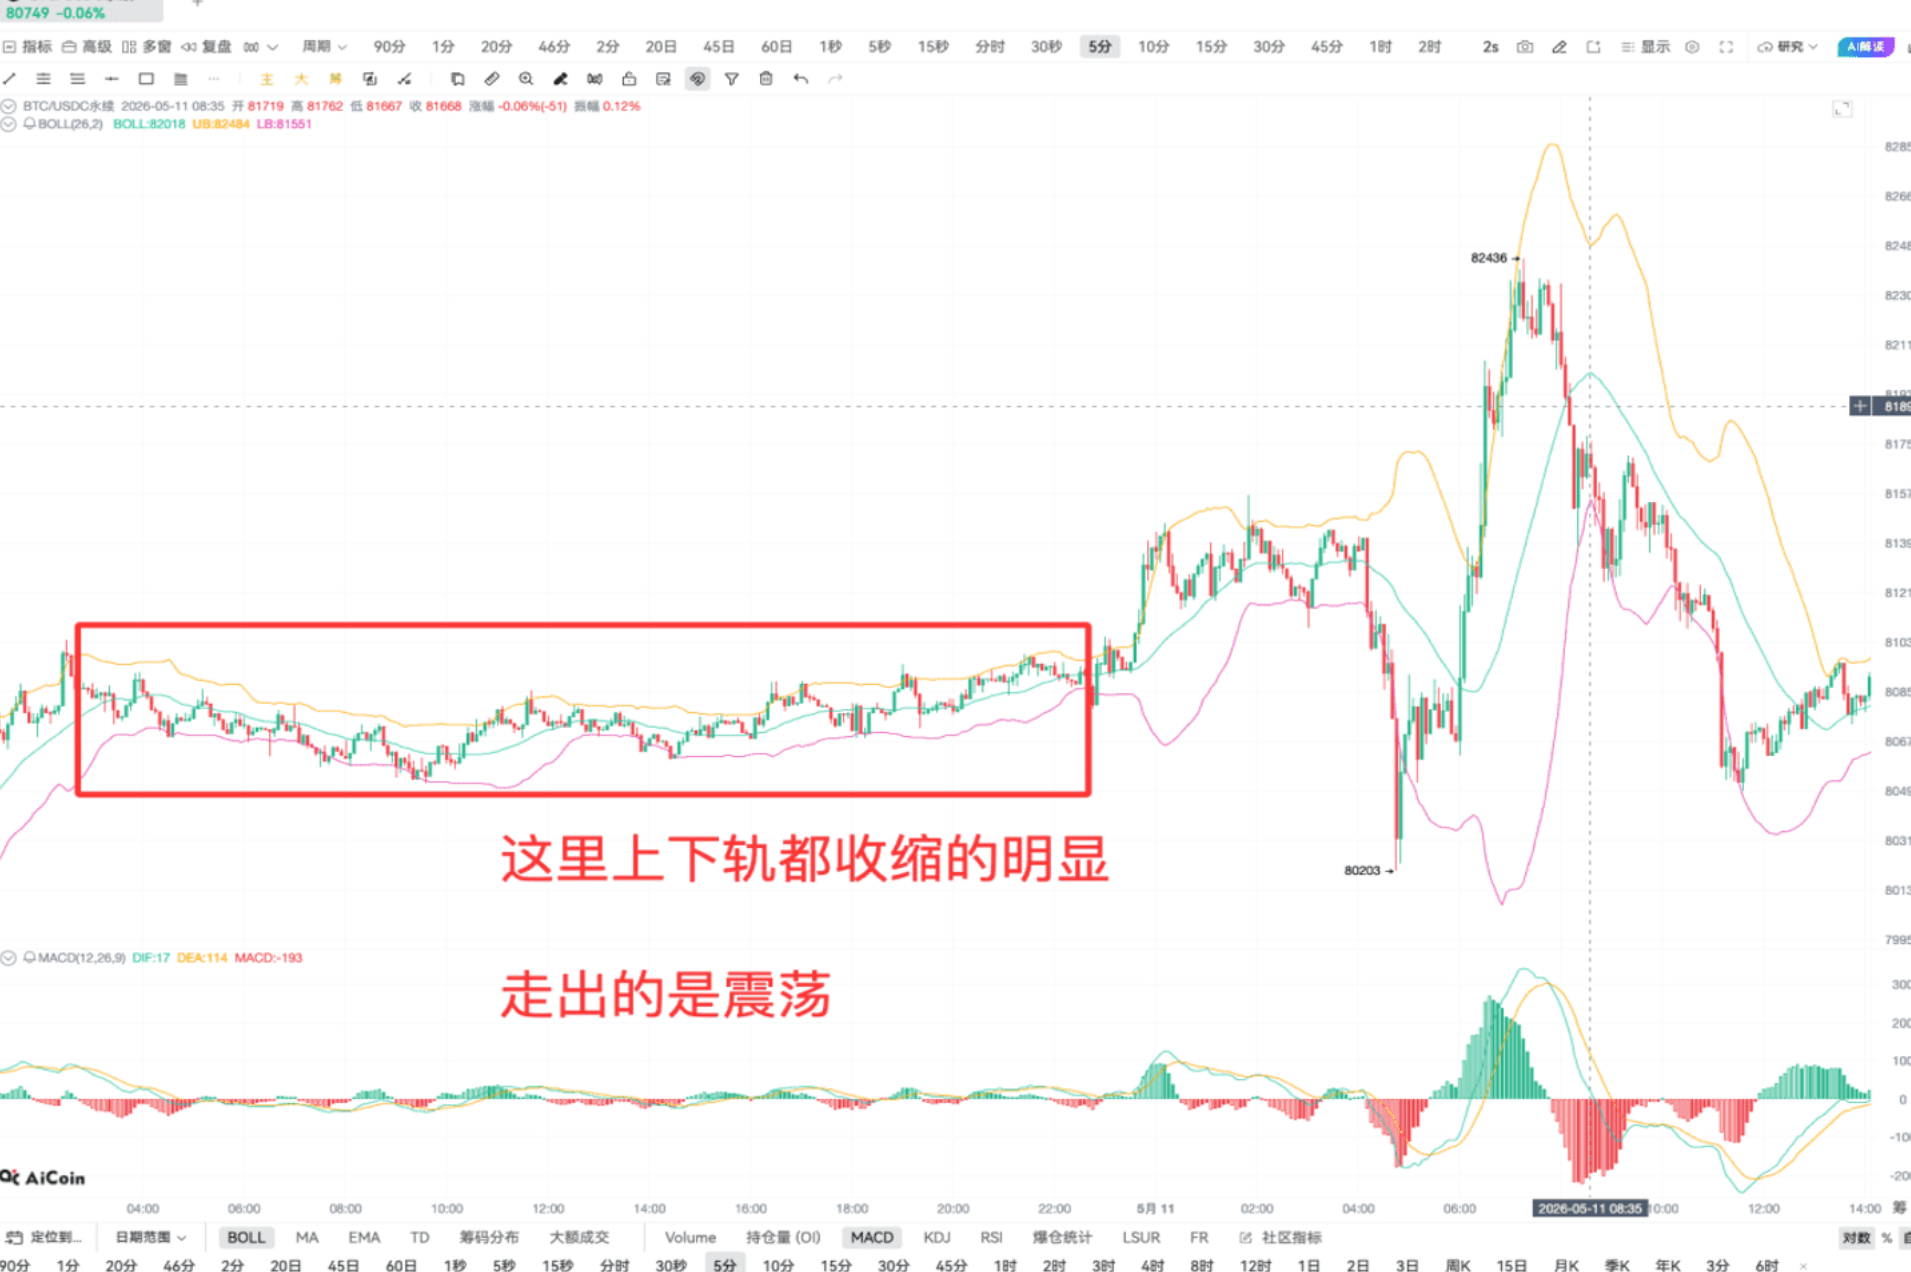
This is very simple: just look at whether the bands are open or closed.
Converging bands = sideways market. The market is entering a sluggish phase, and fluctuations are narrowing.
Diverging bands = trending market. Market volatility increases, and price actions multiply. 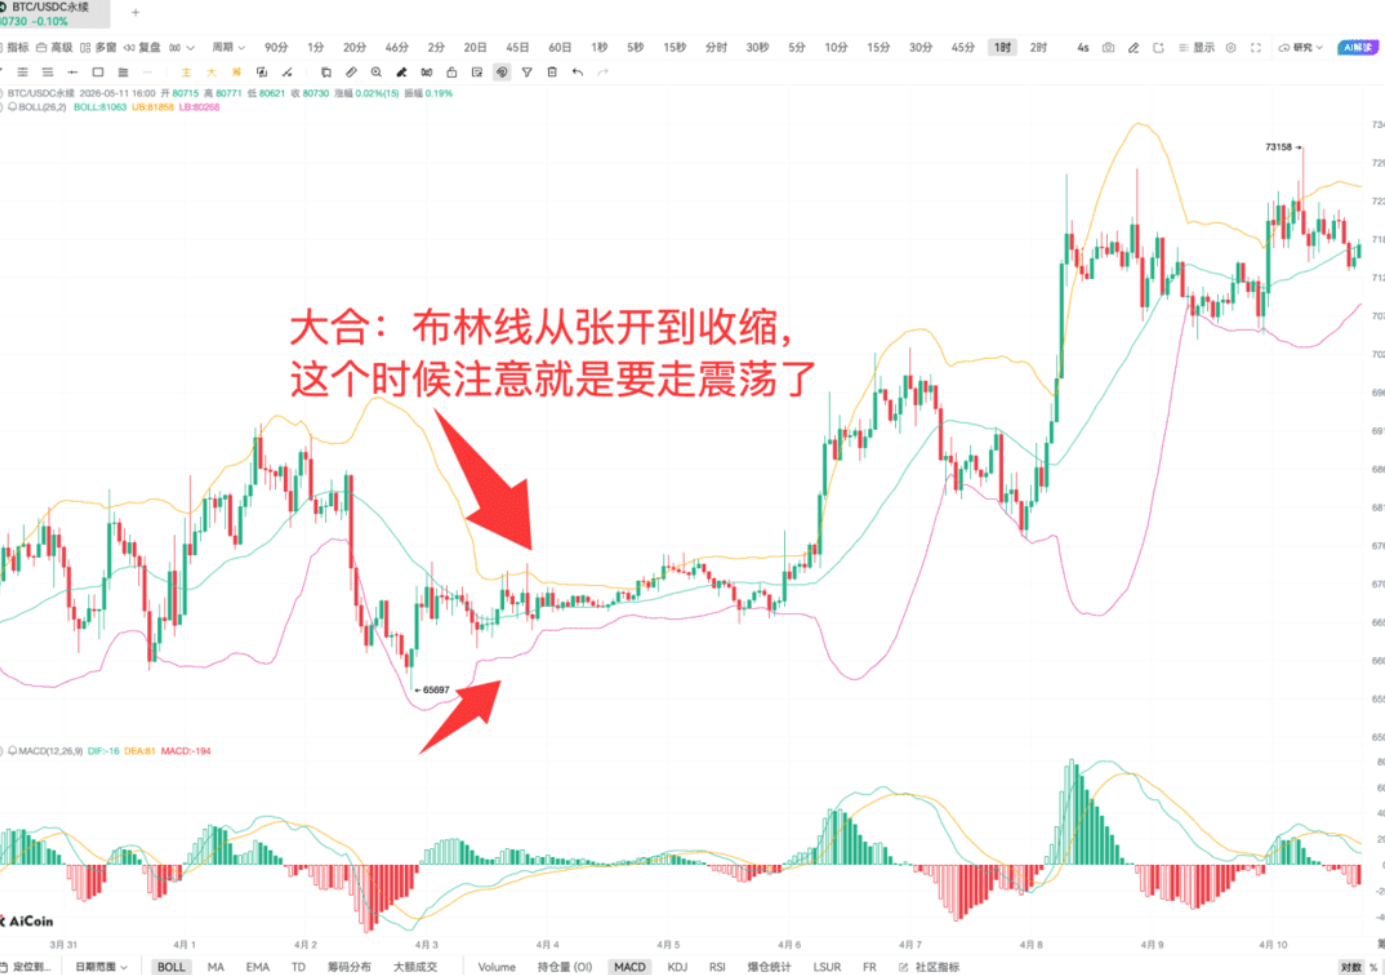
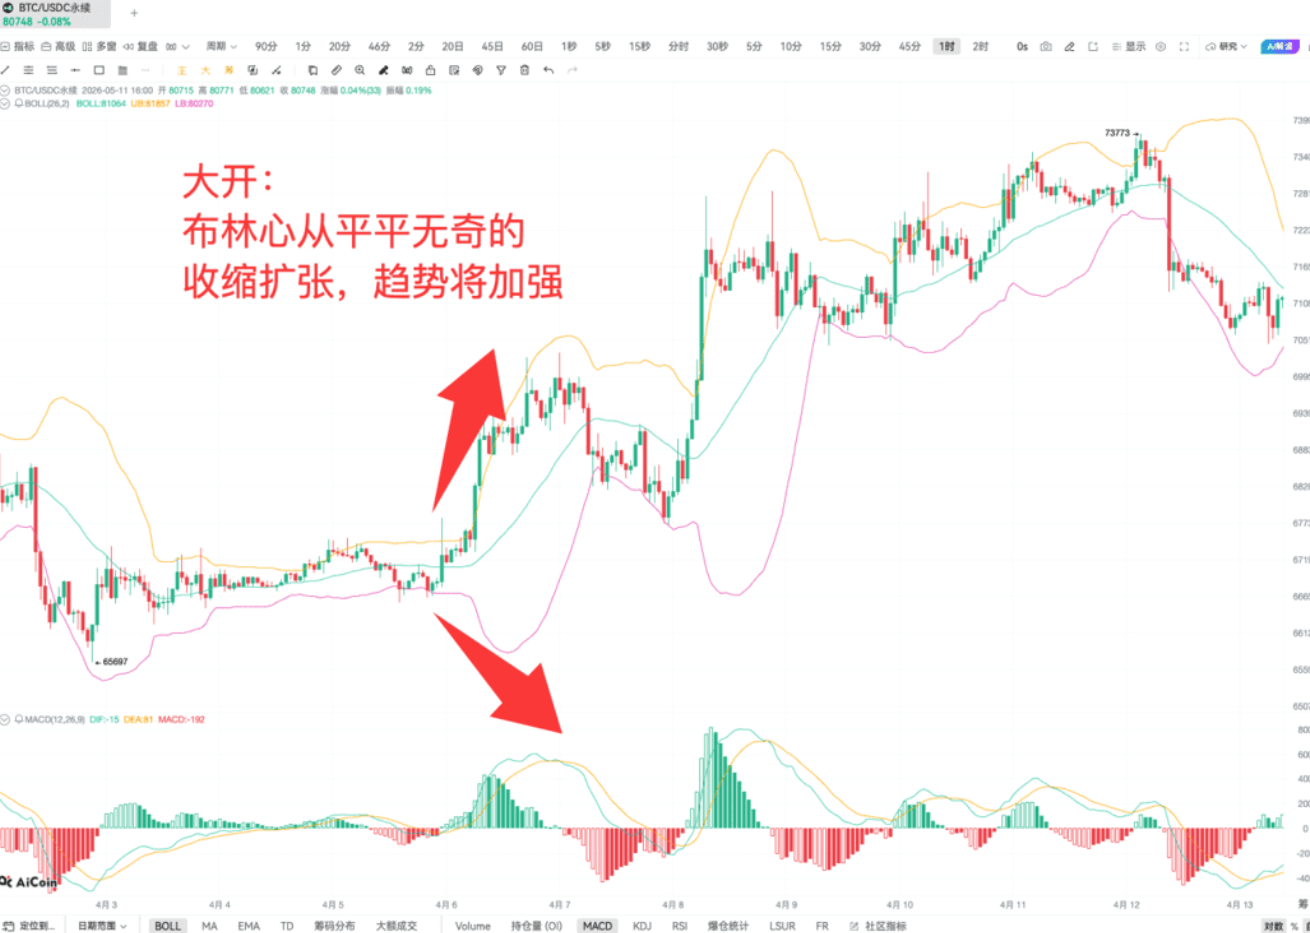
With just this one point, you can anticipate the market condition and have a baseline in your mind.
Bollinger Bands also act as support and resistance.
The upper band forms a resistance level, and the lower band forms a support level. Prices occasionally break through the upper or lower bands, but they usually get pulled back into the channel quickly. This strong support and resistance effect is very valuable in practical applications.
Next, I will teach you three buy points and three sell points, pure practical content.
First Buy Point (Aggressive)
Three conditions must be met simultaneously:
-
Price is running along the lower Bollinger Band
-
Price starts to move away from the lower band
-
Price breaks through the middle band
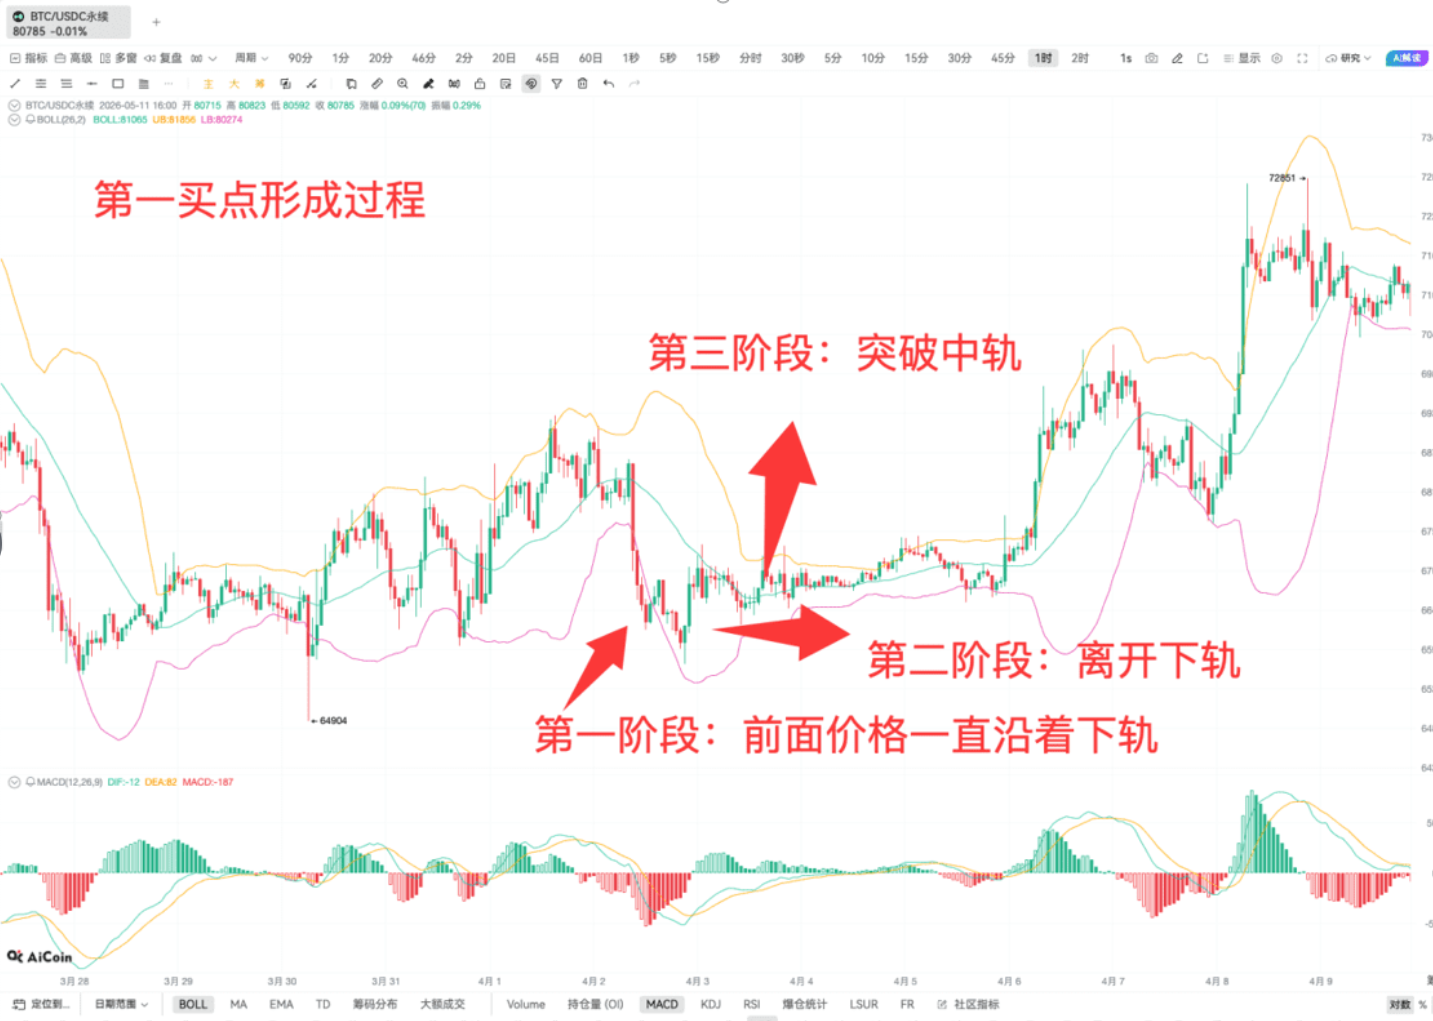
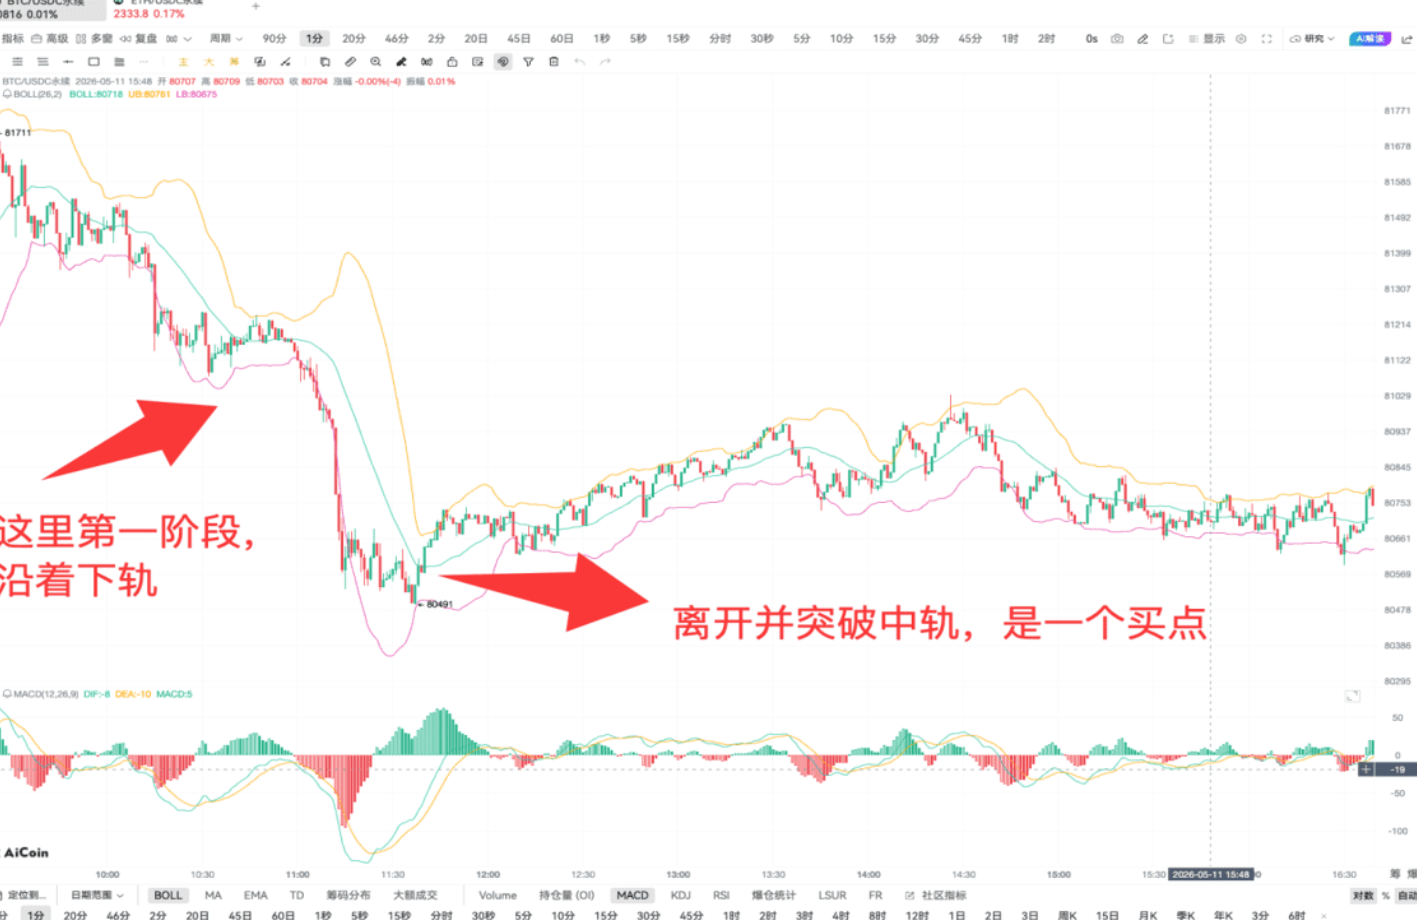
The first buy point is considered a relatively aggressive entry position and is suitable for friends willing to take on some risk.
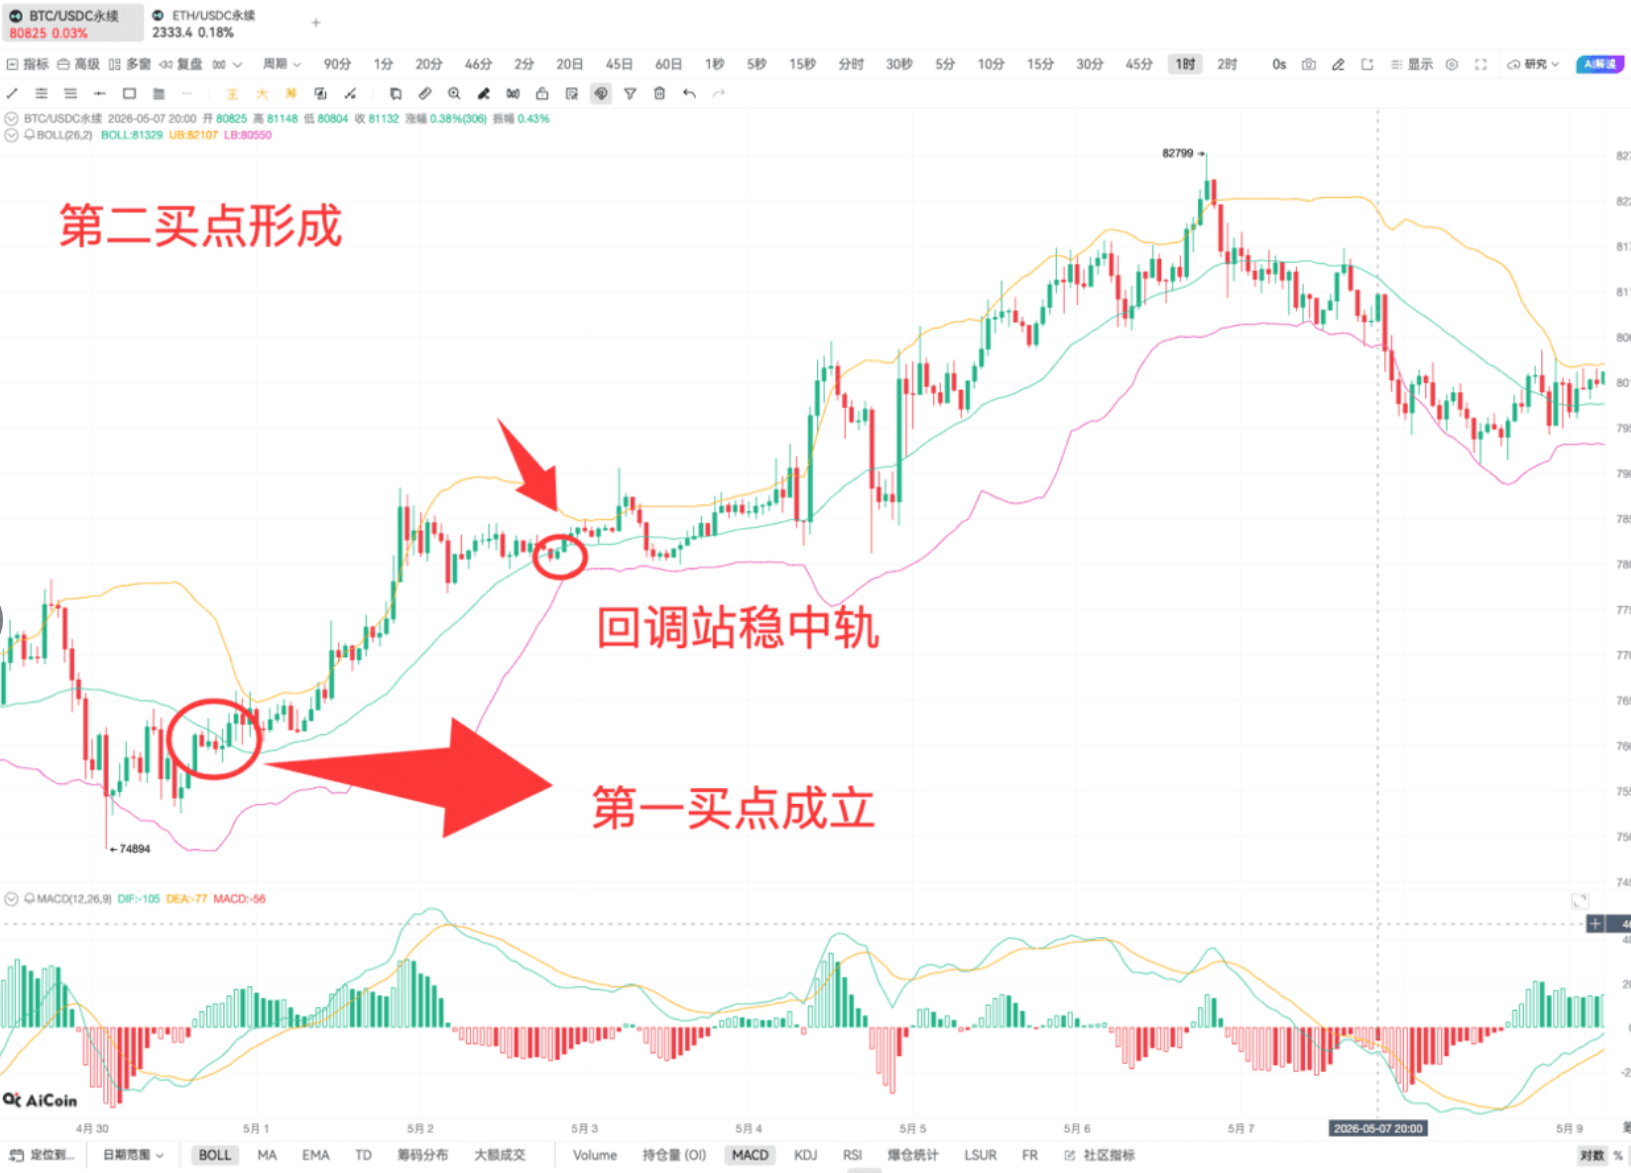
Second Buy Point (Conservative)
Based on the first buy point being valid:
-
The first buy point is already established, the trend is preliminarily confirmed
-
Price retraces near the middle band, testing support
-
Price stabilizes on the middle band, confirming that the support is valid
Even if it breaks a little below the middle band and then quickly returns, it doesn't affect the setup. Once the middle band support is confirmed, it is the best entry point. The second buy point is much more conservative than the first.
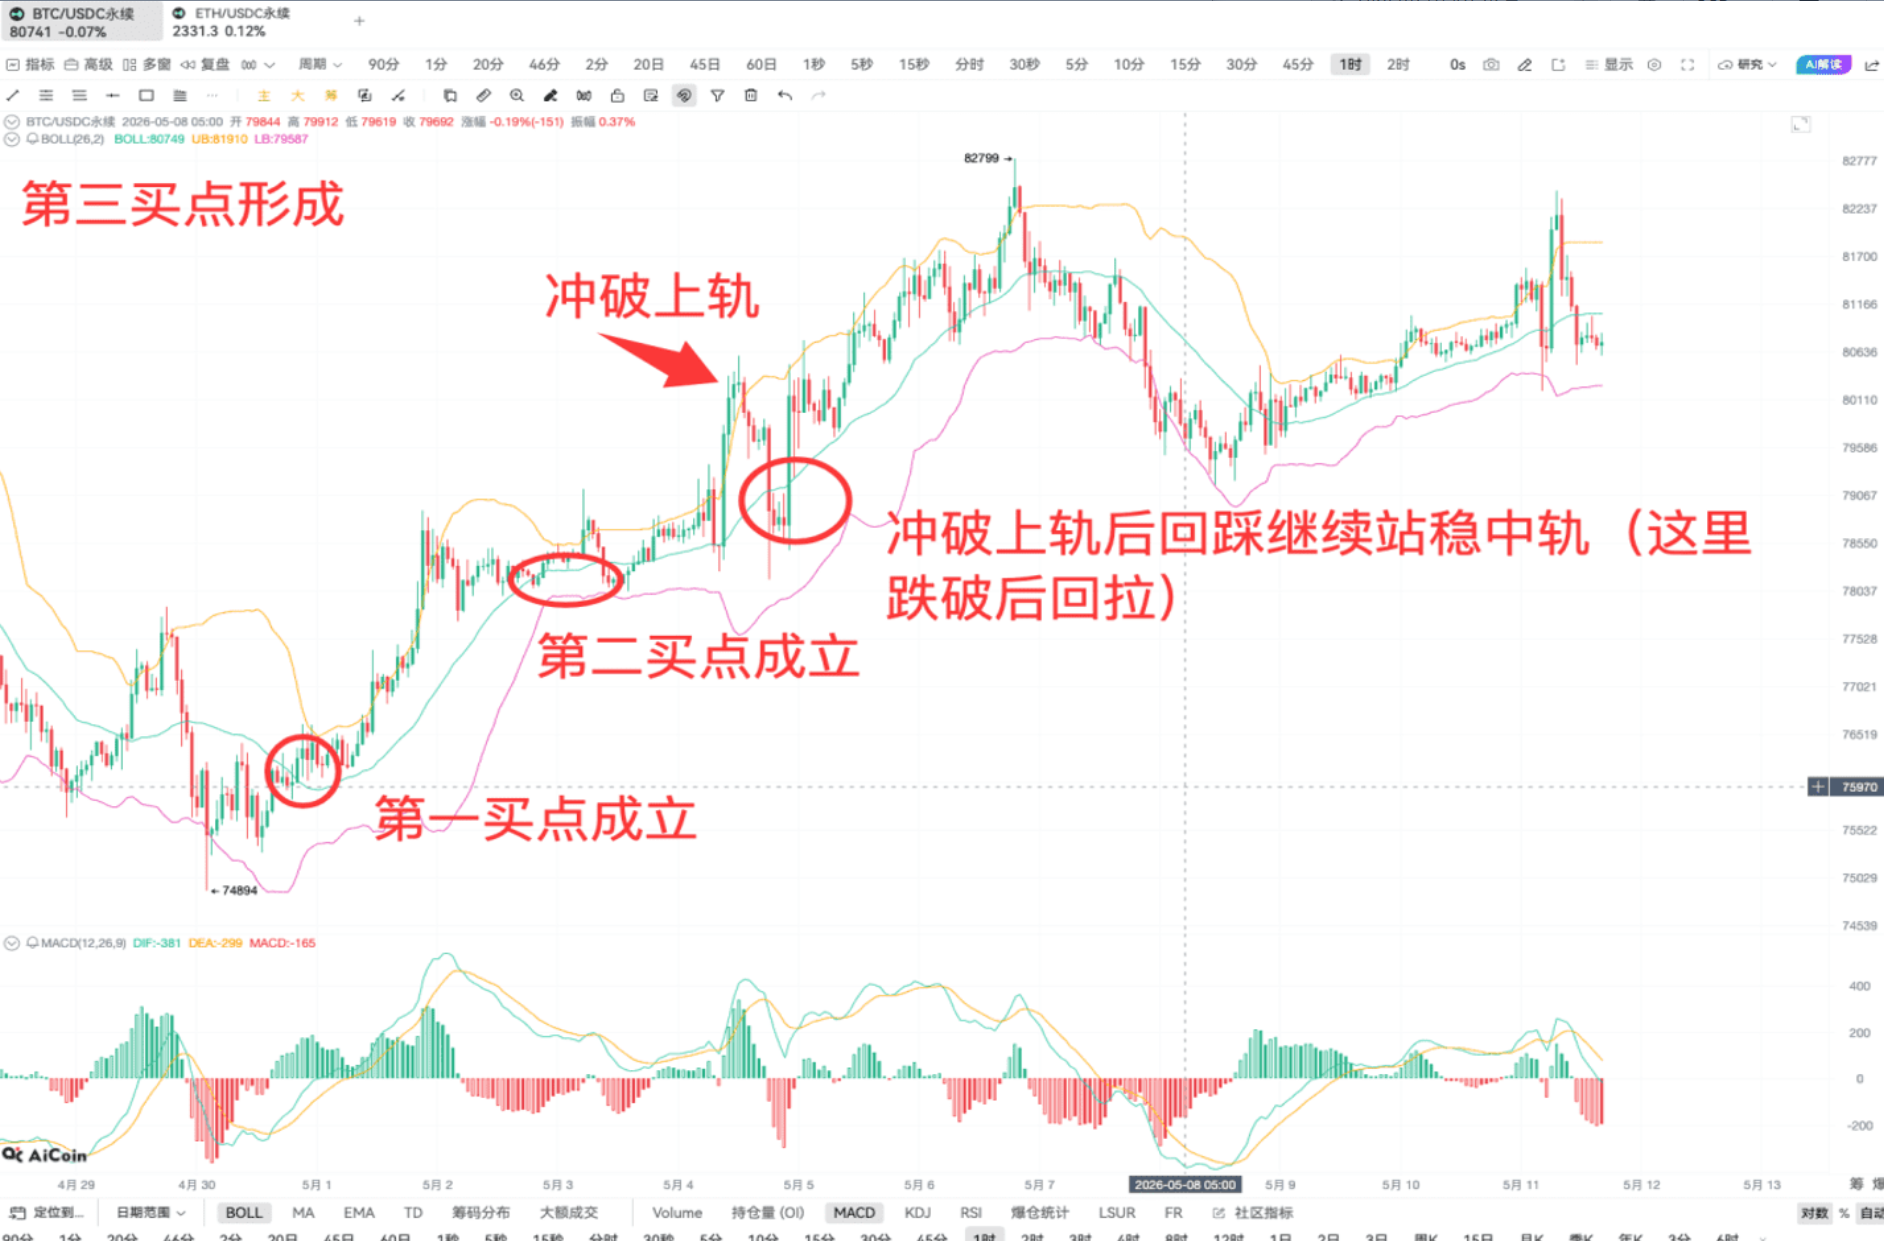
Third Buy Point (Add Position After Trend Confirmation)
Both previous buy points are now established:
-
The first buy point is established
-
The second buy point continues to be valid
-
After breaking through the upper band, retraces and stabilizes on the middle band
This is the best entry point after the trend is confirmed. 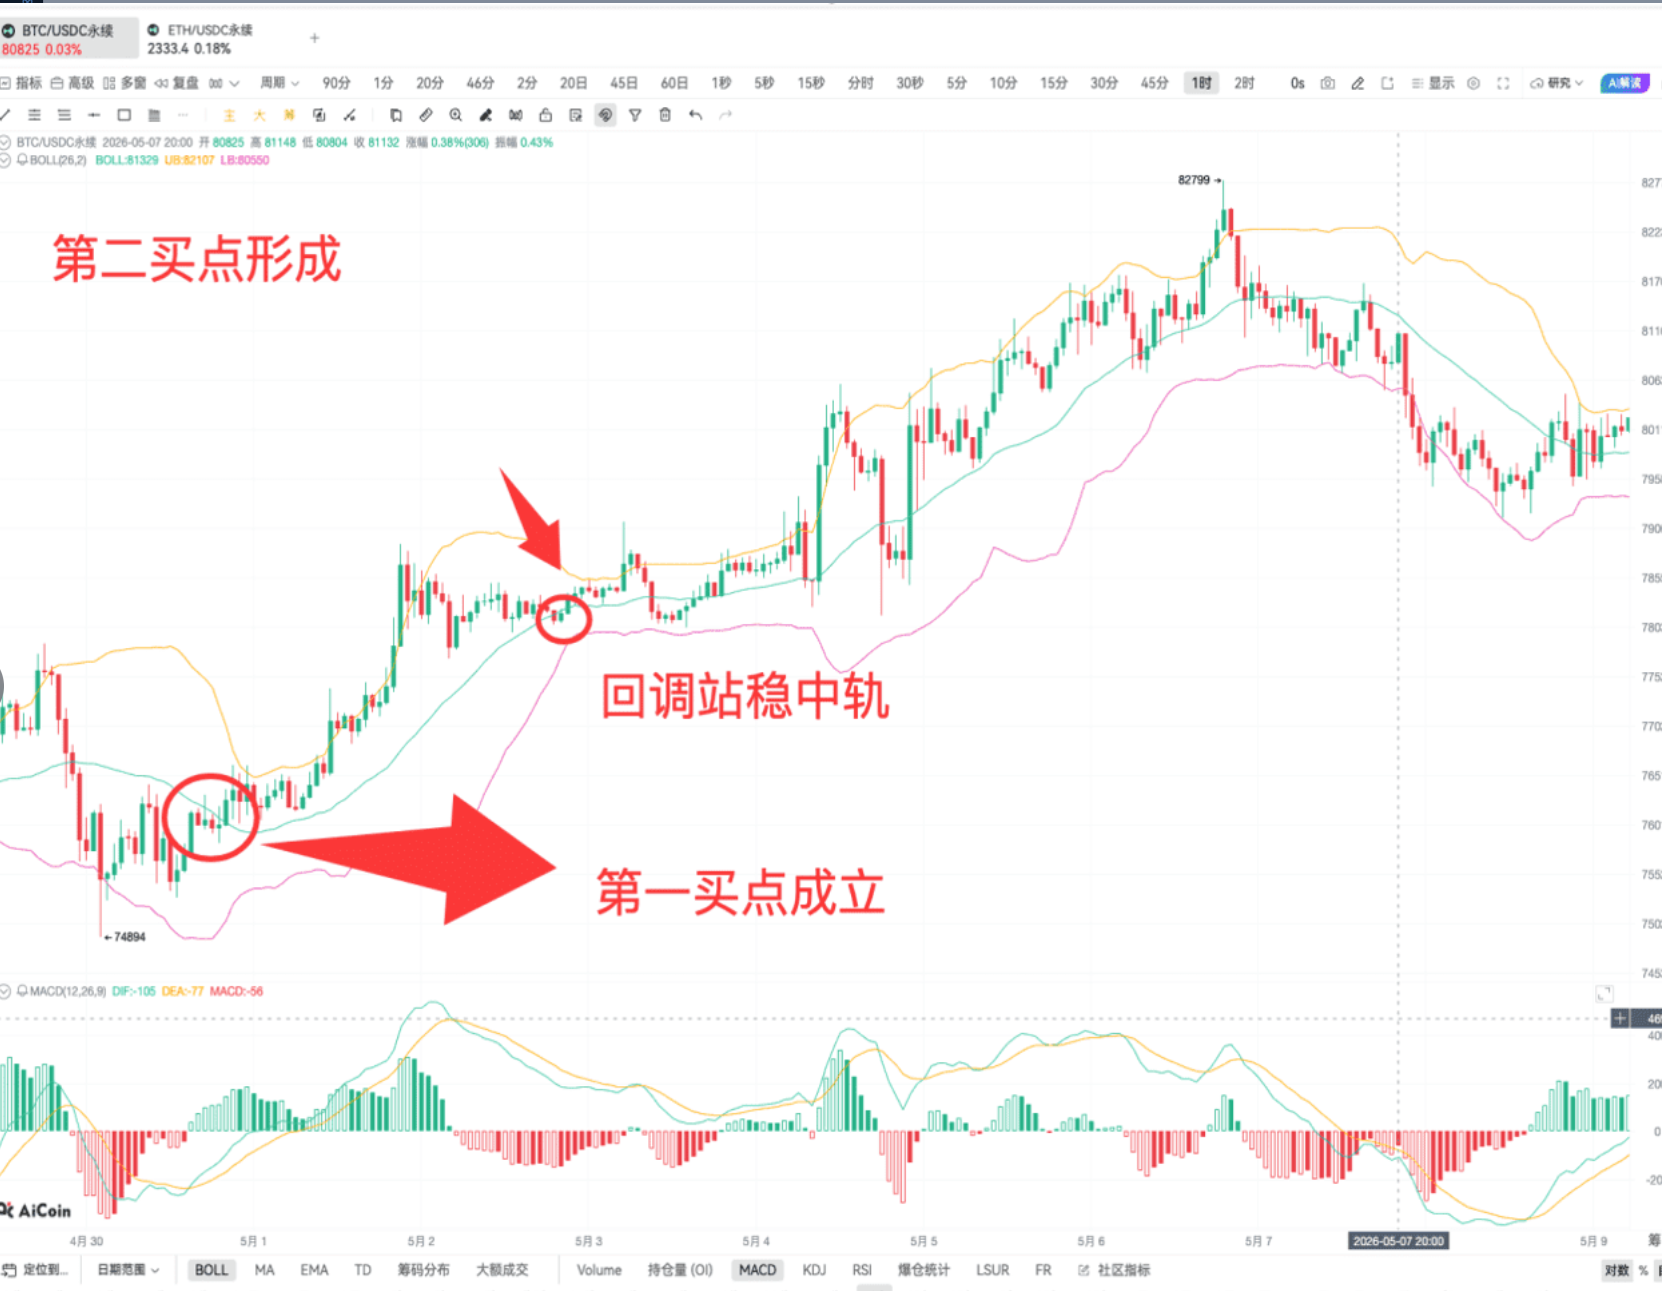
The three sell points can be understood in reverse: price running along the upper band → breaking below the middle band → confirming pressure is valid, corresponding to the three sell positions.
There isn't a lot of content, but it requires digestion. If you have the opportunity, try practicing it on a demo account; once you're proficient, it will be engraved in your mind, and you'll know what kind of advice Bollinger Bands offer when you see the candlesticks.
Finally, a reminder—candlestick trends, indicator signals, large order data, and news alerts are all reference information. Do not blindly trust any one of them; collect information from multiple sources and make independent judgments to ensure safer trading.
Currently, there are daily live broadcasts; welcome to keep following AiCoin friends! Reserve in advance👇
https://www.aicoin.com/zh-Hans/live/list?tab=upcoming
Join our community to discuss together and strengthen together!
Official Telegram community: https://t.me/aicoincn
AiCoin Chinese Twitter: https://x.com/AiCoinzh
Aster commission: https://www.asterdex.com/zh-CN/referral/9C50e2
Hype commission: https://app.hyperliquid.xyz/join/AICOIN88
Binance commission: https://jump.do/zh-Hans/xlink-proxy?id=3 invite code: aicoin668
This article only represents the author's personal views and does not represent the position or views of this platform. This article is for information sharing only and does not constitute any investment advice to anyone.
免责声明:本文章仅代表作者个人观点,不代表本平台的立场和观点。本文章仅供信息分享,不构成对任何人的任何投资建议。用户与作者之间的任何争议,与本平台无关。如网页中刊载的文章或图片涉及侵权,请提供相关的权利证明和身份证明发送邮件到support@aicoin.com,本平台相关工作人员将会进行核查。