Cryptocurrency Academy: The upward fluctuation of Ethereum (ETH) on July 23 is by no means the end. A deep analysis of the operational logic of Ethereum's mid-term trend? Latest market analysis reference.
The current price of Ethereum is 1940. Many friends have privately messaged asking if they should heavily invest in Ethereum moving forward. Here, I would like to remind everyone that there is still uncertainty in the market. The upper pressure level has not been effectively broken for a long time, and short-term risks cannot be ignored. There will always be another opportunity in the market, so do not act impulsively and go all in. Follow the existing trend with light positions and strictly implement risk control rules. Market fluctuations are normal; there’s no need to be overly pleased with short-term profits or anxious over minor losses. Maintain rational judgment, adhere to trading principles, and execute each trade solidly; that's the key to long-term profits.
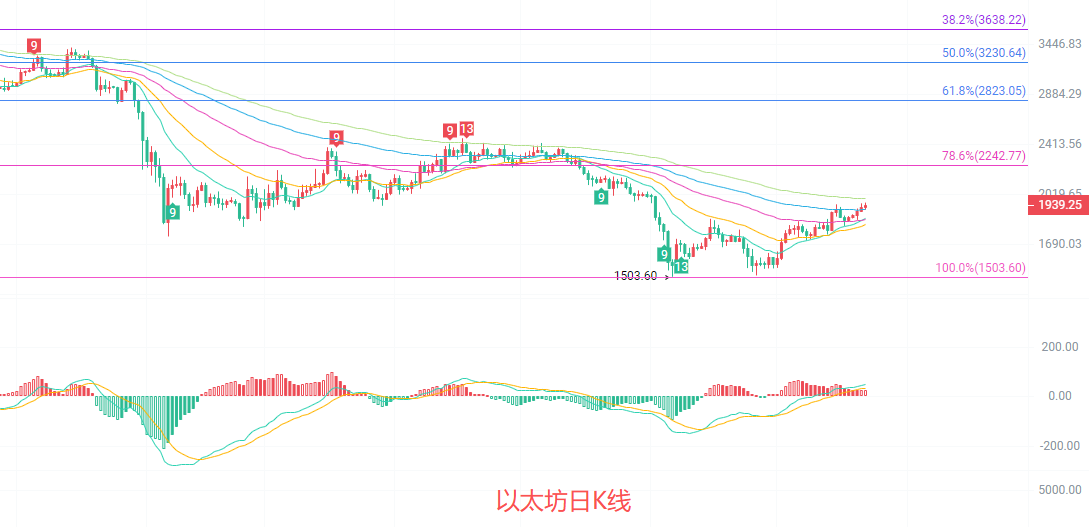
The daily candlestick is in a critical struggle zone. The price is stable above the mid-band of the Bollinger Bands at 1828 and is running above indicators such as EMA15 and EMA30, indicating a biased upward mid-term trend. The MACD indicator's DIF and DEA golden cross continues, with red bars consistently increasing, and bullish momentum is still being released. The upper strong pressure is near the Fibonacci 78.6% position around 2242, while the core support is at the previous low of around 1503. In the short term, attention should be paid to the effectiveness of the breakthrough at the 2000 round number. If it breaks above with volume, bullish space will further open up.
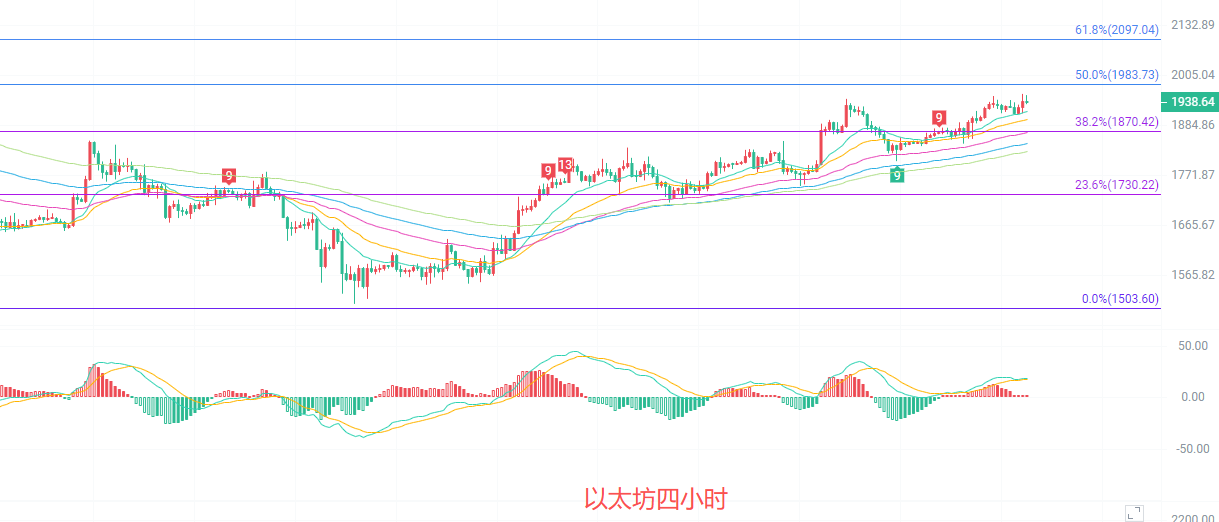
The four-hour candlestick is in an upward channel, with the price closely following the upper band of the Bollinger Bands at 1962. Short-term bullishness is strong. The EMA system shows a bullish arrangement, with EMA15, EMA30, and EMA60 sequentially moving up, providing tiered support for the price. The MACD indicator's DIF and DEA golden cross has led to a reduction in red bars, indicating short-term demand for a pullback. The Fibonacci 38.2% position at 1870 serves as strong short-term support, while the 23.6% position at 1730 is the bullish defensive bottom line. If it pulls back without breaking down, the trend will likely continue upwards.
Short-term reference:
If the bottom does not break from 1850 to 1800, go long, with a stop loss at 1760 and a target of 1930 to 1970.
If the upper does not break from 1980 to 2020, go short, with a stop loss at 2050 and a target of 1930 to 1890.
Specific operations should rely on real-time market data; for more detailed information, you can consult the author. The publication of this article may be delayed; it is recommended for reference only, with risks borne by the reader.

Friendly reminder: The above content is solely created by the author of this public account. The advertisements at the end of the article and in the comments section are unrelated to the author. Please be cautious in discerning them. Thank you for reading.
免责声明:本文章仅代表作者个人观点,不代表本平台的立场和观点。本文章仅供信息分享,不构成对任何人的任何投资建议。用户与作者之间的任何争议,与本平台无关。如网页中刊载的文章或图片涉及侵权,请提供相关的权利证明和身份证明发送邮件到support@aicoin.com,本平台相关工作人员将会进行核查。