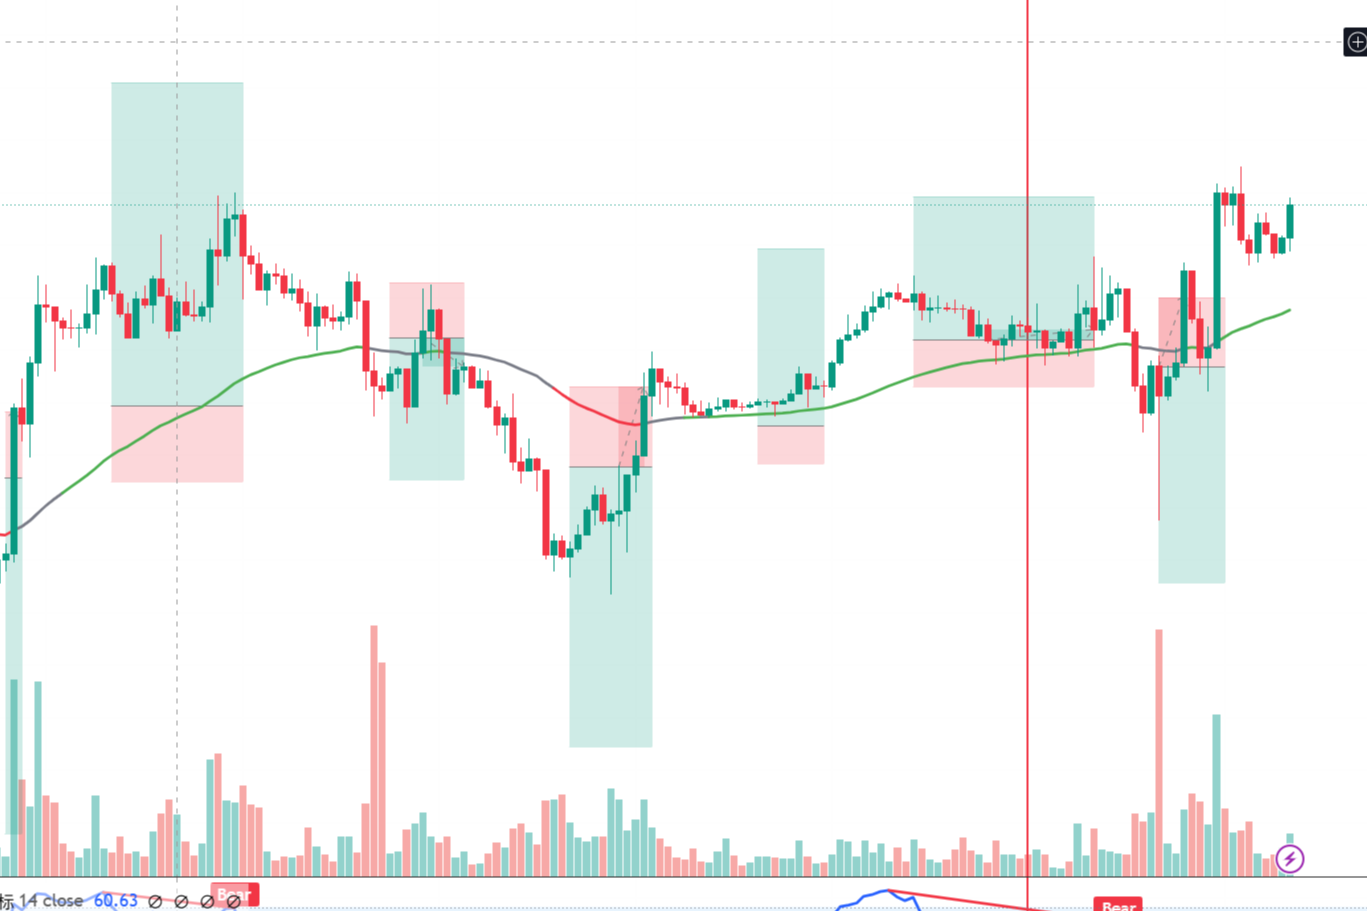
Cryptocurrency Circle Scholar: Is the sideways movement of Ethereum (ETH) on July 22 approaching its end, leading to a breakthrough market trend? Latest market analysis reference
Ethereum's current price is 1925, and this trend really illustrates the principle that slow is fast. It rises by dozens of dollars daily but never drops too deeply, leaving people almost losing their temper. Friends around me are either chasing the rise and getting trapped or regretting not buying in; but when thinking back, where in the market are there so many perfect entry points? What matters is patience. Instead of anxiously watching the market every day, it’s better to identify the trend and hold on when it rises to 1600, making gradual exits. Stay with the part of the profit you understand. Don't be greedy for the highest point, don't aim to catch the lowest point; being steady is far better than anything else.
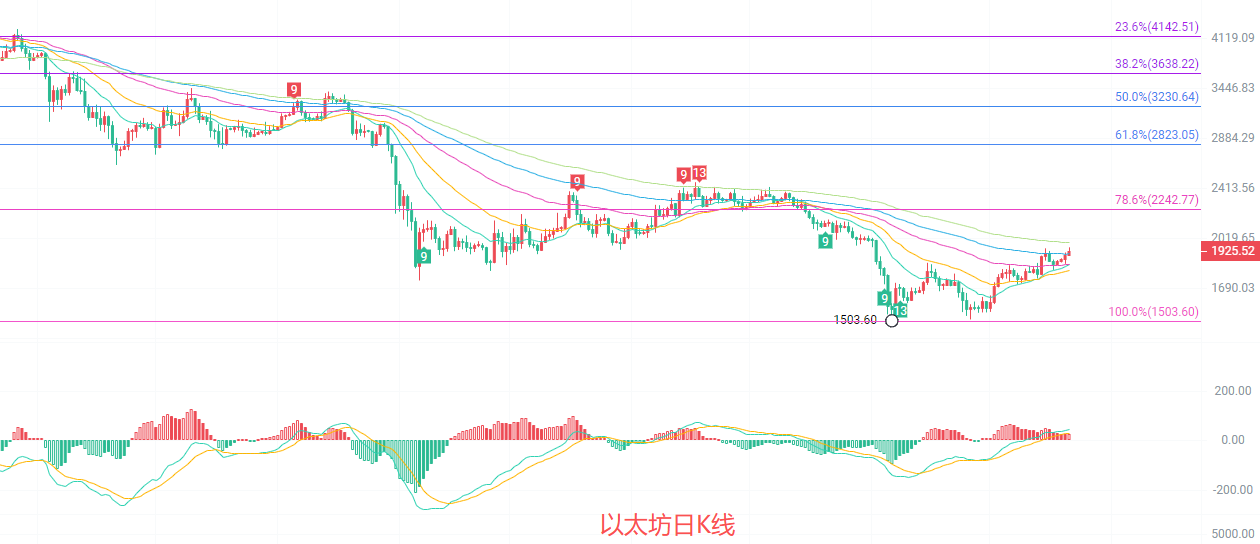
The daily K-line is at the upper bound of the Fibonacci 78.6% and 100% retracement zones from the previous downtrend. The price has climbed above the EMA15, EMA30, and other short-term moving averages, forming the beginnings of a bullish arrangement. Support is in the 1840-1860 range. The MACD indicator's red bars continue to expand, and the DIF and DEA have formed a golden cross above the zero axis, indicating an increase in bullish momentum; the middle line of the Bollinger Bands at 1815 continues to rise, with the price slowly climbing toward the upper band, overall showing a weak rebound pattern, but there remains strong resistance around 2242 above.
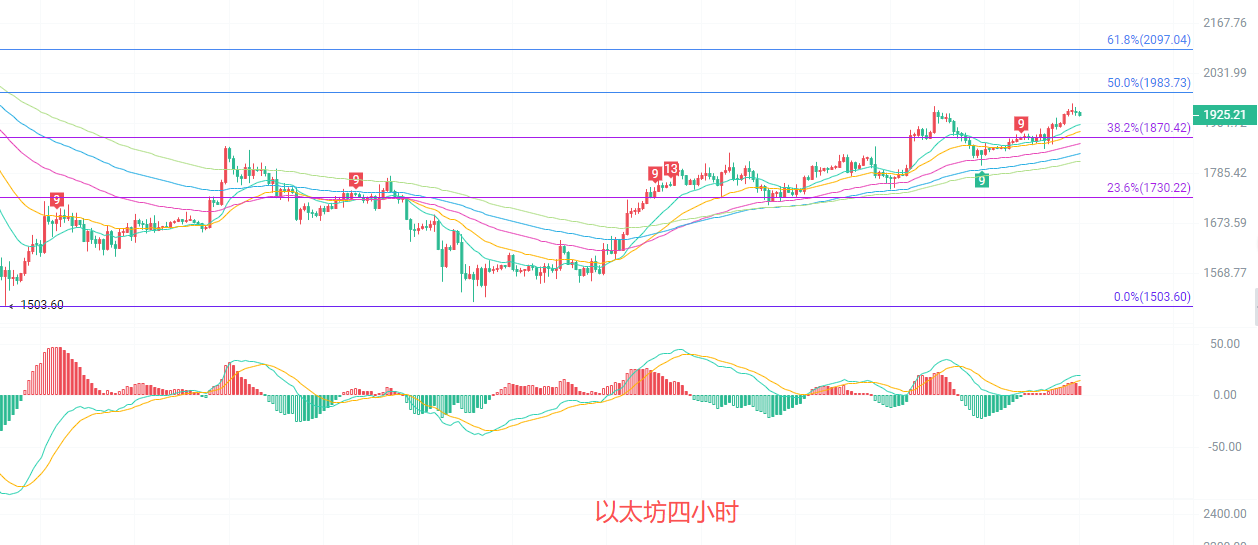
The four-hour K-line has broken above the Fibonacci 38.2% resistance level and is testing resistance near 50%. The EMA15, EMA30, and other moving averages are in a bullish arrangement, forming a short-term upward channel, with strong support at 1870-1890. Although the MACD red bars have shortened, the DIF still operates above the DEA, so bullish momentum has not completely faded; the Bollinger Bands are continuously narrowing, with prices oscillating near the upper band, facing directional choices in the short term. If it fails to break the pressure around 1983, it is highly probable it will pull back to the middle band of the Bollinger Bands in the 1880 range.
Short-term reference:
If the price does not break below 1850 to 1800, go long with a stop loss at 1760, targeting 1930 to 1970.
If the price does not break above 1980 to 2020, short with a stop loss at 2050, targeting 1930 to 1890.
Specific operations should be based on real-time market data; for more detailed information, please consult the author. The publication of the article may be delayed, and it is recommended for reference only at your own risk.

Warm reminder: The above content is solely created by the author of the public account. The advertisements at the end of the article and in the comment section are unrelated to the author. Please discern carefully, thank you for reading.
免责声明:本文章仅代表作者个人观点,不代表本平台的立场和观点。本文章仅供信息分享,不构成对任何人的任何投资建议。用户与作者之间的任何争议,与本平台无关。如网页中刊载的文章或图片涉及侵权,请提供相关的权利证明和身份证明发送邮件到support@aicoin.com,本平台相关工作人员将会进行核查。