On July 20 at 10 AM Eastern Time, the Conference Board will release the June Leading Economic Index, which is the earliest macro data published this week. It is worth paying attention to because there is a little over a week until the Federal Reserve’s interest rate meeting on July 28-29, during which the market lacks authoritative policy guidance, and this indicator provides an additional clue. It does not predict interest rates, but it measures the direction of economic momentum, making it more suitable as an auxiliary signal for recession risk, soft landing probability, and corporate profit outlook. The May reading has risen for the second consecutive month, with a six-month decline narrowing to 0.3%, but the driving force has almost entirely come from financial components like stock prices and interest rate spreads, while the non-financial aspect remains weak. The question that needs to be answered by this June data is straightforward: is the economic improvement real, or merely a reflection of asset prices?
Core Points
The official announcement from the Conference Board confirms that the next release of the US Leading Economic Index is scheduled for 10 AM Eastern Time on Monday, July 20, making it one of the earlier macro data releases this week.
The May reading was 99.3 (with 2016 as the base of 100), showing a slight increase of 0.1% month-on-month, marking a rise for the second consecutive month, with a 0.2% increase in April.
The key improvement lies in the trend: the six-month decline from November 2025 to May 2026 has narrowed to 0.3%, significantly smaller than the 1.3% contraction over the previous six months.
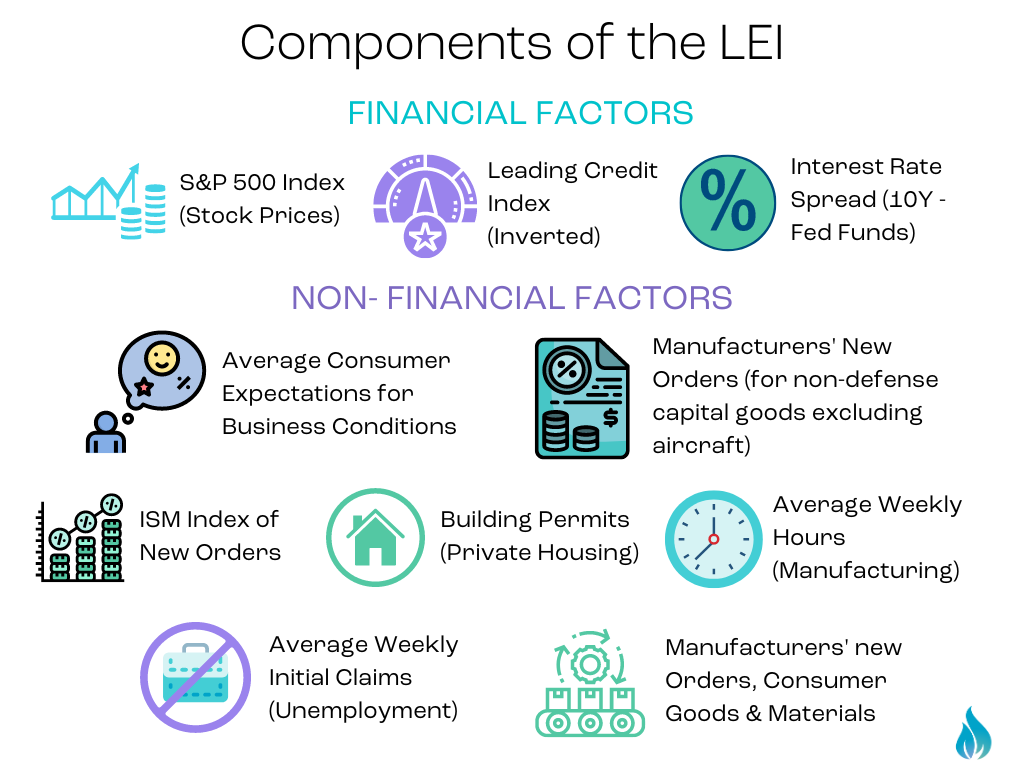
There are concerns about the driving structure, as the institution clearly stated that the rise in May was entirely due to financial components, particularly stock prices and interest rate spreads, while only the ISM new orders index showed some strength in the non-financial aspect, with consumer expectations still being a major drag.
The coincident lagging index was at 120.5, down 0.1% month-on-month, but the six-month change remained positive at 0.9%, indicating that the combination with the leading index still points to a slowdown in growth rather than a recession.
Historically, this index usually peaks 11 to 12 months before a recession begins, and the negative range of six-month growth has yet to approach the traditional recession trigger threshold of about negative 4%.
Why This Data Is Especially Important This Week
Alternative Signals in the Policy Window
The timing determines its weight. The Federal Reserve’s interest rate meeting does not take place until July 28-29, meaning there is no official policy guidance available from today until next Tuesday. During this window, any forward-looking data will be interpreted with emphasis. The Leading Economic Index consists of ten components, covering new orders, building permits, initial jobless claims, consumer expectations, stock prices, and interest rate spreads. It measures not the current economic state but the direction of momentum over the coming quarters. This is precisely why it serves as an auxiliary signal rather than a trading signal.
It Is Not Used to Predict Interest Rates
It needs to be clarified: this indicator is not suited for betting on the Fed’s next move. Among its ten components, stock prices and interest rate spreads are products of market pricing; using it to predict interest rates approaches circular reasoning methodologically. Its true usefulness lies in answering three other questions: the direction of recession risk, the credibility of the soft landing narrative, and the support strength of corporate profits in the coming quarters. These three factors may impact pricing for stocks, credit, and risk assets as much as changes in the wording of a meeting.
Foreshadowing from the May Reading
The Numbers Themselves Show Improvement
The May data released on June 18 indicates that the Leading Economic Index rose by 0.1% month-on-month to 99.3, marking its second consecutive month of increase. More importantly, the six-month change shows that the decline from November 2025 to May 2026 was only 0.3%, compared to a contraction of 1.3% in the previous six months. The decline has narrowed by three-quarters, representing the most significant trend improvement since 2025.
But the Driving Structure Is Unhealthy
In the same announcement, the institution provided a candid caveat. Business cycle indicators Senior Manager Justyna Zabinska-La Monica explicitly stated that the rise in May was entirely driven by financial components, especially stock prices and interest rate spreads; the non-financial aspect only showed some strength in the ISM new orders index, while consumer expectations remain a major drag. She also emphasized that despite rising for two consecutive months, the six-month and twelve-month growth rates of the index remain negative, indicating a deceleration in future economic expansion.
This structural issue is key to understanding the June data. If the improvement in June continues to rely on stock prices, then this indicator reflects an increase in asset prices rather than a recovery in the real economy. A truly convincing signal would involve non-financial components like consumer expectations, new orders, or building permits beginning to turn positive.
How to Interpret Recession Signals and the Soft Landing Narrative
Three Assessment Dimensions
The institution evaluates the severity of downward signals based on three dimensions: duration, magnitude of decline, and degree of diffusion. Historical patterns indicate that the Leading Economic Index usually peaks 11 to 12 months before a recession begins. The Recession Dashboard tracking shows that, despite the current negative six-month growth rate, it is well above the traditional recession trigger level of about negative 4%, with the institution’s assessment pointing to a slowdown rather than a recession.
Another technical detail worth noting is whether the diffusion index falls below 50. There was a period mid-2025 where this index was below 50 for several months, triggering a recession signal; recent readings indicate that this pressure has eased. The position of the diffusion index in the June data serves as a direct window for assessing the strength of the signal.
Combined Reading with Lagging Index
Looking at the Leading Index alone can lead to distortions, making it more reliable to read it in conjunction with the lagging index. The May lagging index was at 120.5, down 0.1% month-on-month, but the six-month change is +0.9%, showing a clear improvement compared to the previous six months’ stagnation. A weakening Leading Index combined with a strengthening lagging index is typical cyclical late-stage behavior, usually associated with a slowing growth rate but not yet a stall, representing what the market calls a soft landing scenario. If the Leading Index shows improvement in June while the lagging index weakens, it would signify more substantial changes in the cyclical position.
What It Means for Investors
Three Transmission Paths
The first is the corporate profit path. New orders and consumer expectations lead corporate revenues by about two to three quarters, and their direction directly affects management’s outlook for the second half of the forthcoming earnings season. The second path is the risk appetite pathway. If the data confirms the soft landing narrative, the valuation tolerance for risk assets will increase; if the non-financial components continue to deteriorate, the market will begin to price for profit downgrades. The third path is policy expectation. Although this indicator does not directly influence the July decision, it will impact market pricing for the paths after September.
For cross-asset investors, macro turning points often manifest first in these forward-looking indicators before transmitting to risk assets. Digital assets are similarly affected by this chain, and investors tracking macro variables in conjunction with cryptocurrencies can observe price reactions during risk appetite shifts on MEXC.
Potential Risks and Points of Observation
There are three types of risks. The first is interpretation risk. This is a monthly indicator, and the noise of monthly fluctuations is significant; the six-month growth rate and diffusion index provide more informative content than the month-on-month figures, making it easy to draw erroneous conclusions based on just one month’s direction. The second is structural risk. If the improvement continues to be driven by stock prices, once the stock market corrects, the index will quickly reverse; this type of improvement supported by asset prices lacks resilience. The third is lagging risk. Historically, this indicator peaks 11 to 12 months before a recession, meaning it excels at indicating direction but not timing, making timely trading using this indicator almost inevitably unsuccessful.
Additionally, it is essential to monitor whether this publication includes annual benchmark revisions. Historically, such revisions re-calculate the complete historical series of the index, making it impossible to directly compare the revised level and month-on-month changes with previously published data, a technical trap that is easily overlooked during interpretation.
MEXC Crypto Pulse Research Team's Exclusive Perspective
The true importance of this data lies not in its ability to predict a recession, but in quantifying a sharply pointed question at present: whether the economic improvement is real or merely a self-reinforcing result of financial asset prices. The May reading already provided an uncomfortable answer, with the increase entirely attributed to stock prices and interest rate spreads. When an indicator measuring the outlook for the real economy is primarily propped up by asset price factors, it loses its informational value independent of the market to some extent. Whether the June data can break this cycle is far more important than just a few percentage points rise or fall in the reading itself.
There are two points where the market may misinterpret. First, misjudging two consecutive months of increase as a confirmation of a turning point. The six-month and twelve-month growth rates remain negative, and these smoothed indicators are the arbiters of trend; the month-on-month noise is far greater than the signal. Second, treating this indicator as a forward guide for the Federal Reserve’s actions to trade. The ten components already embed market-based pricing; deriving policy paths from it entails circular reasoning, and the risk lies in mistaking market sentiment for independent evidence.
What investors should focus on next is not the headline reading but the component structure: whether the non-financial components, particularly consumer expectations and new orders, start contributing positively. If this turns positive, it would confirm the soft landing narrative on the real side; if it continues to drag, then the current improvement is just a byproduct of the stock market rally, entirely dependent on the risk assets themselves.
The insight for the cryptocurrency and cross-asset market is that during policy windows, the market's sensitivity to any forward-looking data will systematically increase. Digital assets, as high-beta varieties of liquidity and risk appetite, often exhibit more violent fluctuations than stocks at these points. Understanding the transmission chain of macro data is more valuable than chasing fluctuations in a single number. This is why, during the week before the interest rate meeting, comprehending the structure of the leading indicators is more crucial than memorizing its value.
Frequently Asked Questions
When will the US Leading Economic Index be released?
The Conference Board is set to release the June reading on July 20, 2026, at 10 AM Eastern Time, making it one of the earlier macro data published this week. The last release was on June 18, which included May data. This index is published monthly, typically alongside coincident and lagging economic indices, and investors can access the full press release and component data via the institution's official website.
What does this index specifically measure?
It consists of ten components, covering new orders in manufacturing, building permits, initial jobless claims, consumer expectations, stock prices, and interest rate spreads, designed to signal peaks and troughs in the economic cycle. It does not measure the current economic state but the direction of momentum over the next several quarters. Historical patterns show that this index typically peaks 11 to 12 months before a recession begins, making it more suitable for directional judgment rather than timing.
What was the last reading's level?
The May reading was 99.3 (with 2016 as the base of 100), showing a slight increase of 0.1% month-on-month, marking a rise for the second consecutive month, with a 0.2% increase in April. More noteworthy is the trend improvement: the decline from November 2025 to May 2026 narrowed to 0.3%, significantly lower than the 1.3% contraction in the prior six months. However, the institution clearly pointed out that the rise was entirely driven by financial components such as stock prices and interest rate spreads, and the six-month and twelve-month growth rates remain negative.
Will this data impact the Fed's decision in July?
The direct impact is limited. The Federal Reserve's interest rate meeting is scheduled for July 28-29, with decisions mainly based on inflation and employment data. Among the ten components of this index are products of market pricing, like stock prices and interest rate spreads, making it circuitously problematic to deduce policy paths from it. It is more suitable as an auxiliary signal for recession risk, soft landing probability, and corporate profit outlook rather than a tool for interest rate prediction.
Does the current reading indicate an increase in recession risk?
The institution's current assessment is slowdown rather than recession. Although the six-month growth rate is still negative, it is far above the traditional recession trigger level of about negative 4%, with the decline starting to narrow. Meanwhile, the lagging index shows a six-month positive change of 0.9%, indicating that the combination with the leading index suggests a slowdown in growth but not yet a stall. Assessing recession signals requires a comprehensive view of duration, magnitude of decline, and degree of diffusion across three dimensions; single-month data is insufficient for conclusions.
Which components should investors focus on?
The component structure provides more informative content than the headline reading. Most critical is whether the non-financial components can turn positive, especially consumer expectations and new manufacturing orders, as the former currently serves as the major drag, and the latter leads corporate revenues by about two to three quarters. If these components start contributing positively, it would signify that the soft landing narrative has been confirmed by the real side. If the improvement continues to be driven by stock prices, should there be a correction in the stock market, the index would reverse rapidly, as such improvements lack resilience.
What is the relationship between this macro indicator and the cryptocurrency market?
The connection lies in the transmission of risk appetite. Digital assets are high beta varieties of liquidity and risk appetite, and the direction of macro momentum will impact cryptocurrency pricing through a risk appetite channel. During periods of Federal Reserve policy windows, market sensitivity to any forward-looking data will increase, and cryptocurrencies often display more extreme volatility than stocks at these times. Furthermore, if the data indicates pressure on corporate profits, the overall valuation tolerance for risk assets will decrease, affecting digital assets similarly.
Disclaimer
This content is for informational reference and research discussion purposes only and does not constitute any investment advice, financial advice, legal advice, tax advice, or trading recommendations. Prices of cryptocurrencies, stocks, and related financial assets may experience significant volatility; macroeconomic indicators may be revised and lagged; historical patterns do not guarantee future results. The cited third-party data and institutional announcements may have delays, revisions, or errors, and readers should verify on their own. Any investment decisions should be based on independent research, financial conditions, and risk tolerance, and when necessary, consult licensed professionals. The MEXC Crypto Pulse team is not responsible for any direct or indirect losses arising from the use of information contained in this content.
免责声明:本文章仅代表作者个人观点,不代表本平台的立场和观点。本文章仅供信息分享,不构成对任何人的任何投资建议。用户与作者之间的任何争议,与本平台无关。如网页中刊载的文章或图片涉及侵权,请提供相关的权利证明和身份证明发送邮件到support@aicoin.com,本平台相关工作人员将会进行核查。


