This week, Bitcoin continues to rebound above the low point of $57,820, with the price approaching the critical resistance zone of $65,700 to $67,300. The battle between bulls and bears has entered a fevered stage—if the rebound is blocked and falls back in this area, a daily level adjustment may return; if it can effectively break through, the short-term structure will shift towards a stronger bullish logic. HYPE continues its adjustment trend since the high point of $72.97, with this week's focus on the competition results in the $62 to $63.5 area. The medium-term maintains a bearish dominant view, while the short-term strictly relies on model signals, preparing for dynamic switching between plan A and B.
This week's core trading points summary:
- BTC multi-period trend structure analysis (detailed explanation in the first part)
- BTC market forecast and medium-short term operational strategy this week (detailed explanation in the second part)
- HYPE hourly level trend structure analysis (detailed explanation in the third part)
- HYPE market forecast and short-term operational strategy this week (detailed explanation in the fourth part)
Last week's trading strategy and core points market validation:
- BTC market trend prediction market validation: It was clearly stated in last week's article that Bitcoin's daily line had entered a consolidation pattern in the short term. The upward market trajectory verified our prediction.
- BTC short-term trading results: Bitcoin completed a short-term long position operation last week (1x leverage), successfully achieving a profit of about 3.45%. (Detailed explanation in the fifth part)
- HYPE market trend prediction market validation: It was clearly stated in last week's article that if the price rebounded at the beginning of the week but could not break the previous high of $72.97, this trend implies that the existing upward trend has reversed, and the price might embark on a daily level adjustment from the high point of $72.97. Currently, the market trend aligns highly with our judgment.
1. Bitcoin multi-period trend structure analysis
1. Bitcoin daily level trend structure analysis: (Based on market analysis after May 6)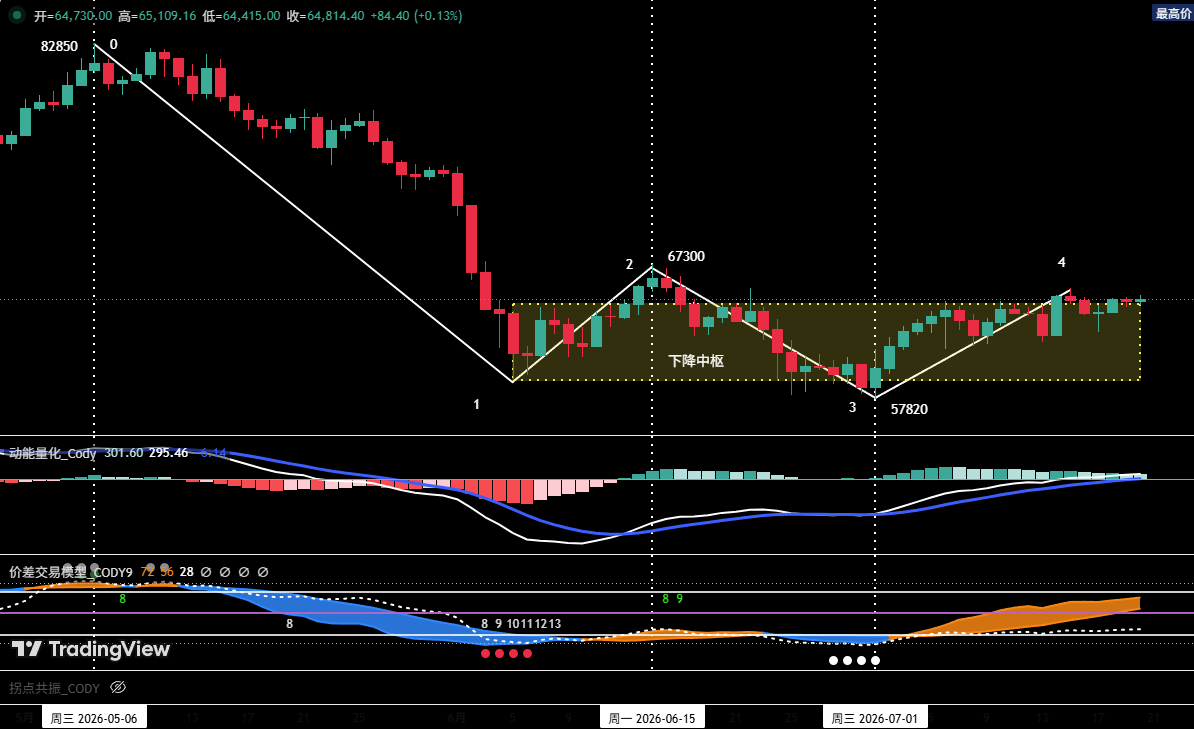 Figure 1 Bitcoin daily candlestick chart
① As shown in (Figure 1): The adjustment trend that started from the high point of $82,850 on May 6 has presented a four-part adjustment structure (0-1), (1-2), (2-3), (3-4) on the daily line.
② After touching the low point of $57,820 on July 1, the current market is in the rebound phase of (3-4), and the rebound peak has reached $65,600, with the price approaching the critical resistance at $65,700. It appears that this rebound phase may not have ended, and the recent high point of $65,600 is very likely not the "endpoint 4" finishing point.
③ If the (3-4) rebound phase shows clear signs of pressure and stagnation around the $65,700 to $67,300 area, then the first segment of the daily level rebound starting from the low point of $57,820 on July 1 (i.e., wave a) may end.
2. In-depth analysis of Bitcoin hourly level trend structure: (Using 4 hours as the analysis cycle)
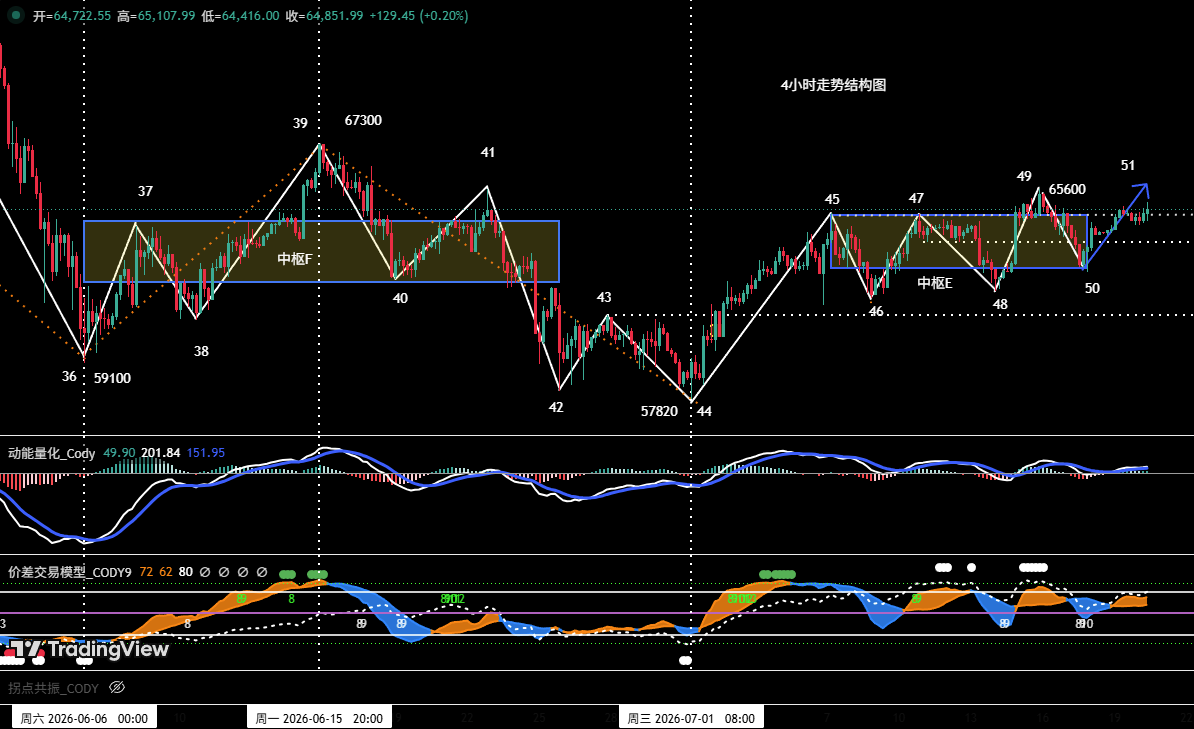 Figure 2 Bitcoin 4-hour candlestick chart
① In the 4-hour chart, the rebound that started from the low point of $57,820 on July 1 has clearly presented a seven-segment structure from (44-45) to (50-51). Among them: due to the overlap of five segments (45-46), (46-47), (47-48), (48-49), and (49-50), it forms a "five-segment" central E.
② According to the current trend structure analysis, the price is running in the (50-51) rebound segment.
- If the price effectively breaks through the $65,700 resistance and the rebound continues, the probability of this segment upgrading to a central exit segment greatly increases, at which point it is necessary to compare its momentum relationship with the central entrance segment (44-45). If at "endpoint 51" a momentum divergence can be formed between them, then the rebound starting from "endpoint 44" (approximately $57,820) may end, and the probability of a subsequent adjustment significantly increases.
- If the rebound cannot effectively break through the $65,700 resistance, then the short-term probability of maintaining a range-bound oscillation is significant.
2. Bitcoin market forecast and operational strategy this week
1. BTC market trend forecast this week:
The core view this week: Pay close attention to the test results when the price rebounds to the critical resistance area of $65,700 to $67,300.
2. Core resistance level:
- First resistance area: $65,700 to $67,300 (previous important resistance area)
- Second resistance area: $69,500 to $71,000 (previous important resistance area)
3. Core support level:
- First support level: Around $64,700 (previous important support level)
- Second support level: $60,950 to $62,000 (previous important support level)
- Third support level: Around $57,820 (previous important support level)
4. Operational strategy for this week (excluding sudden news impacts)
① Medium-term strategy:
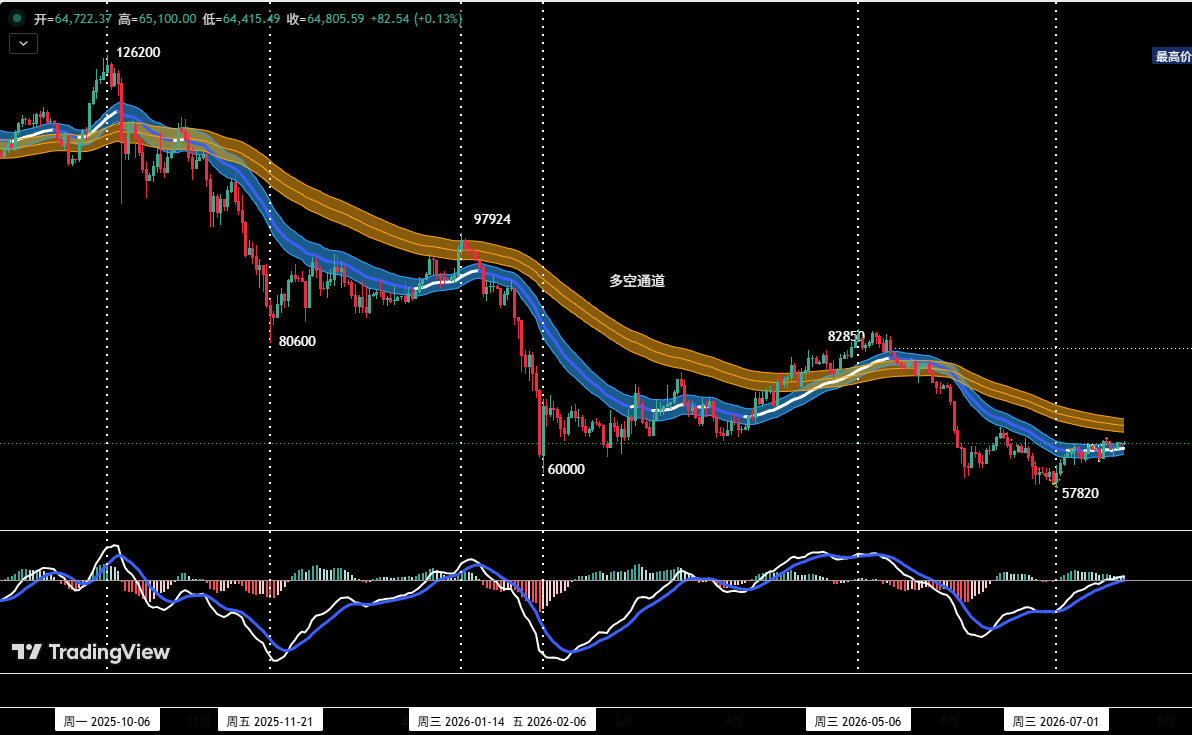 Figure 3 Bitcoin daily candlestick chart: (position monitoring model)
Position monitoring model: As shown in (Figure 3), the current price has effectively broken through the "bull-bear channel", confirming the market structure has shifted to a bearish dominant pattern.
- The current medium-term bearish position is temporarily maintained at about 20%.
- If the price rebounds to the $65,700 to $67,300 area and shows signs of stagnation, combined with the self-constructed quantitative model top signal, consider increasing the medium-term bearish position to below 50%.
② Short-term strategy:
Utilize 30% position, set stop-loss points, based on support and resistance levels, to look for "spread" opportunities. (Using 30 minutes / 60 minutes as the operational cycle)
③ For short-term operations, to dynamically respond to the complex evolution of the market, we have drafted two specific operational plans A/B in advance.
Plan A: Tentative short position at strong resistance area
- Opening position: If the price rebounds to the $65,700 to $67,300 area and meets resistance, combined with the quantitative model top signal, a short position of about 30% can be established.
- Risk control: Set initial stop-loss position.
- Closing position: When adjusted near the important support level and combined with the quantitative model signal, gradually close positions to take profits.
Plan B: Light long position at strong support area
- Opening position: After the price rebounds to the $65,700 to $67,300 area and meets resistance and falls back. If a stop-dip stabilization signal appears above the previous low of $57,820 and combined with the quantitative model bottom signal, establish a long position of about 30%.
- Risk control: Set initial stop-loss position.
- Closing position: When the rebound approaches the important resistance level and combined with model signals, gradually close positions to take profits.
3. HYPE hourly level trend structure analysis
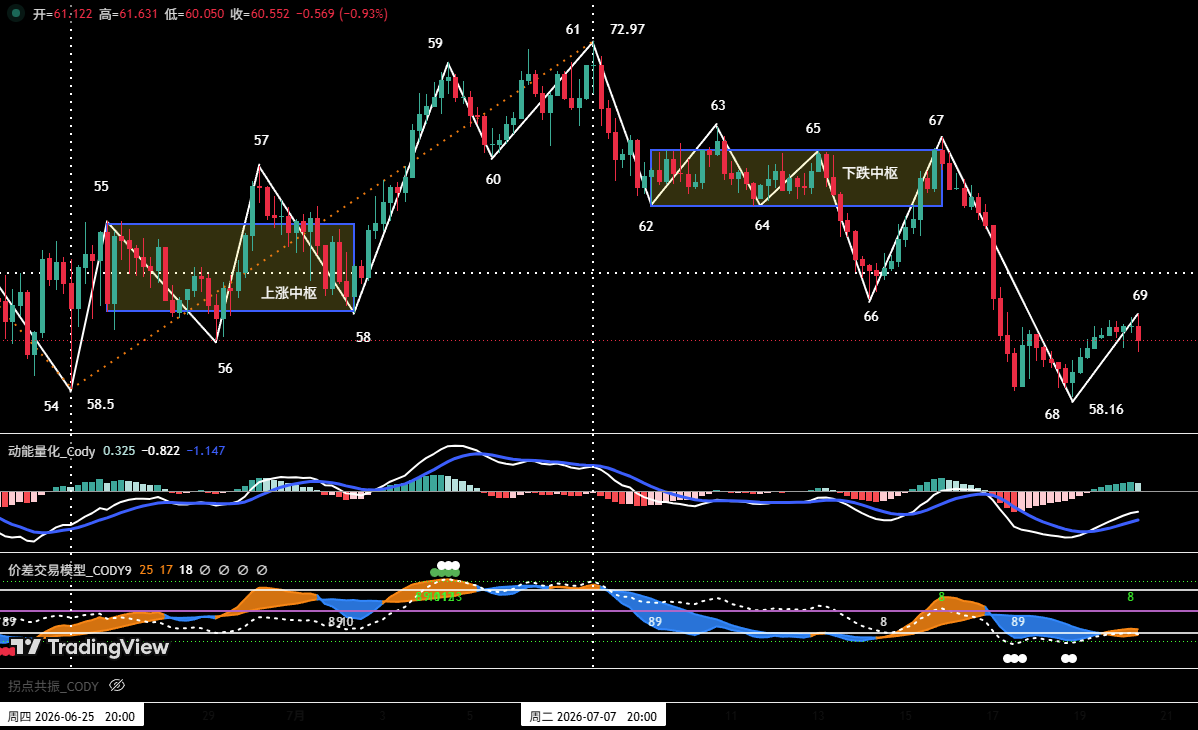 Figure 4 HYPE 4-hour candlestick chart
1. As shown in (Figure 4), the adjustment that started from the high point of $72.97 (endpoint 61) on July 7 can be subdivided into an eight-segment adjustment structure within the 4-hour cycle. Among them, 62-63, 63-64, 64-65, 65-66, and 66-67 form five overlapping segments, constituting a "five-segment" downward central.
2. In the previous weekly evaluation, it was indicated that when the market subsequently runs the (62-63) rebound segment, if "endpoint 63" cannot break through the previous high "endpoint 61" ($72.97), this trend implies that the upward trend from "endpoint 54 to endpoint 61" on the daily line has ended, and the market will soon embark on a daily level adjustment from "endpoint 61". Last week, the market followed expectations and began to adjust, dropping from "endpoint 63 to endpoint 68," with a maximum drop of about 16.17% during this period.
3. Based on the 4-hour chart analysis:
By comparing the central exit segment (67-68) with the entrance segment (61-62), it is found that the downward momentum of the exit segment is significantly greater than the former, indicating that the probability of "endpoint 68" ($58.16) being the low point of this adjustment is relatively small. The current market is running in the (68-69) rebound segment, and the price may soon have new low adjustments.
4. HYPE market forecast and short-term operational strategy this week: (07.20 to 07.26)
1. HYPE market trend forecast this week:
① Core resistance levels:
- First resistance level: $62 to $63.5 area
- Second resistance level: $68 to $69.5 area
- Third resistance level: Near $72.97
② Core support levels:
- First support level: Near $58.16
- Second support level: $52 to $55 area
This week's core view for HYPE: Pay attention to the test results when this rebound reaches the $62 to $63.5 area.
2. HYPE short-term operational strategy this week:
If the price rebounds to the $62 to $63.5 area or a higher resistance area showing clear adjustment signals, it is recommended that investors consider entering with a light position for shorting, strictly adhering to stop-loss discipline, and controlling the position within 30%.
5. Bitcoin short-term operation recap
We strictly followed the operational plan, based on the signals emitted by our self-constructed "spread trading model" and "momentum quantification model," completing a short-term (long) operation last week, achieving total trading profits of about 3.45%.
1. Short-term trading record: (see Table 1)
Summary of short-term Bitcoin trading details: (leverage x1)
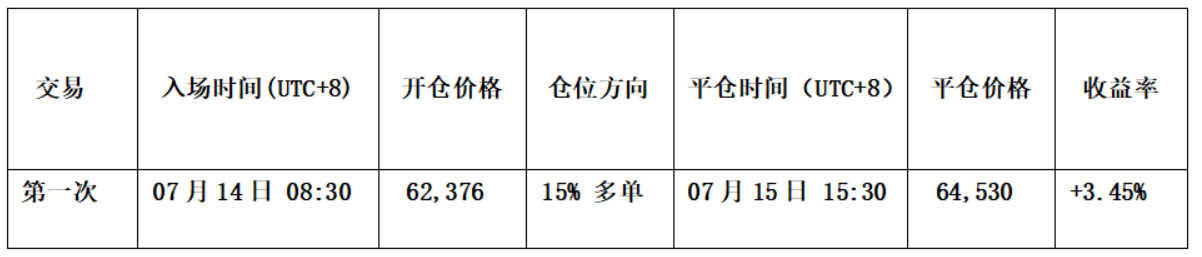
Table 1
2. Short-term trading recap: (see Figure 5)
Opening strategy:
a. When the price adjusts above $61,000, a stop-dip stabilization signal appears, and the K-line forms a "bottom formation";
b. The "momentum quantification model" forms a bottom divergence signal;
c. The "spread trading model" triggers strong bottom warning signals (white point + red point), and the signal band in the chart (orange-yellow) breaks through the horizon (purple-red), issuing a bottom rebound signal.
Therefore, we established a 15% long position at $62,376.
Closing strategy:
a. When the price rebounds to near $65,700 and shows signs of stagnation, the K-line forms a "top formation";
b. The "spread trading model" continuously triggers top warning signals (white point + green point), and the signal band in the chart (blue) breaks the skyline (green) and forms a top resonance signal with the "momentum quantification model".
Thus, we closed all positions near $64,530.
Summary: This trade successfully achieved a profit of about 3.45%.
3. Short-term trading illustration
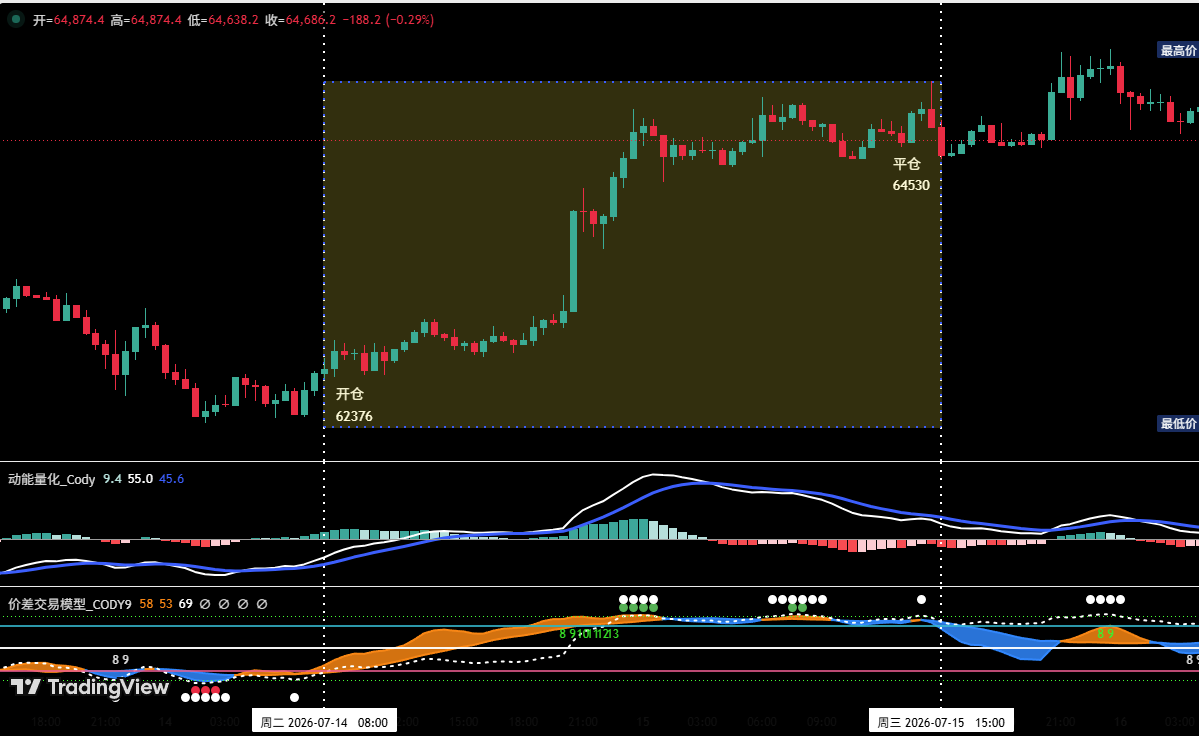 Figure 5 BTC 30-minute candlestick chart: (momentum quantification model + spread trading model)
6. Special reminders:
- When opening a position: Immediately set the initial stop-loss position.
- When profit reaches 1%: Move the stop-loss position to the opening cost price (breakeven point) to ensure capital safety.
- When profit reaches 2%: Move the stop-loss position to the profit of 1% position.
- Continuous tracking: After this, every time the price profits another 1%, the stop-loss position will be moved 1% accordingly to dynamically protect and lock in profits.
The financial market changes rapidly, and all market analysis and trading strategies need to be dynamically adjusted. All viewpoints, analytical models, and operational strategies mentioned in this article originate from personal technical analysis and are for personal trading logs only and do not constitute any investment advice or operational basis. The market has risks; investment should be cautious, please do not make decisions based on this.
免责声明:本文章仅代表作者个人观点,不代表本平台的立场和观点。本文章仅供信息分享,不构成对任何人的任何投资建议。用户与作者之间的任何争议,与本平台无关。如网页中刊载的文章或图片涉及侵权,请提供相关的权利证明和身份证明发送邮件到support@aicoin.com,本平台相关工作人员将会进行核查。


