Market Analysis (only market interpretation, no operation suggestions)
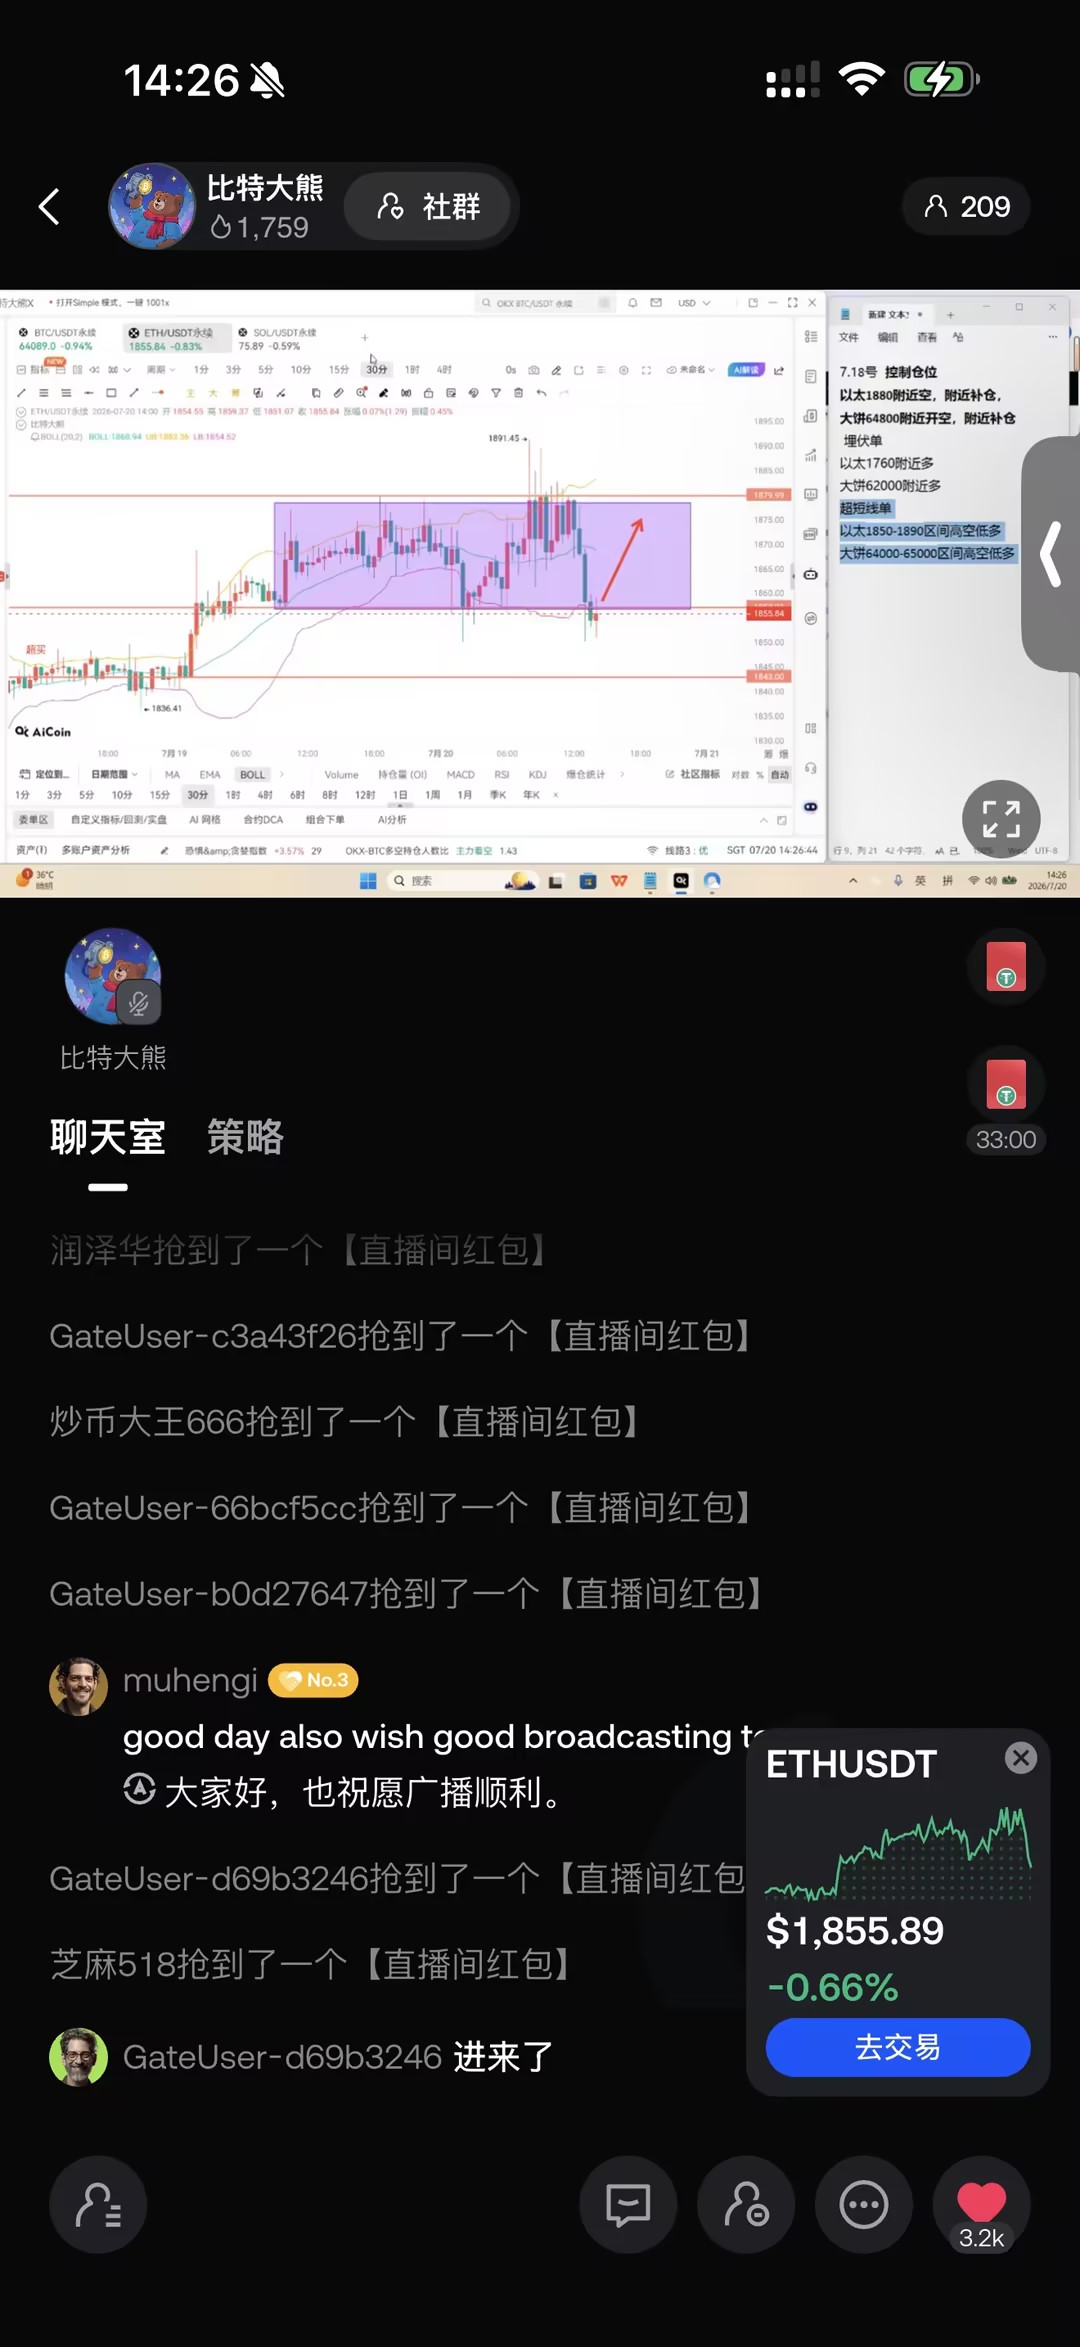
1. ETH 30-Minute Cycle Market Structure
1. Box Oscillation Pattern
Prices have long been trapped in the purple box area between 1850-1890. In the early stages, there were multiple upward attempts to break through the upper edge of the box but met resistance and fell back. Each time the price tested the lower edge of the box, it received support, which is a typical high-level horizontal consolidation trend.
In the morning session, prices surged to test the resistance at the top of the box, but the bulls could not stabilize above the upper boundary of the range, quickly retreating to test the support at the lower edge of the box, leading to a tug-of-war between bulls and bears at this position.
2. Volume and Capital Signals
During the high phase, trading volume temporarily increased, but the subsequent rebound saw the volume of buyers shrink continuously, indicating significant selling pressure above, with insufficient momentum for the bulls to continue their upward push; when falling back to the lower bounds of the box, buyers stepped in slightly to provide support, so the price did not lead to a significant breakdown. The oscillation structure remains solid.
3. Indicator Performance
Short-term moving averages are entangled and flat, while the Bollinger Bands are tightening, corresponding to narrow fluctuations in the market; fast and slow indicators have entered a state of adhesion, with bulls and bears temporarily in a state of balance, waiting for a directional breakout decision.
2. Key Support & Resistance Division
• Upper Resistance: First resistance at 1875, strong resistance at the upper boundary of the box at 1890, which is also the core threshold that has repeatedly encountered resistance during upward attempts;
• Lower Support: Short-term support at 1855, strong support at the bottom of the box at 1850, this position is the defensive bottom line for this round of oscillation.
3. Future Market Trend Projections
The current phase is a continuation consolidation stage after a rise:
① If the price stabilizes above the upper edge of the box at 1890, the horizontal structure will break, and a new round of upward movement will begin;
② If it breaks below the bottom support at 1850, the oscillation pattern will fail, and the price will begin a significant downward correction;
At this stage, there are no clear breakout signals, and the market will continue to oscillate back and forth within the range.
4. Underlying Logic of Market Movements
This round of upward movement is a tentative attack at the end of a rebound, with bulls lacking fundamental support and relying solely on short-term capital to drive prices, making it difficult to form a sustained breakout; meanwhile, the lower part is stacked with cost-averaging positions from previous entries, and the downward space is also locked. Therefore, in the short term, the price will only be trapped within the box, moving back and forth.
Official Account—Bit Big Bear X
(Note: 📣 Due to the timeliness and depth limitations of public platform information, the market changes rapidly. Key turning points, precise operational strategies, sudden risk alerts, etc., need to be synchronized immediately on the official account. Here you can obtain: real-time strategy pushes, in-depth analysis support, interactive Q&A, and risk warnings and optimization suggestions for personal holdings. 🚨 Remember: The market always rewards those who act faster and have more accurate information! Be a winner among the minority.)

免责声明:本文章仅代表作者个人观点,不代表本平台的立场和观点。本文章仅供信息分享,不构成对任何人的任何投资建议。用户与作者之间的任何争议,与本平台无关。如网页中刊载的文章或图片涉及侵权,请提供相关的权利证明和身份证明发送邮件到support@aicoin.com,本平台相关工作人员将会进行核查。