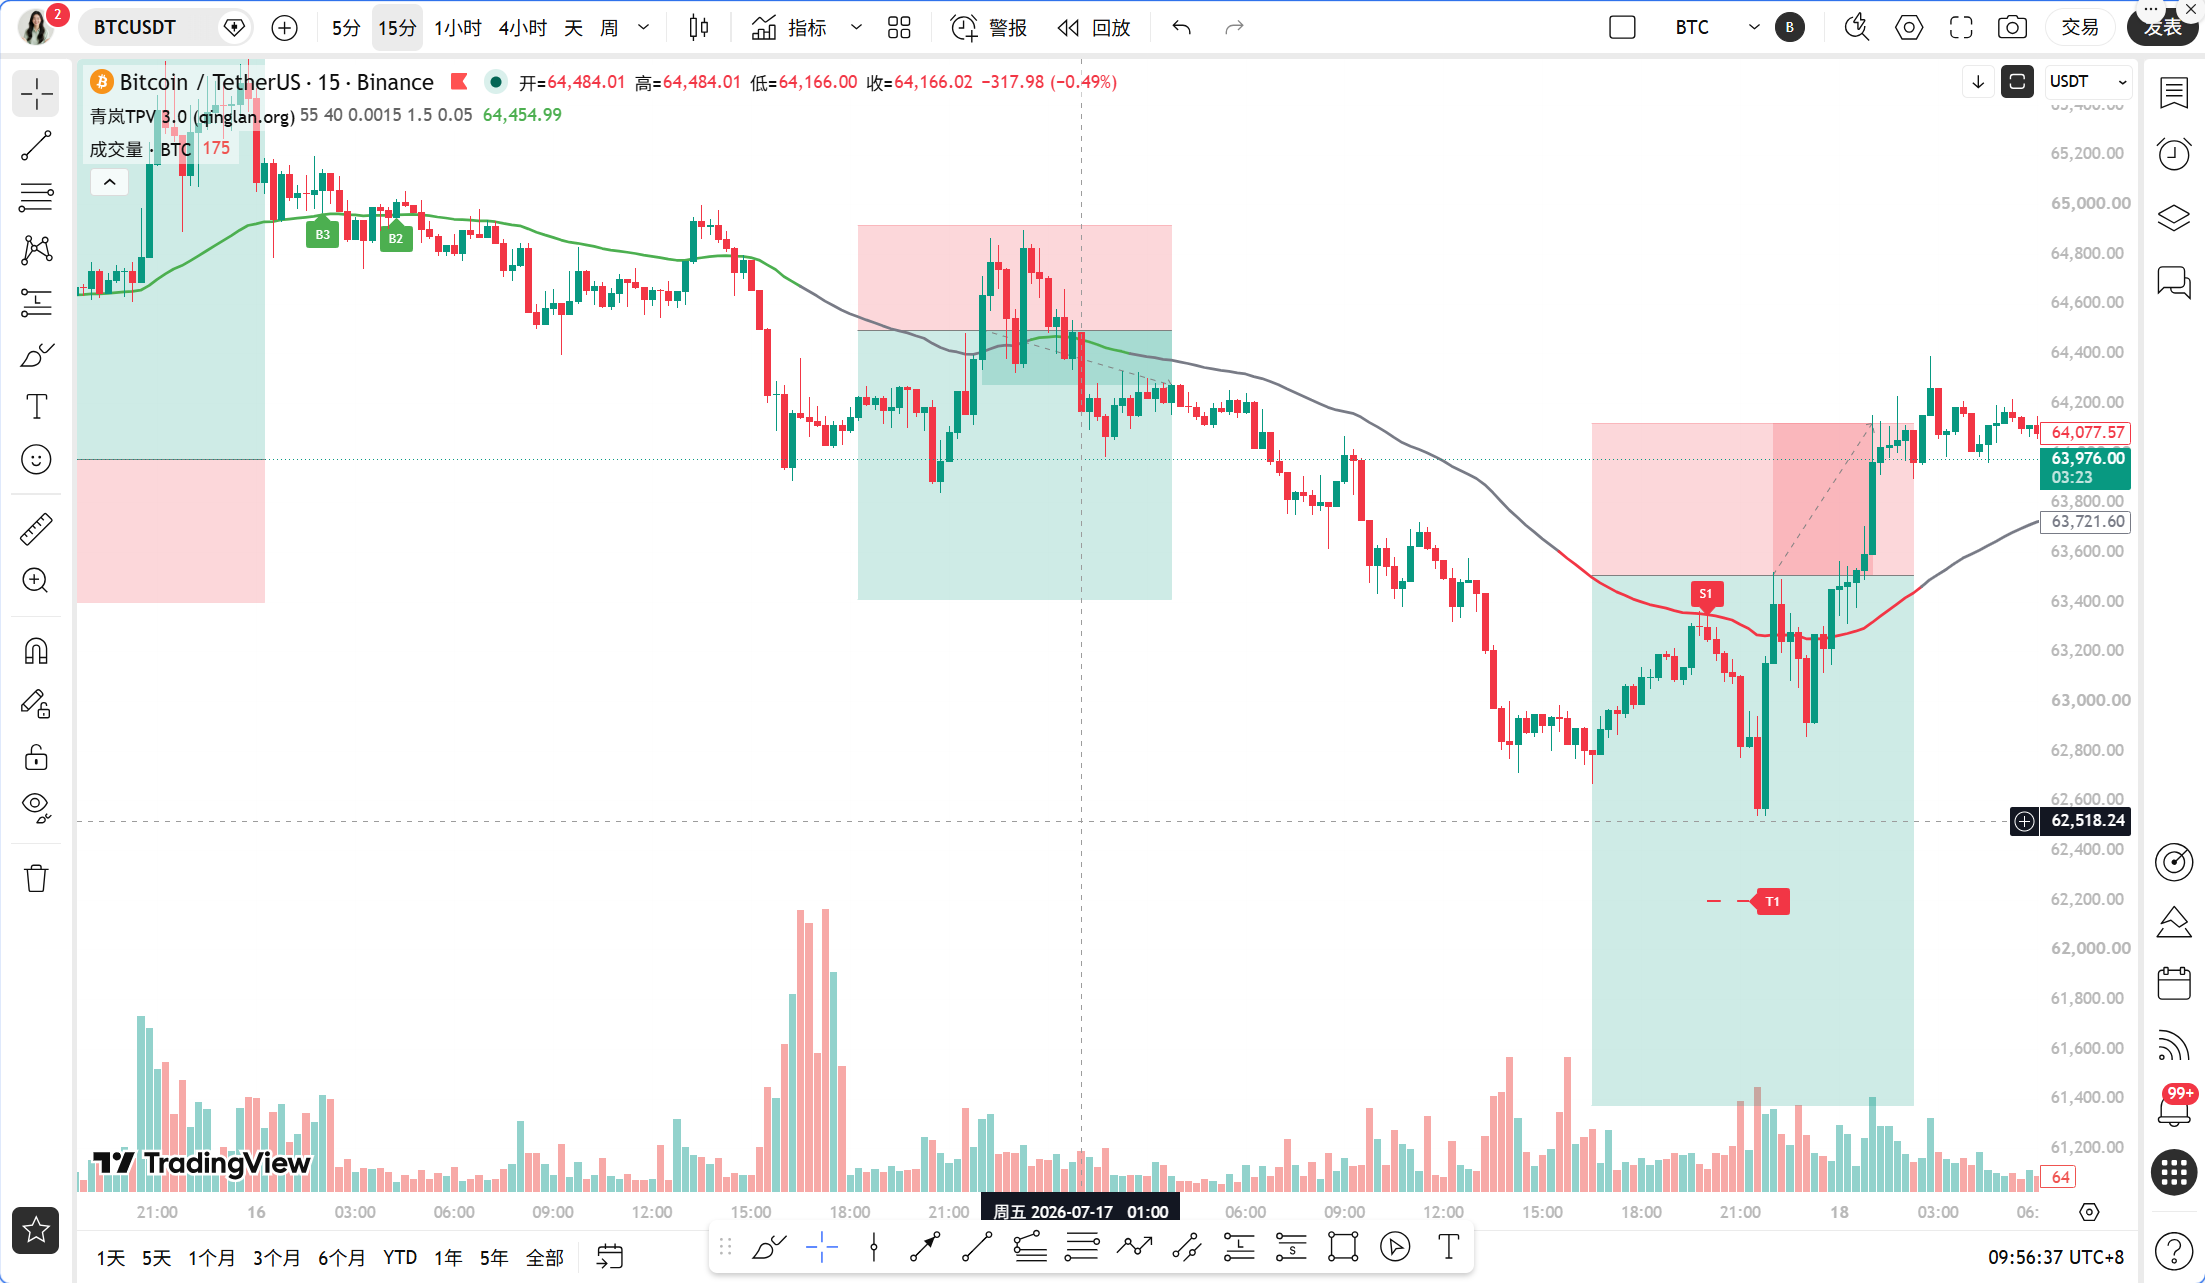
Dear friends, I am Sister Qinglan. In the early hours of this morning, the market was influenced by two major news items. On one hand, the U.S. Strategic Bitcoin Reserve Act was heard in Congress today, which is seen as a significant positive for policy and directly pushed Bitcoin to briefly break 64,000 USDT. On the other hand, the Philadelphia Semiconductor Index fell into a bear market, retreating over 20%, and the weakness in tech stocks acted like a cold shower, suppressing the rebound space for risk assets. This intertwining situation of bulls and bears is the battlefield that our Qinglan Crypto Classroom is best at. Today, we will break down the current market conditions with data and see what steps we should take next.
Current Price and Time
The current time is July 18, 09:56, with Bitcoin reported at 63,975 USDT. The 24-hour increase is only 0.22%, but the price has just rebounded from a low to around 64,000, and market sentiment remains fragile. The Fear and Greed Index is only 25, in the extreme fear zone, indicating that retail investor sentiment is pessimistic, but this is often also a window for major funds to position themselves.
Multi-Period State Overview
First, let’s look at the daily chart. The 5-day MA is at 64,307, and the 10-day MA is at 63,886, with prices currently oscillating between the MA5 and MA10. The MACD column value is 292.10; although the DIF is above the DEA, the histogram is beginning to flatten, indicating a weakening of bullish momentum. The RSI is at 53.99, in a neutral to strong area, but not overheated. The daily chart is overall in a broad oscillation pattern, without a clear unilateral direction.
On the 4-hour chart, the 5-day, 10-day, and 30-day MAs are clustering between 63,763 to 63,861, with prices at 63,975, slightly above the moving averages. The MACD column value is -63.37, with the DIF below the DEA, bearish momentum is still being released, but the histogram is shortening, showing signs of hidden divergence. The RSI is at 39.31, in a weak zone but not oversold. The 4-hour level shows a rebound repair under bearish dominance.
On the 1-hour chart, the 5-day and 10-day MAs are at 63,982 and 64,009, with prices at 63,975, slightly below the short-term moving averages. The EMA55 is at 63,960.33, with the current price at 63,975, just above EMA55. The MACD column value is 78.13, with the DIF above the DEA, indicating a strengthening bullish momentum. The RSI is at 69.09, close to the overbought area but not yet at 70. The 1-hour level shows a bullish rebound trend, but the momentum has weakened.
On the 15-minute chart, the 5-day and 10-day MAs are at 63,952 and 63,955, with prices at 63,975, above the short-term moving averages. The MACD column value is -19.04, with the DIF below the DEA, indicating weak bearish momentum. The RSI is at 50.72, neutral. The 15-minute level shows a short-term balance between bulls and bears, with no clear direction.
TPV Signal Verification
According to the Qinglan TPV system, we use the 1-hour EMA55 as the boundary between bulls and bears. The current price is 63,975, and EMA55 is at 63,960.33, with the price above EMA55, consistent with the bullish trend area. However, we need to verify whether the conditions for going long are met.
First, the price stabilizes above EMA55. In the past 8 1-hour candlesticks, the closing price was above EMA55 6 times, crossing it 2 times. The current price's absolute distance from EMA55 is only 0.02%, indicating proximity oscillation. This means the price has not effectively stabilized, but is running along the moving average, increasing the probability of oscillation. Therefore, the first condition is not completely satisfied, and we need to wait for two consecutive 1-hour candlestick closing prices to clearly be above EMA55.
Second, support stabilizes. From the 1-hour candlestick perspective, the most recent candlestick formed a long lower shadow, rebounding after touching around 63,600, creating a bottom divergence structure. This meets the conditions for support stability.
Third, bearish momentum exhaustion. The 1-hour MACD column has turned from negative to positive, and the histogram has shortened for 2 consecutive periods, with the RSI recovering from below 30 to 69, meeting the conditions for momentum exhaustion.
In summary, the current TPV system is giving a bullish signal, but there exists a key hidden danger: the price is fluctuating closely to the line, indicating insufficient bullish strength and the potential for reversals. If the price cannot quickly leave EMA55, it may transition into oscillation or even false breakout.
On-Chain/Funding Analysis
In terms of on-chain data, the Fear and Greed Index is 25, indicating extreme fear, which shows that market sentiment is pessimistic and retail selling pressure is high. However, historical data indicates that extreme fear often corresponds to a temporary bottom. Bitcoin's market share is 56.39%, remaining high, indicating that funds are still seeking refuge in Bitcoin, while altcoins are showing weakness. In terms of large sell-offs, whales have sold 30,000 ETH OTC, cashing out 55 million dollars, which puts short-term pressure on ETH but has limited impact on Bitcoin. Overall, the funding side is cautious, without showing panic selling.
Key Offensive and Defensive Levels
The first resistance level above is at 64,500, which is a resonance area between the daily MA5 and the previous small high. The second resistance level is at 65,000, a psychological barrier and the upper band of the 4-hour Bollinger Bands. The first support level below is at 63,600, which is the low point of the 1-hour long lower shadow. The second support level is at 63,000, which is the 4-hour MA30 and the previous area of dense trading. If it breaks below 63,000, the market may accelerate down to 62,000.
Trading Strategy
Based on the TPV system, we are currently in a bullish trend area, but the price is fluctuating closely around the line, indicating oscillation risk. Therefore, we adopt a cautious long strategy, not chasing high, and waiting for a pullback confirmation.
Direction: Long.
Entry Condition: Wait for the price to pull back to the 63,600-63,700 area, and the 1-hour candlestick shows a long lower shadow or bottom divergence, while the MACD column shortens and the RSI falls back to around 50. If the price directly breaks 64,500 and stabilizes, a light position can be taken to go long.
Stop Loss: Set at 63,300; if it breaks below, it indicates that support has failed, and the bullish structure is damaged.
Target Price: First target at 64,500, second target at 65,000. If the price reaches around 65,000 and shows a top divergence or a long upper shadow, it is recommended to reduce positions or close positions.
If the price breaks below 63,600 and cannot quickly recover, give up going long and switch to a wait-and-see approach. If the price breaks below 63,000, consider going short, with the entry point below 63,000, stop loss at 63,300, and target at 62,000.
Risk Warning
The current market is at a critical period of bulls and bears contesting, and close line fluctuations can easily trigger false breakouts; please strictly control your positions, and the risk per trade should not exceed 2% of total funds.
Follow Qinglan Crypto Classroom to grasp more trading opportunities! Welcome to visit the official website www.qinglan.org
📊 Qinglan TPV Trading Strategy Backtest Reference
🕒 Last Backtest Time 07-18 07:00:02
Total Analysis: 3025 Backtests: 2331 Accuracy: 76.4% (1781/2331)
免责声明:本文章仅代表作者个人观点,不代表本平台的立场和观点。本文章仅供信息分享,不构成对任何人的任何投资建议。用户与作者之间的任何争议,与本平台无关。如网页中刊载的文章或图片涉及侵权,请提供相关的权利证明和身份证明发送邮件到support@aicoin.com,本平台相关工作人员将会进行核查。