Academician of the Crypto Circle: The turning point for Bitcoin (BTC) at 7.18 has emerged, and profit and loss are just a thought away? Latest market analysis and operational suggestions explained.
Currently, Bitcoin is at 63600, and it is oscillating in the range of 63500 without significant market movement, consisting only of fragmented washing fluctuations. In fact, those who have been trading in the cryptocurrency market for a long time understand that such sideways movement is most likely to lead to losses. It is not that one cannot comprehend the trends, but it is about not being able to control one's hand. There is always a feeling that missing a second means losing an opportunity, chasing for longs on slight rebounds, and chasing for shorts on slight declines, eventually being harvested back and forth by the market. The market will never disappoint patience; it only punishes frequent operations.
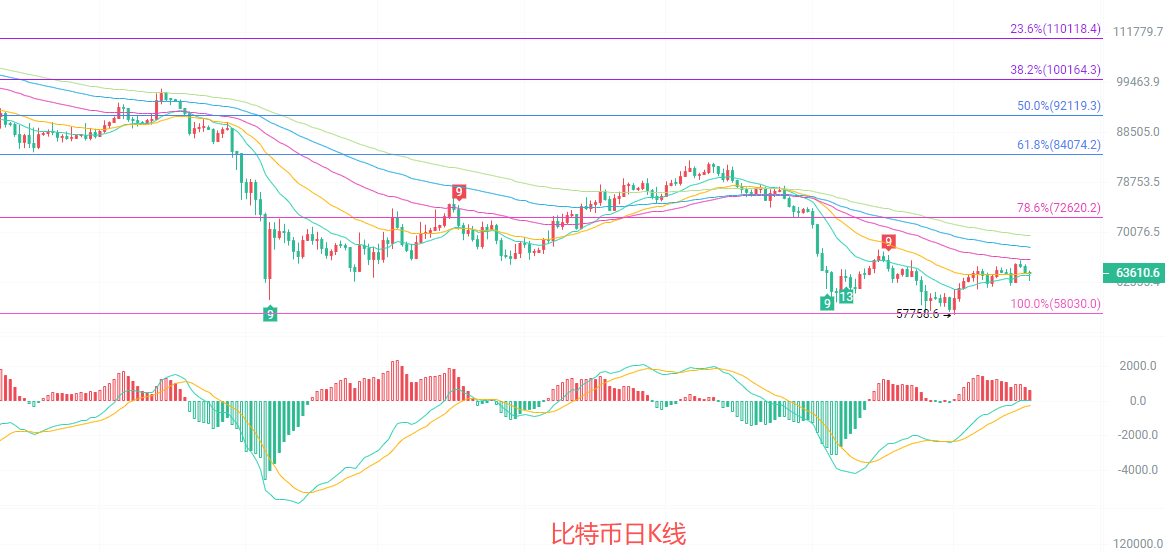
The daily K-line is currently below EMA15 and EMA30, under pressure in the short-term moving average range of 63939-63639, with strong resistance at the Fibonacci 78.6% level at 72620 above, and support near 58030 below. The MACD indicator shows that after the DIF and DEA golden cross, the red bars have diminished, indicating weakened upward momentum; the middle track of the Bollinger Bands is trending downward, and the price is weakly operating below the middle track, with the upper track at 66138 and the lower track at 59164. The overall structure is one of weak oscillation after convergence, with no clear trend-breaking signals yet seen.
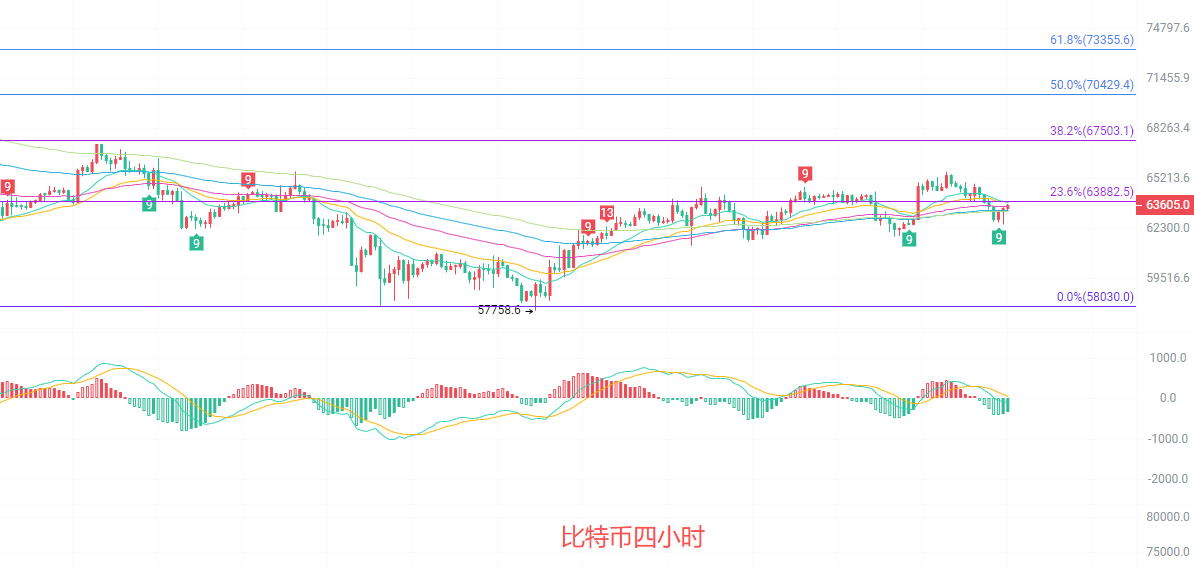
The four-hour K-line is below EMA15 and EMA30, with short-term moving averages forming resistance. EMA60, EMA90, and EMA120 are forming a support zone below. The MACD indicator shows DIF-DEA opening downward, with green bars continuously releasing, indicating short-term downward momentum prevailing; the middle track of the Bollinger Bands is at 64282, the upper track at 65601, and the lower track at 62963. The price has weakly consolidated after breaking below the middle track, with Fibonacci 23.6% becoming a strong resistance in the short term, while 0.0% is the ultimate support below. The oscillation range is gradually narrowing, waiting for a directional choice.
Short-term reference:
Do not break below 63100 to 62700 for a bullish move, stop loss at 62200, with a target of 64500 to 65500.
Do not break above 65000 to 65500 for a bearish move, stop loss at 66000, with a target of 64000 to 63000.
Specific operations should be based on real-time market data, and more information can be consulted with the author. The publication of the article has a delay, and the suggestions are for reference only; risk is to be taken at one's own discretion.

Warm reminder: The above content is solely created by the author of the public account. The advertisements at the end of the article and in the comment section are not related to the author. Please discern wisely, and thank you for reading.
免责声明:本文章仅代表作者个人观点,不代表本平台的立场和观点。本文章仅供信息分享,不构成对任何人的任何投资建议。用户与作者之间的任何争议,与本平台无关。如网页中刊载的文章或图片涉及侵权,请提供相关的权利证明和身份证明发送邮件到support@aicoin.com,本平台相关工作人员将会进行核查。