Waves in the Currency Sea: 7.5 Bitcoin (BTC) Market Analysis Reference:
The current price of Bitcoin is 62700, with the intraday market continuing to fluctuate within a narrow range. The Bollinger Bands at the daily level are narrowing, and the current price remains above the middle band, with a solid short-term bullish trend. The moving average system shows a bullish arrangement, and the short-term EMA is continuously supporting the market. MACD maintains an increasing volume, with DIF and DEA trending upwards, and bullish momentum is still continuing; the KDJ indicator's J value has touched the overbought zone, and RSI has entered a high area, indicating a slight pullback demand in the short term. Key support below is around 61800-62000, and as long as the daily middle band is not broken, this rebound trend will not be disrupted, with the overall trend leaning towards a sideways upward movement, and the main pressure above will be the upper Bollinger band.
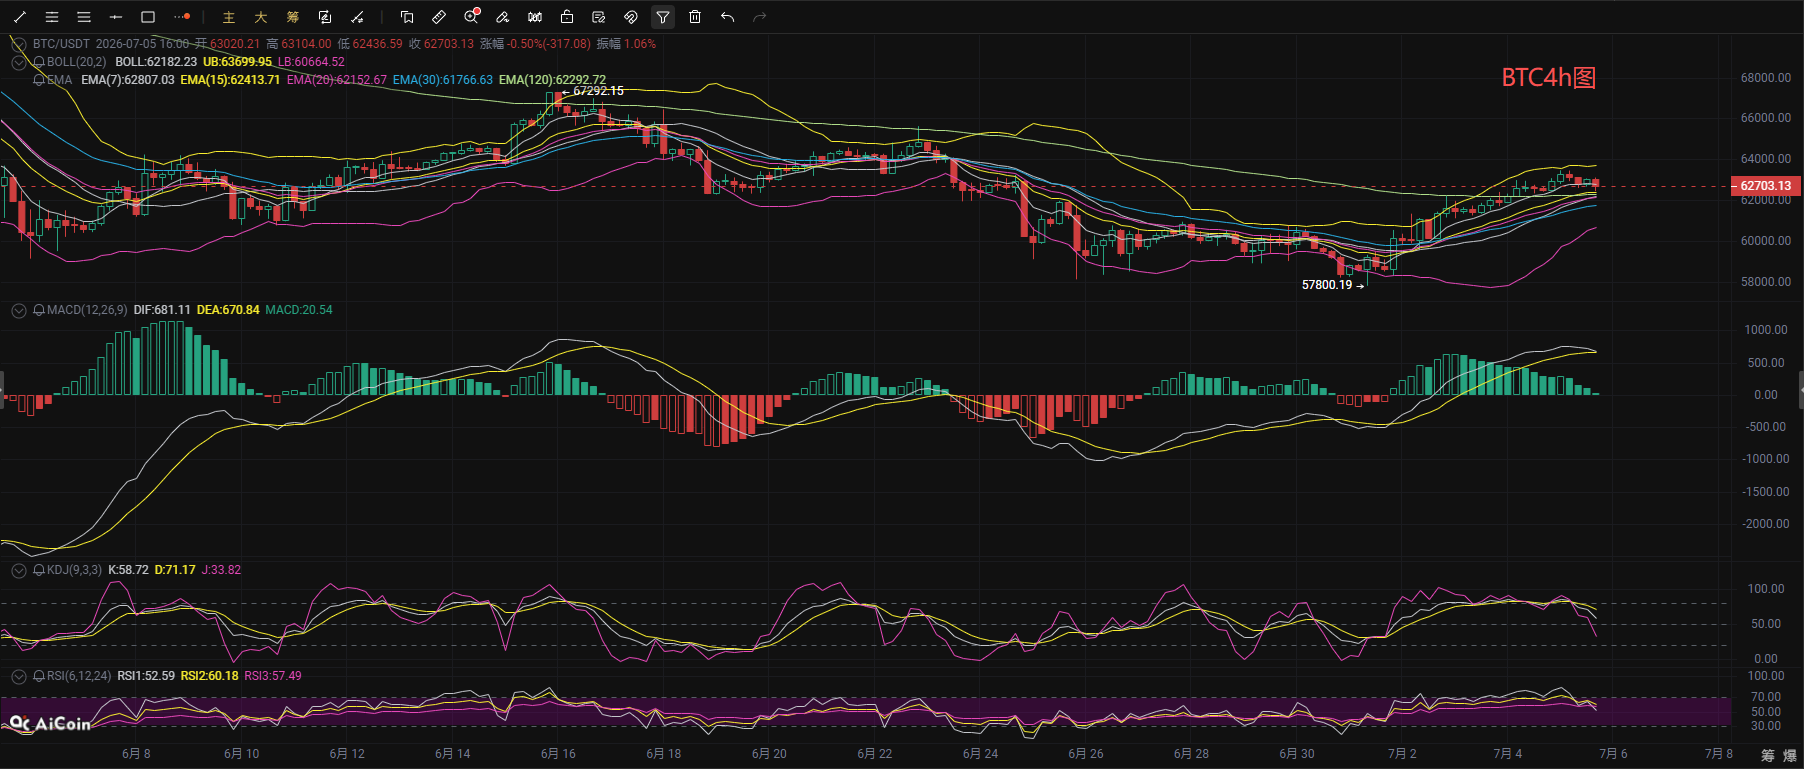
In the short 4-hour cycle, the price began to retract after reaching a high of 63400, with the upper Bollinger band forming short-term pressure, entering a high-level consolidation. The MACD histogram is gradually shortening, with the DIF line turning downwards showing signs of forming a death cross, and bullish momentum begins to weaken; the KDJ has formed a death cross and is diverging downwards, with RSI also turning downwards, indicating a need for a short-term pullback for correction. Short-term support is near the Bollinger middle band at 62150; if this position holds, the market will maintain a high-level box fluctuation; once it breaks the middle band, it will further retest the support at the 61700 moving average, indicating a short-term pullback first, as there are currently no conditions for a direct consecutive rise; it is not recommended to blindly chase highs, but to wait for a retraction to stabilize at lower levels before entering longs accordingly.
Waves in the Currency Sea: 7.5 Bitcoin Short-term Reference:
Long Position: Buy in the range of 60700-61700, stop loss below 60000, target at 62000-63500,
Short Position: Sell in the range of 64500-63500, stop loss above 65500, target at 63000-61500,
Daily updates of real-time trading strategies, providing free analysis and practical market knowledge; scan the QR code to follow the public account for easy access to connection and addition methods!

[The above analysis and strategy is for reference only. Please bear the risks yourself. The article review and publication may have delays, and strategies do not possess timeliness; do not operate blindly.]
免责声明:本文章仅代表作者个人观点,不代表本平台的立场和观点。本文章仅供信息分享,不构成对任何人的任何投资建议。用户与作者之间的任何争议,与本平台无关。如网页中刊载的文章或图片涉及侵权,请提供相关的权利证明和身份证明发送邮件到support@aicoin.com,本平台相关工作人员将会进行核查。