Coin Circle Liying: Latest Market Analysis of 7.5 Bitcoin (BTC) and Ethereum (ETH)
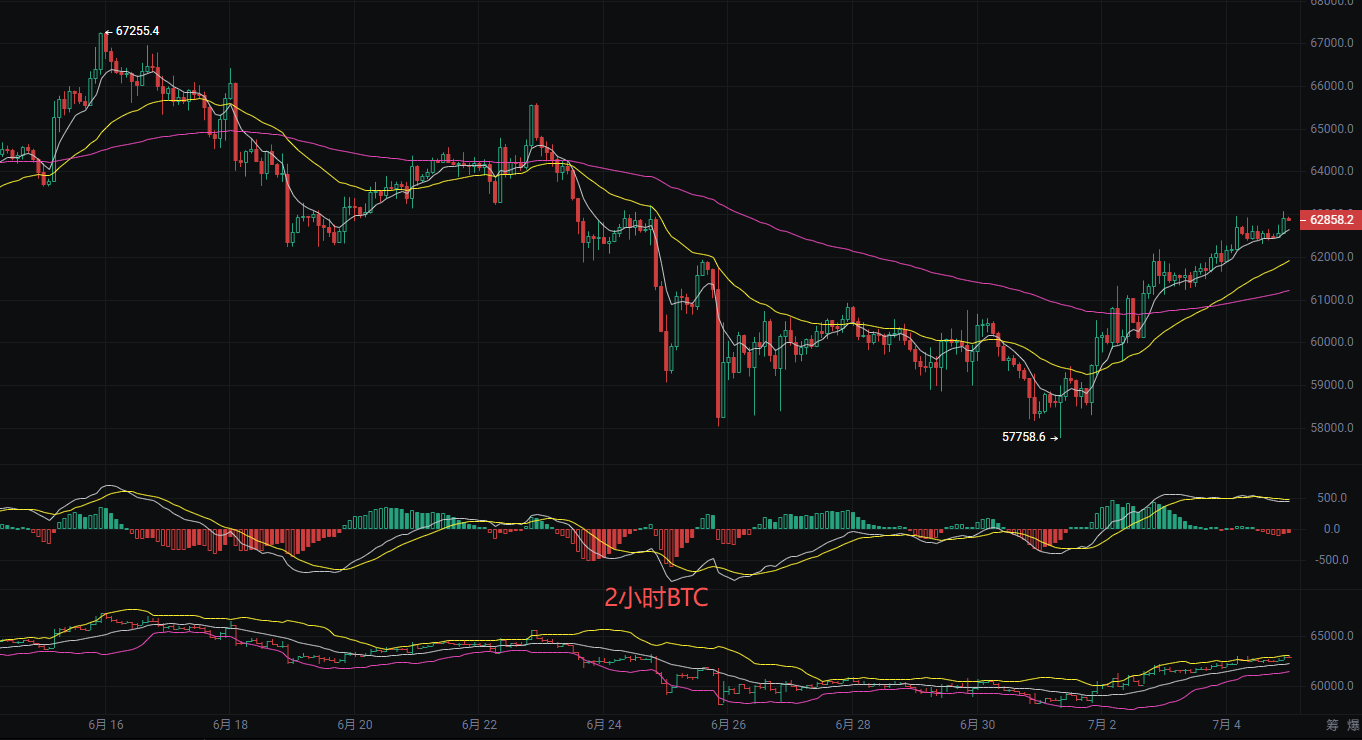
The current price of Bitcoin is 62850, and it has formed a beautiful V-shaped reversal pattern on the daily chart. Previously, everyone was anxious due to the decline, but now, watching these bullish candles rise from the bottom is a test of mentality. It looks like it is about to challenge the previous high, but there is hidden risk of a shakeout. A bullish alignment is forming, but there are still hidden dangers. The EMA moving averages have confirmed a short-term golden cross, but the EMA120, as the boundary between bull and bear markets, is still below providing support, indicating that the medium to long-term trend has just turned warm. The MACD indicator shows upward momentum but requires vigilance against a volume contraction correction. Currently, the price is running between the middle and upper bands, with the upper band at 63044 forming the immediate resistance level; if it cannot break through with increased volume, it is easy to be blocked and fall back. Overall, indicators resonate positively, but the space appears somewhat crowded.
Short-term trading strategy reference:
For long positions, entry points are 62000-61500, stop loss at 61000, target 63500 aiming for 64000.
For short positions, entry points are 63500-64000, stop loss at 64500, target 62500 aiming for 62000.
Ethereum
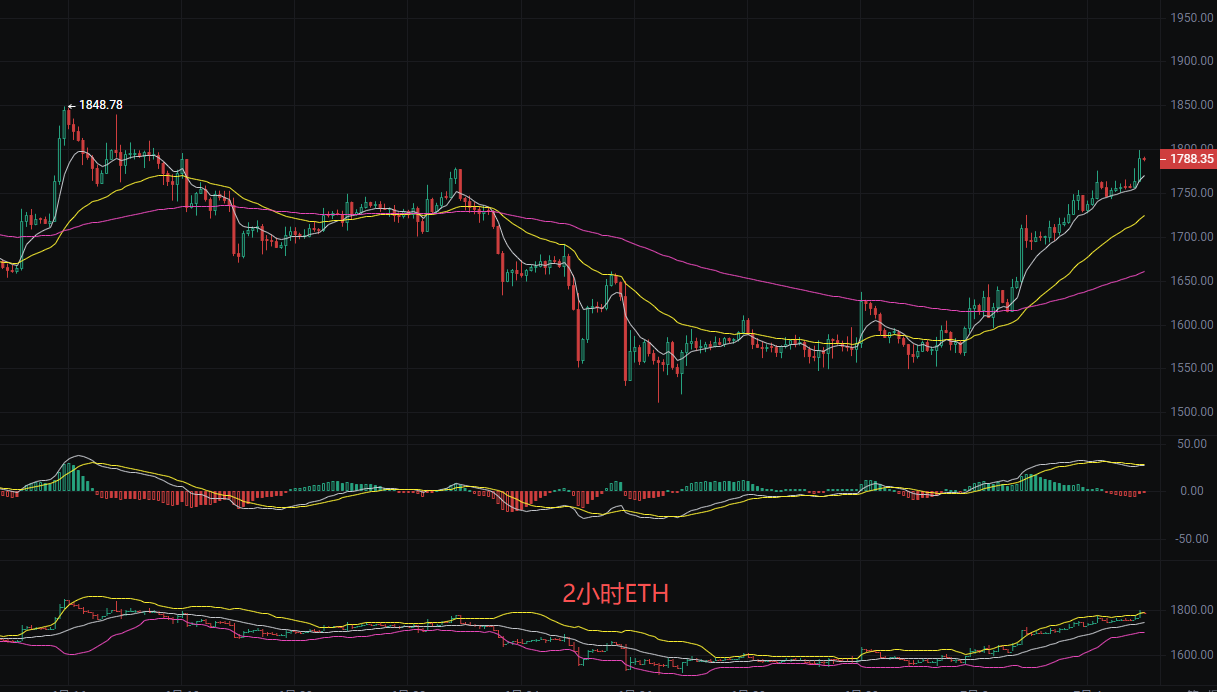
The current price of Ethereum before publication is 1790. Initially, it seemed to be heading towards an endless drop. However, after repeatedly grinding the bottom in the range of 1550-1600, it suddenly surged with increased volume, directly approaching the previous high resistance level. This V-shaped reversal and platform breakout resembles a secondary charge after the main party's shakeout. It is currently stuck in a critical position; is this a false breakout to lure buyers or a genuine acceleration? The moving averages are in a bullish arrangement, with short-term moving averages forming a golden cross with medium-term moving averages, indicating strong short-term buying pressure; the MACD indicator has formed a golden cross, and the red bars continue to expand, indicating that bullish momentum is being released; the price, after breaking through the middle band at 1747, is challenging the upper band at 1790, which has become a short-term pressure point, but the support from the middle band is effective. Overall, it is in the early stage of an upward channel. However, attention should be paid to the previous high of 1848 as a strong resistance level; if the volume does not keep up, it is easy to surge high and fall back.
Short-term trading points reference:
For long positions, entry at 1750, with a defense level at 1700, stop loss at 1650, target 1800 aiming for 1850.
For short positions, entry at 1820, with a defense level at 1860, stop loss at 1900, target 1780 aiming for 1730.
The above content is exclusively original by Liying; please indicate the source when reprinting! Article publication review has a time lag; market conditions change rapidly, and the above suggestions are for reference only, with risks borne by the reader.

Friendly reminder: The above content is only created by the author on the public account; the advertisements at the end of the article and in the comments section are unrelated to the author. Please be cautious in your judgment, and thank you for reading.
免责声明:本文章仅代表作者个人观点,不代表本平台的立场和观点。本文章仅供信息分享,不构成对任何人的任何投资建议。用户与作者之间的任何争议,与本平台无关。如网页中刊载的文章或图片涉及侵权,请提供相关的权利证明和身份证明发送邮件到support@aicoin.com,本平台相关工作人员将会进行核查。