Cryptocurrency Scholar: Is Bitcoin (BTC) Multi-dimensional Indicator Fully Bearish at 7.1? Latest Market Analysis and Operational Suggestions Explained
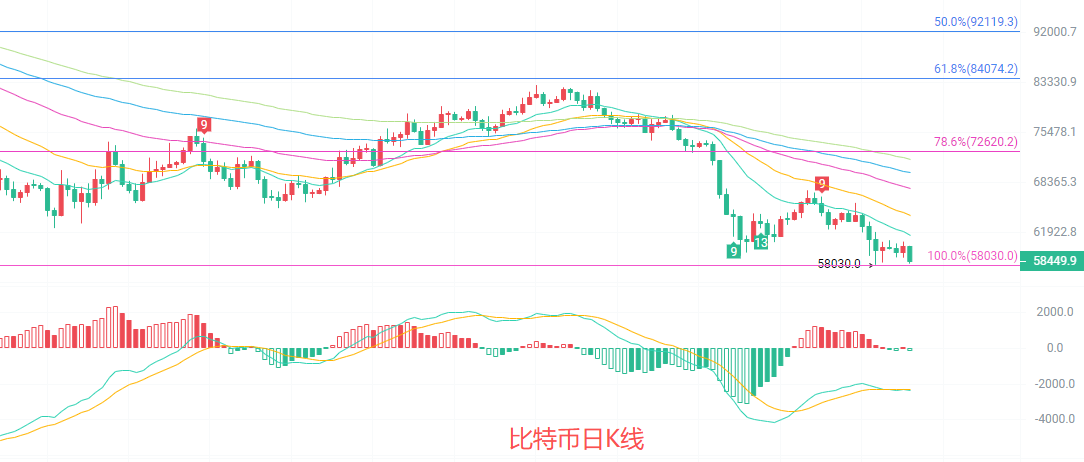
The current price of Bitcoin is 58500, with the daily candlestick having fallen near the previous low point of 58030, clearly within a descending channel. The price continues to decline along the EMA15/30/60 moving averages, which are fully aligned downward, and the lower Bollinger Band continuously extends downward, with the middle band resistance approximately at 62700, making it difficult for a short-term rebound to break through. The MACD indicator's DIF and DEA remain below the zero axis; although the green bars have contracted, the downward momentum has not been fully released, indicating that a clear reversal signal for the daily downtrend has not appeared yet. Current attention should focus on the strong support at 58030; if it is breached, further downside potential will be opened up.
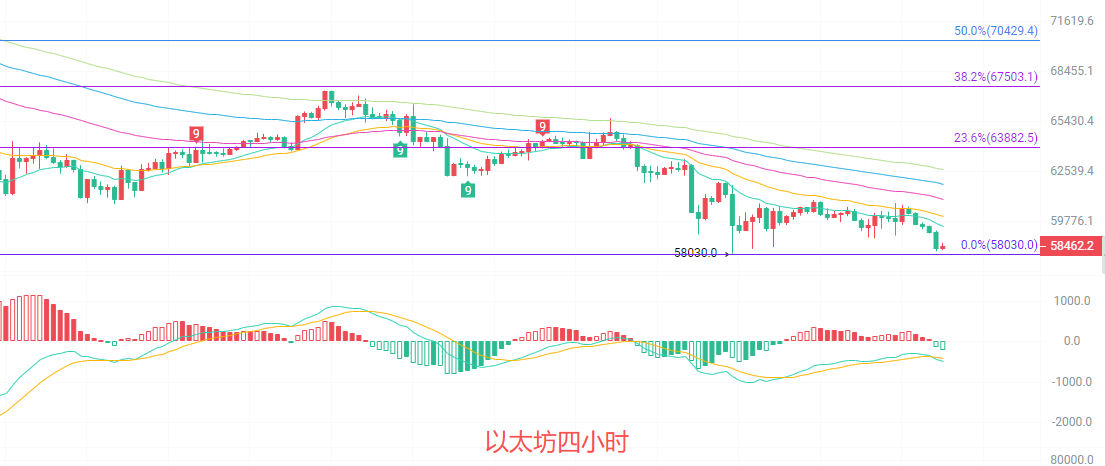
The four-hour candlestick is also in a weak downward structure, with the price continuously operating along the lower Bollinger Band. The lower band support is around 58630, roughly matching the current price, with the middle band resistance near 60900. The EMA moving average system is in a typical downward alignment, and price rebounds are consistently constrained by EMA15, with the rebound highs continuously declining, forming a standard descending channel. The MACD indicator's DIF and DEA are operating below the zero axis. Although there are signs of a golden cross, it has not effectively formed yet; the shortening green bars only represent a temporary weakening of the downward momentum and do not constitute a reversal signal. In the four-hour timeframe, there is a need to be wary of the risk of breaking the support level, and the effectiveness of high points capping the rebounds remains key to judging short-term strength.
Short-term reference:
If the price holds above 58300 to 58000, target an upward move, with stop loss at 57500, aiming for 59000 to 60000.
If the price holds below 60000 to 60500, target a downward move, with stop loss at 61000, aiming for 59000 to 58000.
Specific operations should be based on real-time market data; for more information, please consult the writer. There may be delays in the publication of this article; it is recommended for reference only and the risk is borne by the reader.

Friendly reminder: The above content is created solely by the author; the advertisements at the end of the article and in the comments section are unrelated to the author. Please discern carefully, and thank you for reading.
免责声明:本文章仅代表作者个人观点,不代表本平台的立场和观点。本文章仅供信息分享,不构成对任何人的任何投资建议。用户与作者之间的任何争议,与本平台无关。如网页中刊载的文章或图片涉及侵权,请提供相关的权利证明和身份证明发送邮件到support@aicoin.com,本平台相关工作人员将会进行核查。