Cryptocurrency Market Analysis: Latest Bitcoin (BTC) and Ethereum (ETH) Trends on June 26
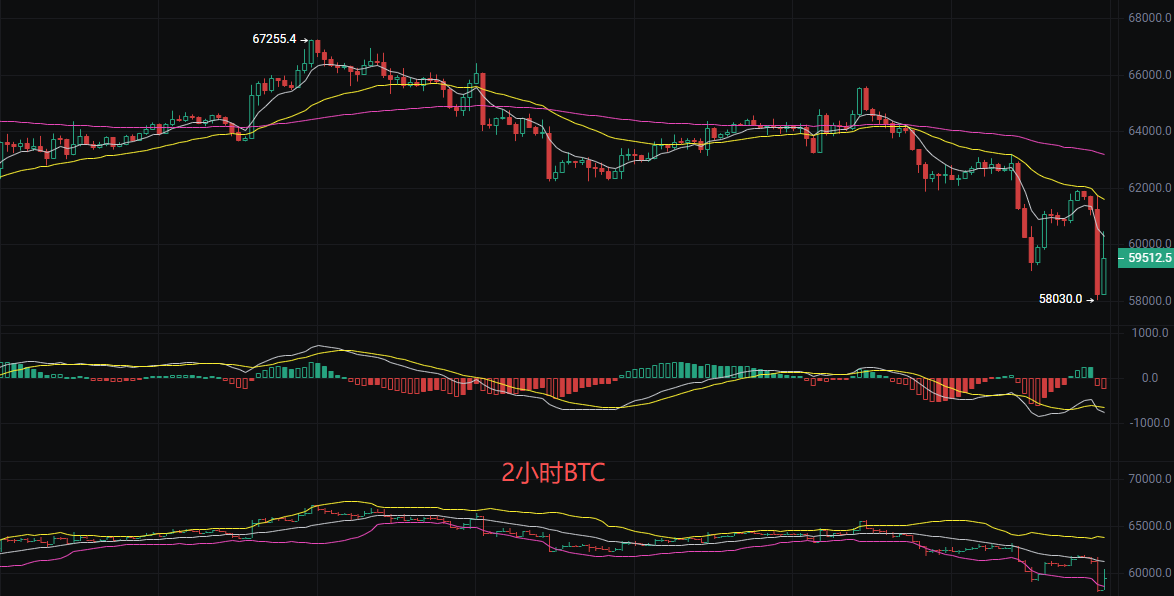
The current price of Bitcoin is 59,200, showing a weak oscillating pattern dominated by bears on the technical front. Since the previous high of 71,788, there has been a phase of rebound, but the downtrend has not changed. Recently, the price has been repeatedly testing support at a low level, with an intensification of the tug-of-war between bulls and bears, making it necessary to use indicators to determine the future direction. The moving averages EMA7, EMA30, and EMA120 are in a bearish arrangement, with short, medium, and long-term moving averages sequentially suppressing the price, reflecting ongoing market selling pressure. The rebound may easily encounter resistance; the MACD indicator shows that bearish momentum has not diminished, and there is still downward inertia. The Bollinger Bands indicate that the price is close to the lower band of 58,640, with the middle band at 61,263 forming key resistance. If the lower band breaks, it may open up downward space, while a breakthrough of the middle band needs volume confirmation. Overall, the short-term rebound space is limited, the bearish trend remains unchanged, and caution against breakout risks is needed.
Short-term Trading Ideas:
For long positions at 58,000-57,000, stop loss at 56,500, target at 59,000 aiming for 60,500.
For short positions at 61,500-62,000, stop loss at 62,500, target at 60,500 aiming for 60,000.
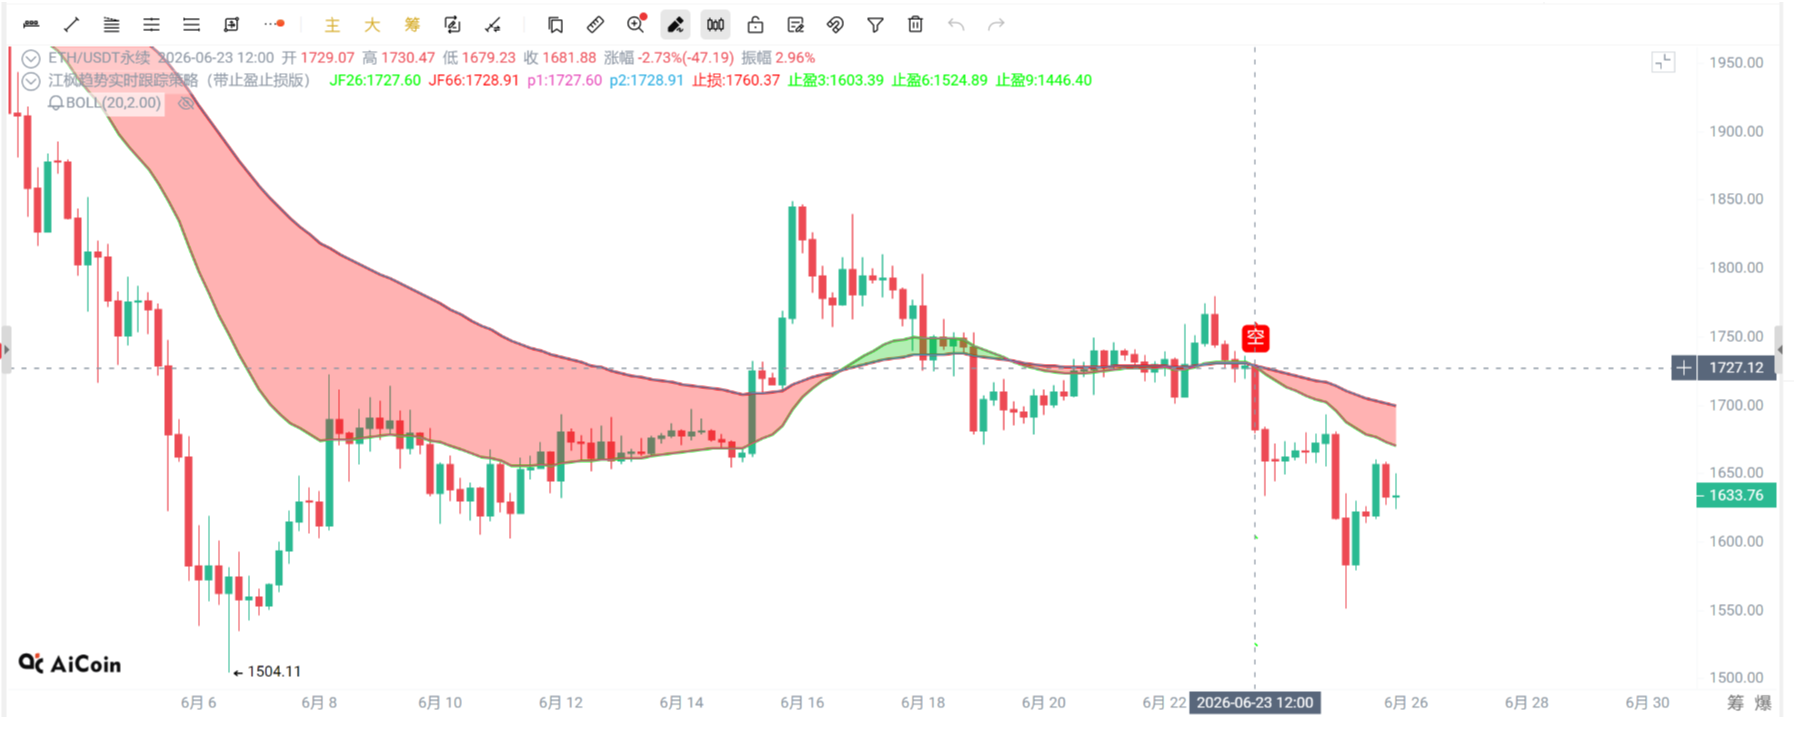
Ethereum
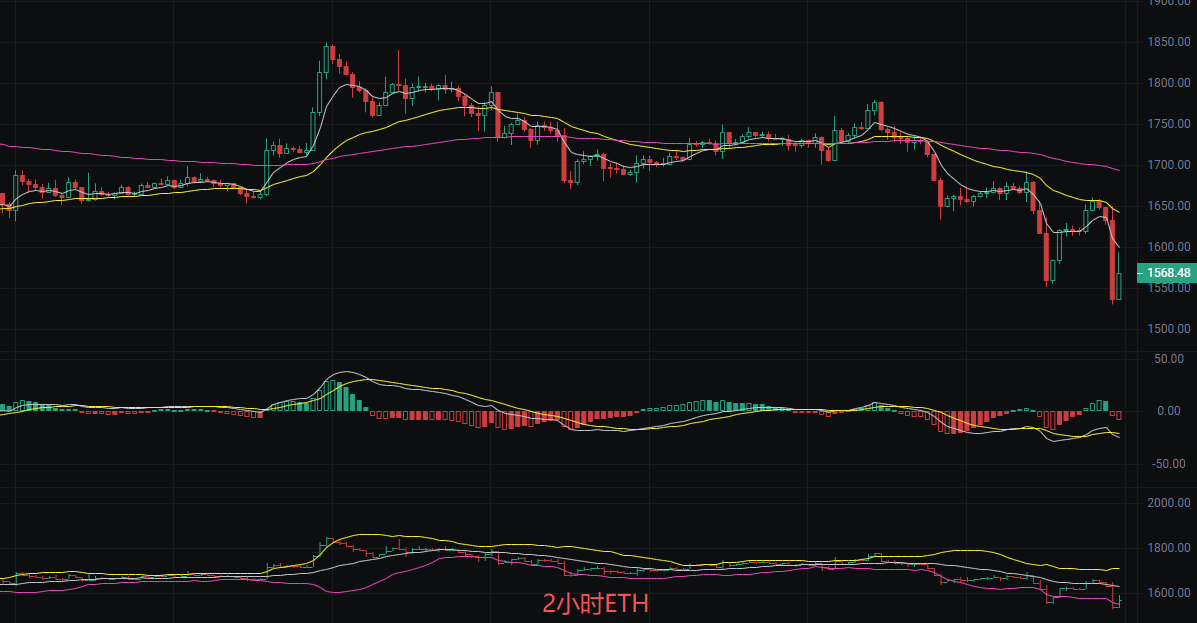
Before publication, the current price of Ethereum is 1,560. It previously fell from a high of 1,850, had a rebound to 1,750 but could not hold. Now the price is struggling amid the moving averages. Simply put, both bulls and bears are fighting, and neither has completely won, but the overall trend is still bearish. After all, the highs are getting lower. The moving averages EMA7, EMA30, and EMA120 lie above the price, suppressing it. The short-term EMA7 is close to the current price, indicating that selling pressure is still present; the MACD bearish momentum has not fully receded; the Bollinger Bands are also crucial, with the middle band at 1,629 acting like a ceiling and the lower band at 1,548 serving as a floor. The current price is below the middle band, indicating a weak zone.
Short-term Trading Points:
For long positions at 1,540, defense at 1,500, stop loss at 1,450, target at 1,600 aiming for 1,650.
For short positions at 1,650, defense at 1,700, stop loss at 1,750, target at 1,600 aiming for 1,550.
The above content is exclusively created by Li Ying. Please indicate the source for any reprints! There may be delays in article publication and review. The market is changing rapidly, and the above suggestions are for reference only; risks are to be borne by the individual.

Kind Reminder: The above content is solely created by the author on the official account. The advertisements at the end of the article and in the comment sections are unrelated to the author. Please discern carefully, and thank you for reading.
免责声明:本文章仅代表作者个人观点,不代表本平台的立场和观点。本文章仅供信息分享,不构成对任何人的任何投资建议。用户与作者之间的任何争议,与本平台无关。如网页中刊载的文章或图片涉及侵权,请提供相关的权利证明和身份证明发送邮件到support@aicoin.com,本平台相关工作人员将会进行核查。