In the cryptocurrency market, do you often encounter confusion like this: why does the price frequently experience "false breakouts" despite using the same moving average? Which price is the true "death line" determined by the fierce competition between bulls and bears? What is the benchmark line that institutions and large holders focus on when building their positions?
Today, I will deeply analyze a quantitative weapon widely used by top global quantitative institutions and cryptocurrency whales: --- VWAP (Volume Weighted Average Price).
I. What is VWAP? How does it differ from ordinary moving averages (MA)?
VWAP, which means Volume Weighted Average Price in Chinese, is an indicator that deeply combines "price" and "volume" to measure the average market price.
According to the calculation method description in the AiCoin software, its core formula is:

From the calculation formula, we can clearly see its similarities and differences compared to ordinary moving averages (MA):
🤝 Similarities:
1. Trend Indicator: Both are used to measure the average market price and can be used to judge the overall market trend and direction.
2. Natural Support and Resistance: Both can serve as support and resistance levels; when the price breaks through or falls below them, it often triggers strong buy and sell signals.
⚖️ Differences:
1. Dynamic vs Static: Ordinary moving averages are relatively static, rigidly calculated based on fixed time periods and closing prices; whereas VWAP is a highly dynamic indicator, reconstructing its internal weights in real time according to changes in trading volume and price in each time period.
2. Real Price vs Psychological Price: Ordinary moving averages ignore trading volume, reflecting the market's "psychological price"; while VWAP considers the influence of trading volume, better reflecting the "real holding cost" accumulated from actual money in the market. The larger the trading volume at a certain price level, the more VWAP will be pulled towards that price level.
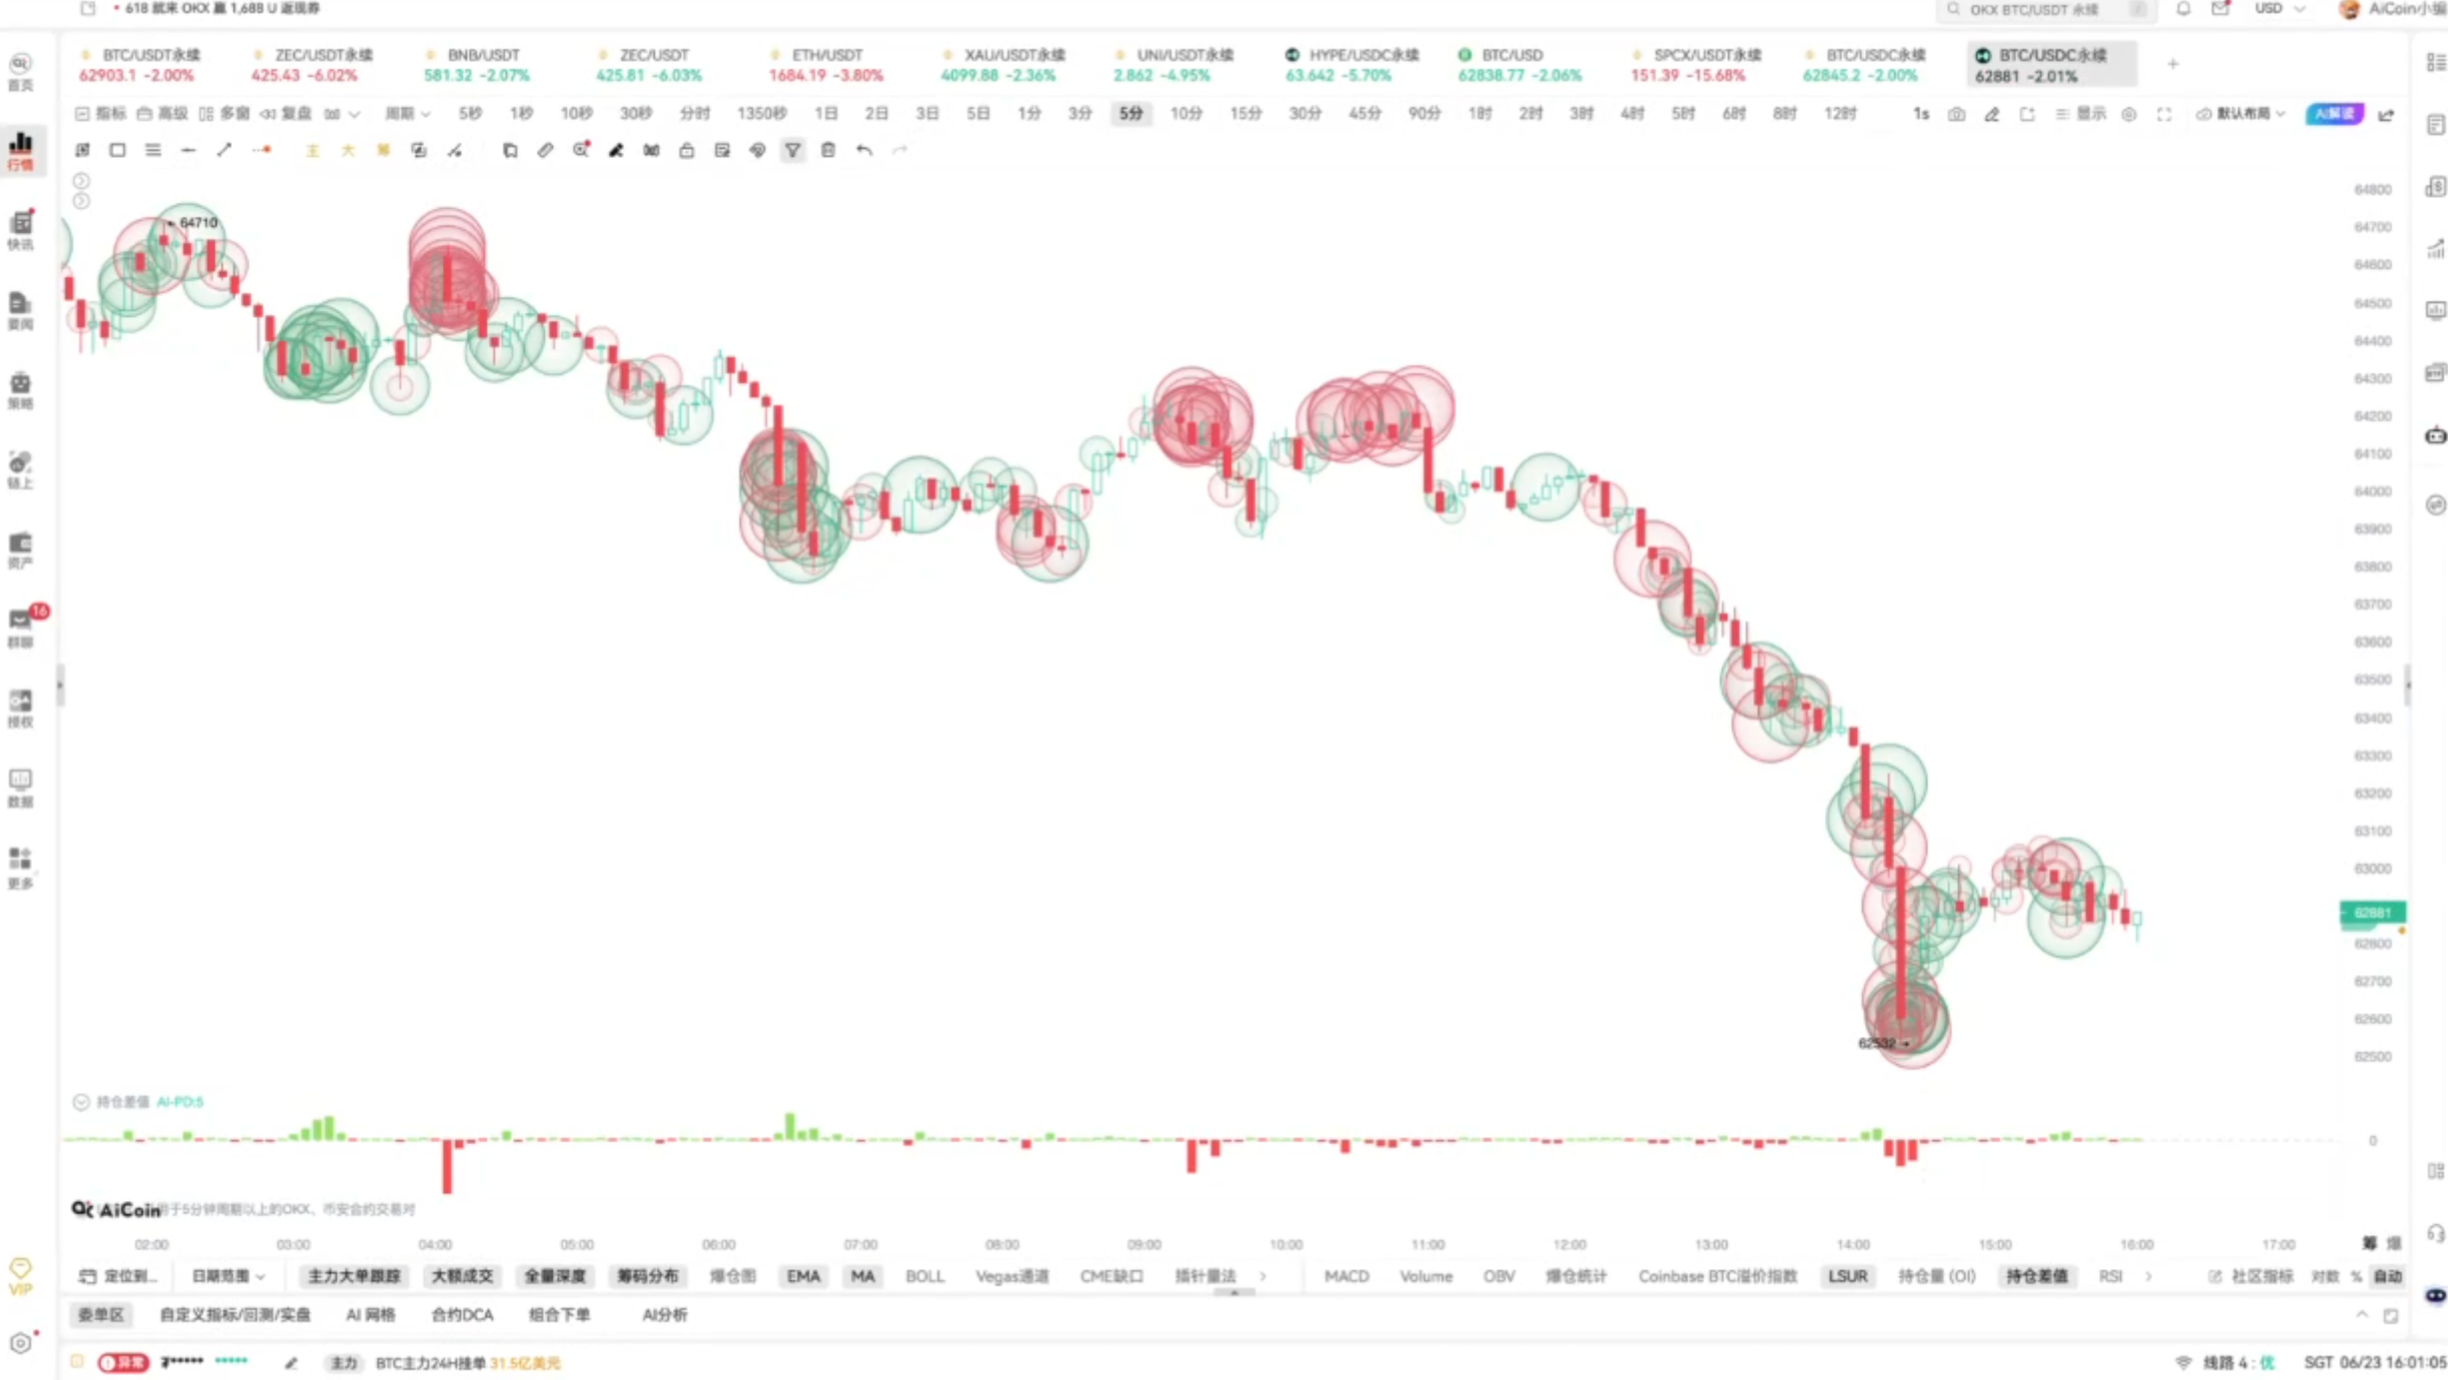
II. Combined with Charts: Three Key Techniques for Trading with VWAP
1. Used as a "Watershed" for Bullish and Bearish Trends
- Bullish Trend: When the price is above VWAP, it indicates the market is operating above the average cost line, favoring bulls, and one should mainly buy long in the direction of the trend.
- Bearish Trend: When the price is below VWAP, it indicates the market is operating below the average cost line, favoring bears, and the market has turned bearish, one should mainly sell short or wait.

2. Used as Accurate Dynamic Support and Resistance Levels (Combined with Standard Deviation Bands)
- Breakthrough and Pullback: When the price rebounds from a low and crosses above VWAP, it indicates strong buying power in the market, and one can consider buying in the direction of the trend. In a strong upward movement, whenever the price pulls back to near the VWAP main line, it is often an excellent opportunity to enter long; at this point, VWAP acts as a solid support level; conversely, in a downward trend, a rebound to VWAP acts as a resistance level.

- Combined with VWAP Bands: In the AiCoin software, by checking "Upper/Lower Bands", corresponding standard deviation curves (i.e., VWAP Bands) will be added on both sides of the VWAP main line. These curves are excellent price boundaries; when future prices reach these outer curves, it often indicates the market is in an extreme state of overbought or oversold, and one should pay attention to the market's response to mean reversion.

With the addition of VWAP Bands, the chart display effect is as follows:

3. Multi-Indicator Combination to Improve Signal Stability
VWAP is not isolated. In actual strategy, it is recommended to use VWAP in combination with momentum indicators such as MACD and RSI.
- For example: When the price pulls back to the VWAP support line while a MACD golden cross occurs, the accuracy and stability of resonance in buying will be significantly enhanced.

III. How to Enable It in AiCoin?
Upgrade the AiCoin desktop client to version V2.16.8 or above, go to the candlestick chart -> click on indicators -> search for "VWAP" and click to load.

To maximize the power of VWAP, keep the following four points in mind during trading:
1. Indicators Are Not Omnipotent; Combine with Filtering Conditions:
VWAP may also produce erroneous signals or lagging signals in volatile markets or certain extreme situations. Therefore, when using it, one needs to combine market sentiment, news events, and candlestick patterns (such as volume price analysis VSA) for judgment and filtering.
2. Not Limited to Day Trading; Supports Multi-Timeframe Switching:
Many traders mistakenly believe that VWAP can only be used for intraday trading. In fact, since it is based on historical data, it can be used for any time frame just like moving averages. In the AiCoin software, by switching to different candlestick timeframes (such as daily or weekly), you can observe longer-term Weekly VWAP or Monthly VWAP, allowing for a comprehensive overview of the market.
3. Highly Dependent on the "Liquidity" of the Asset:
In markets with larger trading volumes, better liquidity, and higher volatility, VWAP performs more effectively. Conversely, in certain obscure altcoins with low trading volume, poor liquidity, and easily manipulated by single funds, the use of VWAP often leads to poor results and is prone to distortion.
4. Set Parameters Scientifically; Avoid Frequent Resets:
In short-term trading, a shorter period (N) can be used; for long-term trading, a longer period is preferable. Choose the appropriate parameters based on your trading style to ensure that the indicator perfectly aligns with your personal strategy.
Risk Warning: The views expressed in this article are for educational purposes in technical analysis and do not constitute any investment advice. Cryptocurrency assets are highly risky; trades based on this are at your own risk.
Join our community to discuss and become stronger together!
Official Telegram Community:
AiCoin Chinese Twitter:
Group Chat - Wealth Group:
https://www.aicoin.com/link/chat?cid=10013
免责声明:本文章仅代表作者个人观点,不代表本平台的立场和观点。本文章仅供信息分享,不构成对任何人的任何投资建议。用户与作者之间的任何争议,与本平台无关。如网页中刊载的文章或图片涉及侵权,请提供相关的权利证明和身份证明发送邮件到support@aicoin.com,本平台相关工作人员将会进行核查。