Original author: Darko, IOSG
The inflow of funds into ETFs is often seen as a "thermometer" of institutional confidence in Bitcoin. However, week after week, it measures something else: a hidden rate trade that is repeatedly opened and closed. This article clarifies how to identify it, how large this trade is, and why it is quietly exiting the stage.
TL;DR
- Looking week by week, ETF fund flows are primarily driven by a hidden arbitrage trade, rather than conviction. Cash-and-carry arbitrage traders buy ETFs while shorting futures on the CME to hedge price risk, but in terms of data, they cannot be distinguished from true bulls. About half of the fluctuations in weekly flows can be explained by new futures shorts from hedge funds, with a correlation of up to 0.70.
- The weekly price movements of Bitcoin are almost unable to explain fund flows. Using price returns to predict ETF fund flows yields results statistically indistinguishable from zero. Weekly funds are not chasing price performance but are synchronized with a hedged rate trade.
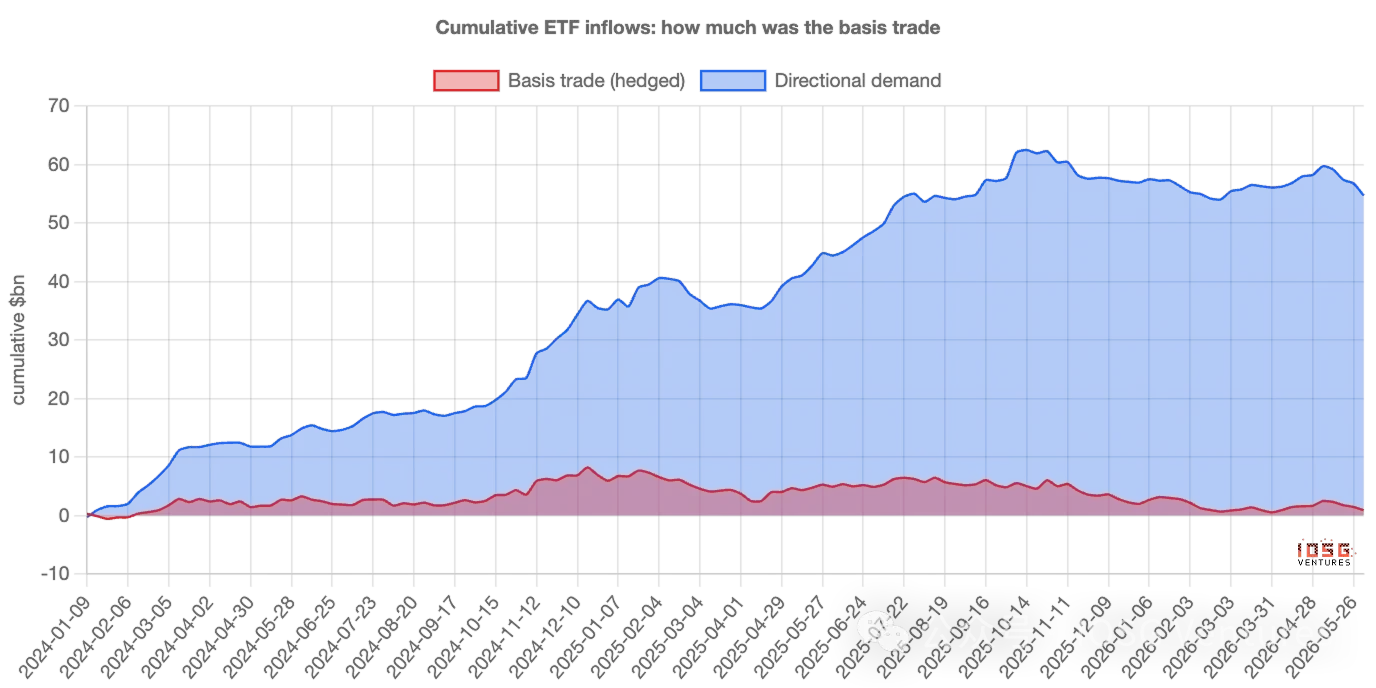
- Arbitrage dominates the weekly "volatility," but it has never been the main contributor to "stock." Of the approximately $55 billion accumulated in ETF inflows, the net amount from arbitrage trades currently only accounts for about $1 billion; the remainder consists of stable, directional buying, about $400 million per week, which compounded over two years nearly constitutes the entirety of the "mountain."
- The correct statement is: ETF fund flows overestimate the "volatility" of conviction, rather than its "level." The weekly rises and falls are mostly "rented" — arbitrage capital comes and goes; while the truly accumulated assets are mostly "owned."
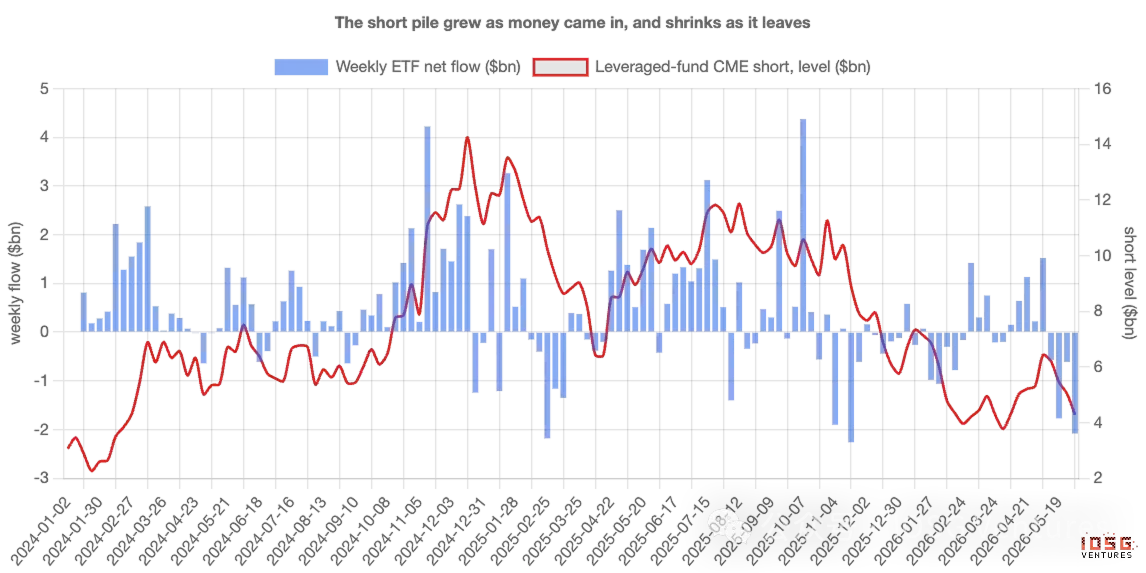
- This trade is exiting, and has been for two years. Leverage fund short positions have risen from about $3 billion at issuance to about $14 billion by the end of 2024, then steadily fell back to around $4.5 billion. Once the basis is compressed to a level that is no longer profitable, fund inflows and shorts will decline in tandem — do not misconstrue the resulting fund outflows as the market passing judgment on Bitcoin.
1. The Number Everyone is Watching
Every week, Bitcoin ETFs announce how much money has flowed in or out, and this number is often treated as a verdict. Large inflows signify institutional influx; outflows indicate wavering confidence. Fund flow data has silently become the headline indicator for gauging market conviction.
The problem is, not everyone buying ETFs is betting on Bitcoin. Some of the largest buyers do not care where the price goes — once they are taken into account, the weekly fund flow number reflects more their activity than anyone’s conviction. To understand why, one must first recognize a distinctly different category of buyers.
A Class of Buyers Unconcerned with Price
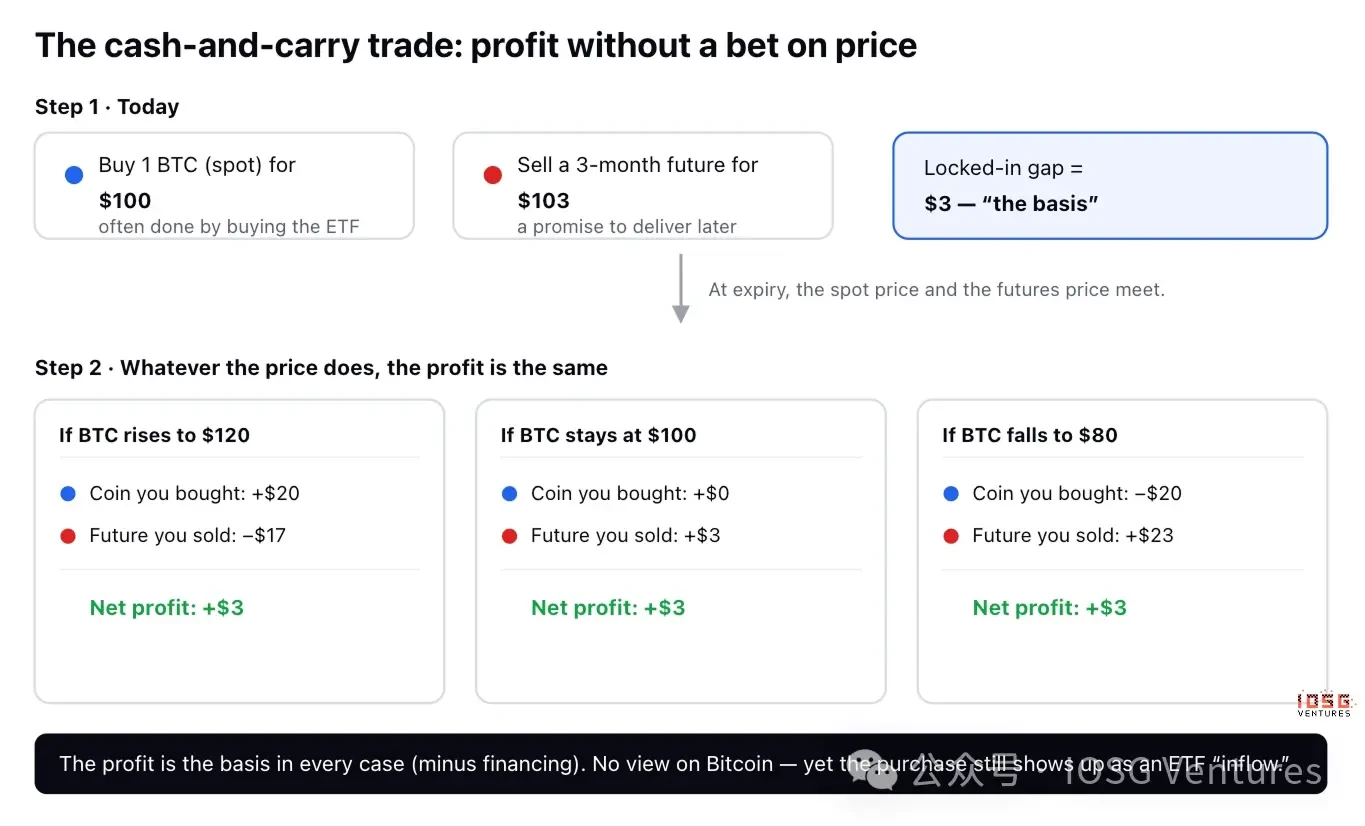
There is a classic and tedious trade called cash-and-carry arbitrage. Bitcoin "futures" are merely contracts to buy or sell Bitcoin at an agreed price at some future date, and most of the time, the futures price is slightly higher than the current spot price — for instance, if Bitcoin is currently $100, a contract expiring in three months might sell for $103.
Traders can hold no opinion on the price and simply capture that $3 price difference:
- Buy 1 Bitcoin, spending $100 today (often achieved through buying ETFs).
- Sell futures at $103, committing to delivery in three months.
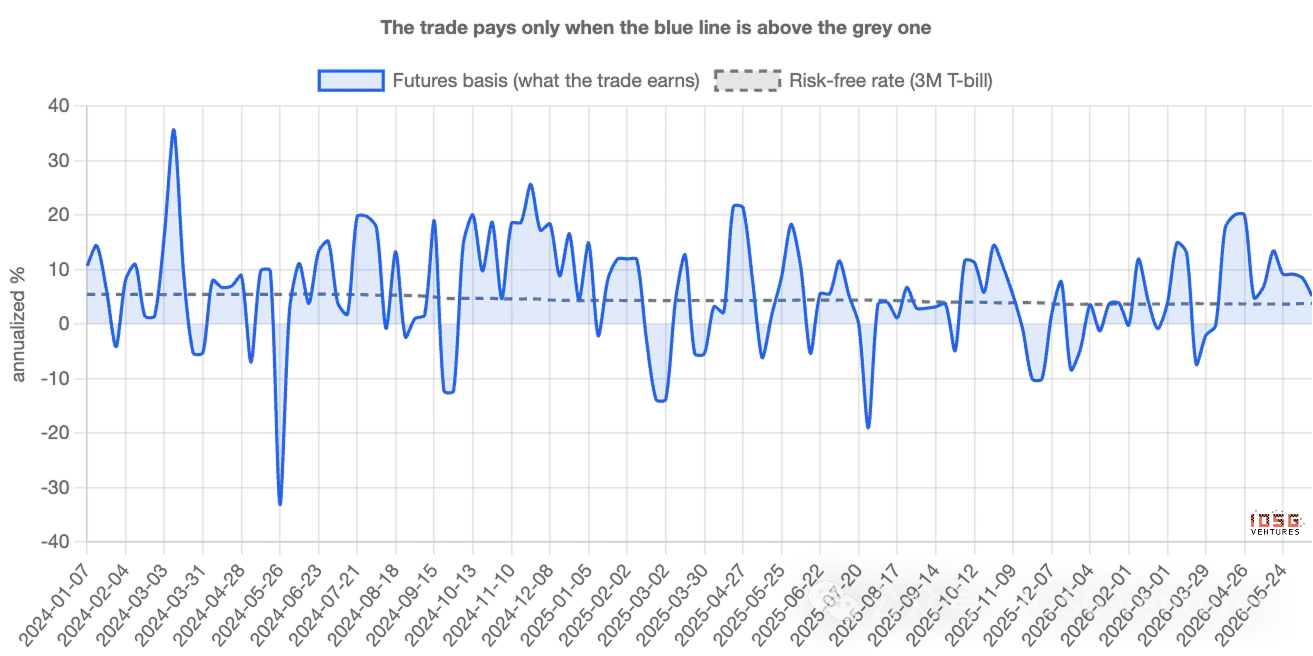
Let's see what happens at expiration. If Bitcoin skyrockets to $120, the trader earns $20 on the coin but loses $17 on the contract — a net gain of $3. If it crashes to $80, they lose $20 on the coin but gain $23 on the contract — still a net gain of $3. If it stays the same, it’s still $3. No matter the scenario, the profit is the same. The direction is hedged, which traders call “delta neutral.” This $3 price difference, when annualized, is the basis — essentially the interest rate that traders earn by keeping their funds in this trade; as long as it is higher than the risk-free return from US Treasury bills (T-bills), the trade is worthwhile.
Why This Pollutes the Headline Number
Here is the crux. The first leg — buying 1 Bitcoin — is commonly executed by buying ETFs. Thus, a trader with no opinion on Bitcoin, engaging in a delta neutral trade, appears as a fund inflow in ETF data, seemingly indistinguishable from a true believer.
When a large number of cash-and-carry trades are established, the inflow appears strong, creating a narrative of "institutions are ramping up" — even though this money is hedged and will immediately reverse once the trade is no longer profitable. In other words, the fund flow numbers measure not just conviction, they measure the activity level of the arbitrage trade desk. The challenge lies in how to separate the two — and how large each one is.
How to Distinguish the Two
Cash-and-carry traders leave a second footprint. For every $1 worth of Bitcoin they buy, they short $1 worth of futures on the CME (a regulated US exchange where institutions trade Bitcoin futures). True believers leave only the first footprint; arbitrageurs leave both.
And the second footprint is public. The US derivatives regulatory authority releases weekly reports disclosing the long and short positions of various traders on the CME. One category — leveraged funds — essentially hedge funds — is where the cash-and-carry arbitragers congregate. Thus, you can compare the inflow of funds into ETFs with the new short positions established by these funds each week. If "demand" is truly conviction, the two should not correlate significantly; if a large part of it is that hidden trade, then they should move in the same direction.
2. What the Data Says: Week by Week, Fund Flows Follow Futures, Not Prices
The two move closely together. Since the ETF launched, in every week where new short futures are established, ETF fund inflows are also greater — it's almost one-to-one. About half of the fluctuations in weekly fund flows can be explained by this one factor: how many new shorts funds have made. The correlation is 0.70, the kind of strength you would see between two clearly related things, not coincidental ones.
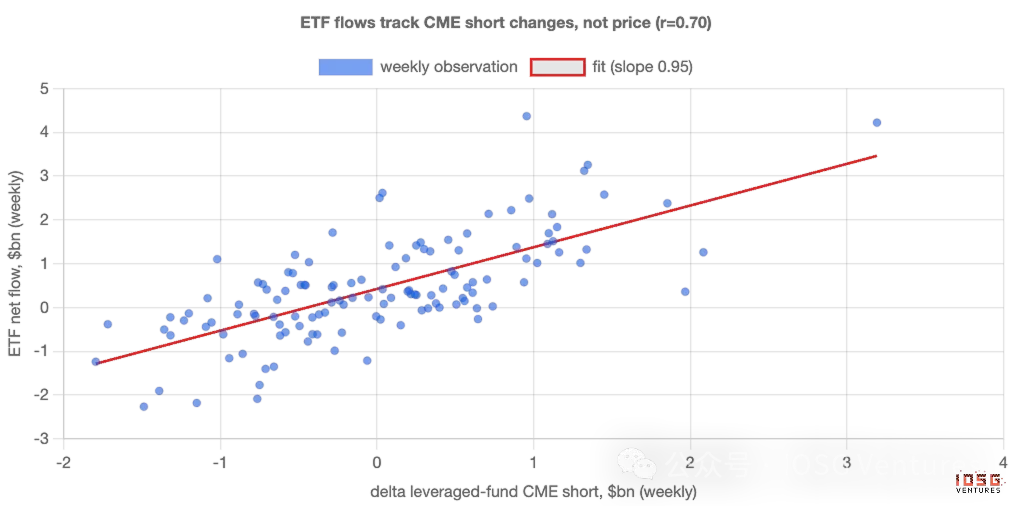
The point that should alert believers the most: the price itself explains almost nothing. Testing whether that week's Bitcoin return can predict ETF fund flows yields results statistically indistinguishable from zero. Weekly funds are not chasing performance; they are keeping pace with a hedged rate trade.
Thus, as a weekly signal, ETF "demand" is primarily arbitrage. The fund flow number is a poorly constructed thermometer of conviction, because its rises and falls are the result of the basis trade being repeatedly opened and closed, not any change in anyone's perspective on Bitcoin.
But How Much of the Fund is This Trade?
This is where the simplistic mantra — "it's all fake" — falls short, while the true story is more interesting. The basis trade dominates weekly volatility, but has never been the main component of funds.
Breaking down each week’s inflows into the portion explained by futures shorting (hedged) and the remainder (directional), then aggregating since issuance. Of the approximately $55 billion accumulated in ETF inflows, the basis trade's current net amount is only about $1 billion — the rest is stable, directional buying. This buying is about $400 million per week, compounded over two years, irrespective of the basis or price, it nearly constitutes the entire mountain.
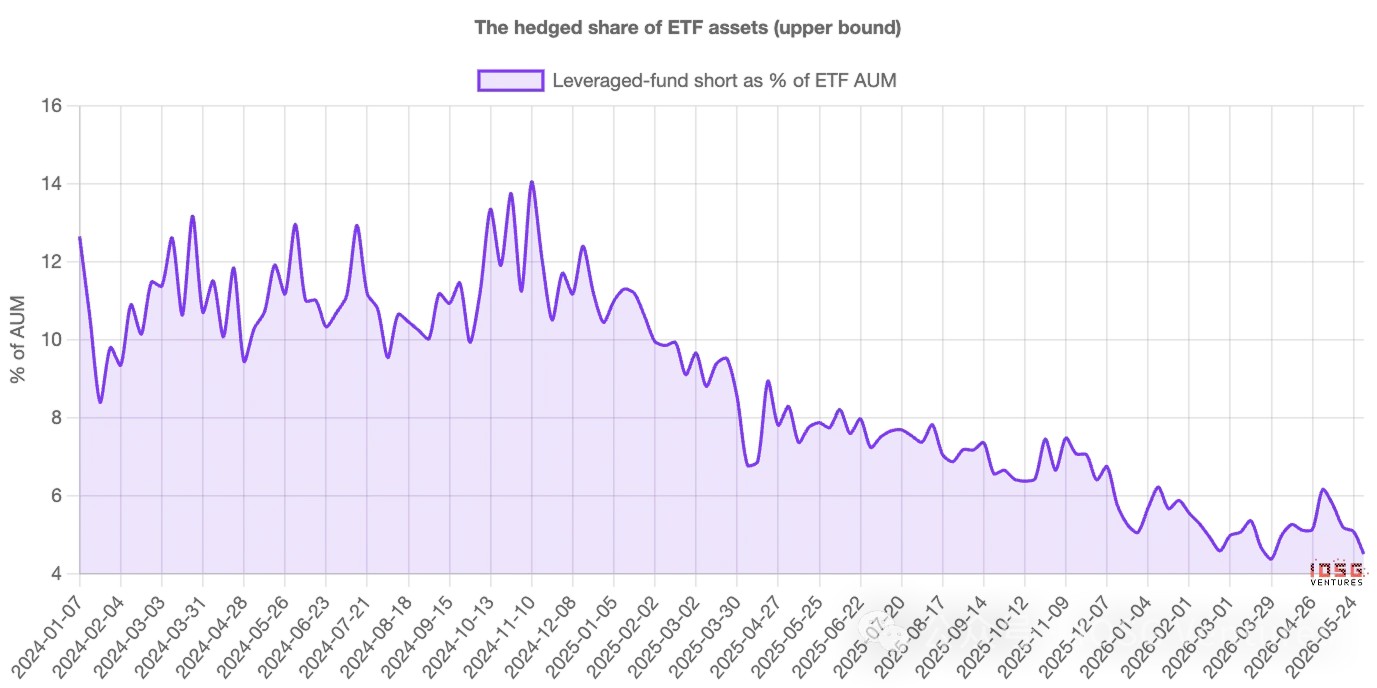
Looking at asset proportion rather than fund flows yields a similar picture: the hedged portion at one point approached 14% of ETF assets in 2024, now it is about 4%-5%. At its peak, it was a notable minority, but now it is just a small slice.
So, a more accurate statement is: ETF fund flows overestimate the volatility of conviction, rather than its level. The weekly ups and downs are mostly "rented" — arbitrage capital comes and goes; but the truly accumulated assets are largely "owned." This trade swirls around in the fund flow data but has never been the main part of the balance.
And this trade is exiting
The hedged portion has not only remained small — it has been shrinking for two years. The short positions of leveraged funds have risen from about $3 billion at issuance, accumulating to about $14 billion by the end of 2024, then steadily falling back to about $4.5 billion. This arbitrage trade has been unwinding throughout the entire period, not just recently.
This is important for interpreting the present. By June, hedged positions roughly halved again — funds' shorts shrank from about $6.4 billion to $4.3 billion — during which time ETFs were seeing daily outflows of $300 million to $500 million. At face value, these numbers appear to indicate panic selling. However, when combined with futures data, this is merely a routine unwinding of a rate trade that is no longer profitable. The same outflow number tells two entirely different stories.
When the Basis Compresses, Demand Fades
The cleanest evidence is what happens when this trade is no longer profitable. When that $3 price difference narrows to approach the level that traders can earn risk-free, the trade is no longer worthwhile. If a large part of weekly demand truly is this trade, then demand should weaken precisely when the price difference compresses — and that is indeed the case. Removing the trends from each sequence and observing moments before and after a compression: ETF fund flows drop below their usual rhythm while funds simultaneously cover shorts; both occur in tandem. Demand and trade breathe together.
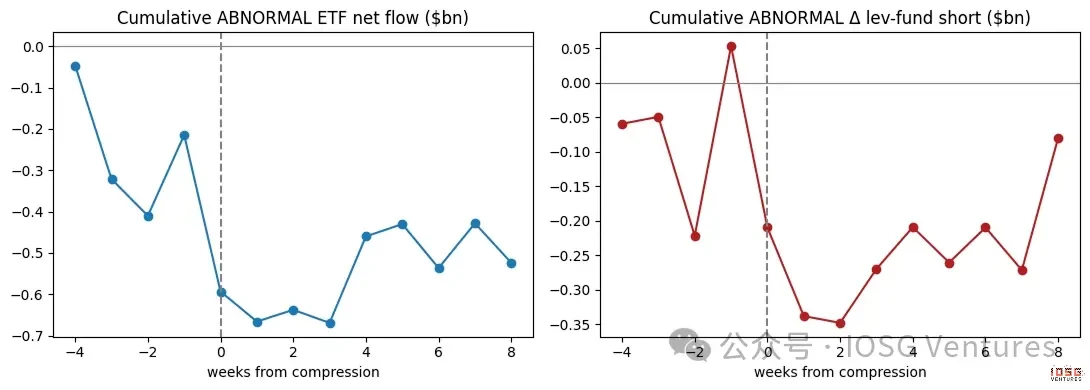
True believers do not care about the futures basis. And this weekly "demand" clearly does.
3. Who Goes First, and Who is Really Operating
First, this association is concurrent — the tightest within the same week, with no clear leading or lagging; and the only little directional evidence actually points in the opposite direction: it is ETF fund flows that drive the shorts, not the other way around. This aligns with the logic of paired trading: first buying ETFs, then the futures hedge follows, instead of shorts "creating" fund inflows out of thin air. Second, the arbitrage crowd is not the only driver. Fund flows track leveraged fund shorts closely, but they also resonate with directional institutions' positions — both types of buyers are active. The argument presented in this article is not that every inflow is hedged; rather, it is that hedge trades are the tightest and most reliable driving factors in weekly fluctuations.
Ethereum: The Same Trade, but the Numbers Are Hard to Make Sense Of
Applying the same examination to Ethereum ETFs shows similar characteristics but weaker — the correlation with futures shorts is more tenuous, and the underlying stable directional buying is nearly nonexistent. The reason is clear. Holding spot Ethereum rather than futures means forgoing the staking yield offered by Ethereum, around 3%-4% annually. After accounting for this, Ethereum's basis is often negative — arbitrage trades often cannot even meet its benchmark yield. Thus, Ethereum ETFs neither have strong conviction buying nor robust arbitrage positions to support them; they are simply smaller and noisier versions of their Bitcoin counterparts.
4. How to Interpret ETF Fund Flows from Now On
The key is not to judge price but to have a methodology for interpreting fund flows. When the basis is rich, the expected "institutional demand" will appear robust and largely hedged — do not misconstrue this strength as conviction. When the basis compresses, expect fund inflows and shorts to decline together — do not misinterpret the resulting outflows as the market passing judgment on Bitcoin. The two numbers worth monitoring are: the basis annualized return relative to T-bill rate levels, and the net shorts of leveraged funds in the weekly CME report. They will tell you how much of the next "demand" headline is real.
How We Calculated
A few honest limitations. The basis is constructed from the most recent month of CME futures contracts relative to spot prices, excluding the last few days before each expiration (their very short expiration times can magnify rounding errors into false spikes); constructing sequences on a contract-by-contract basis sharpens the exact figures but does not change the conclusions. There is a strong directional relationship between fund flows and shorts, rather than proof that one causes the other — the emphasis is that they are two halves of the same trade. The number of futures shorts is an upper bound on the percentage of ETF buys that were hedged, as some shorts hedge coins held elsewhere.
None of this changes the core message. Week by week, the "demand" for Bitcoin ETFs is primarily a hidden rate trade, rather than conviction — fund flows measure the level of activity participating in arbitrage far more accurately than they measure belief. And that real buying is genuine and patient, now making up the vast majority left, because that "rented" portion has taken two years to return home.
免责声明:本文章仅代表作者个人观点,不代表本平台的立场和观点。本文章仅供信息分享,不构成对任何人的任何投资建议。用户与作者之间的任何争议,与本平台无关。如网页中刊载的文章或图片涉及侵权,请提供相关的权利证明和身份证明发送邮件到support@aicoin.com,本平台相关工作人员将会进行核查。


