Dear friends of AICoin, I am Sister Qinglan. Early this morning, the market received two significant pieces of news: first, the probability of a 25 basis point rate hike by the Federal Reserve in July has dropped to 38.5%, reigniting expectations for liquidity easing; second, the Iranian Revolutionary Guard announced the closure of the Hormuz Strait, sharply increasing geopolitical risks. These two pieces of news, one positive and one negative, directly caused Bitcoin to experience violent fluctuations after breaking through 64000 USDT early in the morning. As of now, BTC is reported at 64275 USDT, with a 24-hour increase of 1.28%, but market sentiment remains in a state of extreme fear, with the fear and greed index at only 23. This intertwining of bullish and bearish factors is precisely when our Qinglan Crypto Class TPV system shows its advantages. Today we will use data to analyze the current market situation.
Current Price and Time
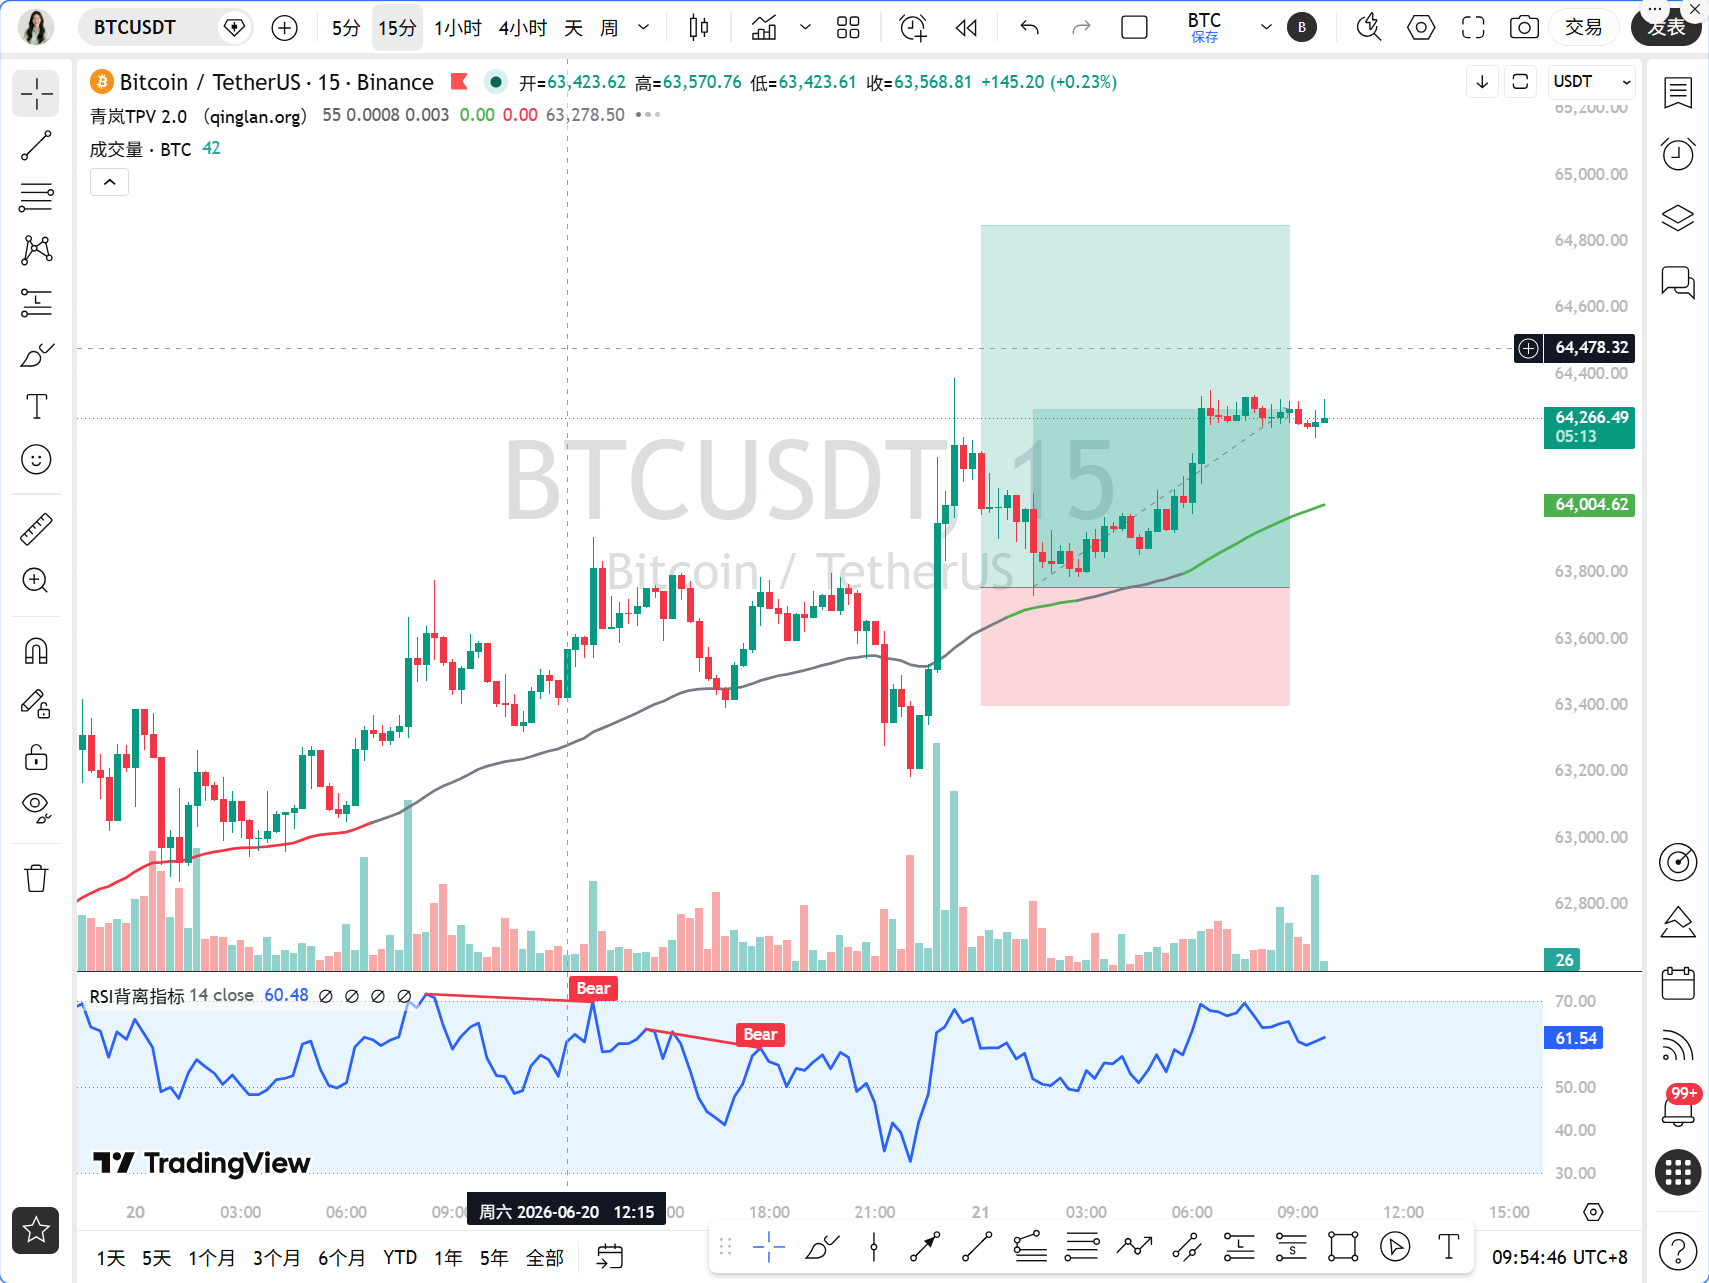
The current time is June 21, 09:54, and the latest transaction price of BTC is 64275 USDT. Within 24 hours, Bitcoin has rebounded from a low of around 63000 to a high of 64500, and is currently in a high-level consolidation phase. In terms of trading volume, the whole network saw a liquidation of 180 million US dollars in the past 24 hours, with significant losses on short positions, indicating that short-term bearish forces are being suppressed, but whether the bulls can continue to push higher will depend on the breakthrough of key positions.
Multi-Cycle Status Overview
From the daily chart perspective, BTC's price is between MA5 (63916) and MA10 (64537), while MA30 (67431) remains above, forming resistance. The MACD column value is 505.77, still positive; however, both DIF and DEA are in the negative zone, indicating that the daily level is still in a repairing phase of the bearish trend. The RSI is at 54.11, in the neutral to strong area but has not yet entered the bull-dominant range.
Switching to the 4-hour cycle, the price is above MA5 (64071) and MA10 (63726), but MA30 (64239) is just overhead, creating short-term pressure. The MACD column value is 170.88, and while DIF and DEA are still negative, the difference is narrowing, indicating that the rebound momentum at the 4-hour level is accumulating. The RSI is at 72.05, close to the overbought area, suggesting a risk of short-term pullbacks.
The 1-hour cycle is the core observation window for today. MA5 (64230), MA10 (64068), and MA30 (63738) are all in a bullish arrangement, with EMA55 (63739) serving as the dividing line between bulls and bears; the current price of 64275 is clearly above this line. The MACD column value is 31.54, both DIF and DEA are positive, with DIF above, indicating that the 1-hour level is in a bullish trend. The RSI is at 65.10, in a strong zone but not overheated.
The 15-minute cycle shows that the price is fluctuating around 64275, with MA5 and MA10 merged. The MACD column value is -12.24, and both DIF and DEA are close to the zero axis, with an RSI of 46.16, in the neutral zone. This indicates that short-term momentum has weakened, and the market is waiting for directional choice.
TPV Signal Verification
According to Qinglan Crypto Class's TPV system, we first use the 1-hour EMA55 to determine the trend. The current price of 64275 is far above EMA55 (63739), and in the past 8 1-hour K-lines, the closing price was greater than EMA55 8 times, with a crossover count of 0, an absolute amplitude of 0.84%, which does not meet the oscillation threshold, indicating that we are currently in a one-sided bullish trend.
Next, we verify the conditions for going long. First, the price stays above the 1-hour EMA55, with two consecutive 1-hour K-line closing prices greater than EMA55, which is already satisfied. Second, the support has stabilized, as the price formed a long lower shadow near 63000 and bounced back, reaching the 4-hour MA10 support, constituting an effective low-point rebound. Third, regarding the exhaustion of downward momentum, the 1-hour MACD column briefly shortened and then expanded again during the early morning, while RSI rose from around 30 to 65, also showing a bullish engulfing pattern. All three conditions are met, and the TPV system gives a bullish signal.
However, it should be noted that the 4-hour RSI is close to overbought, and the daily MA10 still exerts pressure. Therefore, this bullish signal is of a short-term rebound nature and not a trend reversal. If the price breaks below EMA55, the bullish signal will be invalidated.
On-chain/Funding Situation
On the on-chain data front, the fear and greed index is only 23, in an extreme fear range, which usually indicates that market sentiment is extremely pessimistic, often characteristic of a phase bottom. However, combined with geopolitical risks, this fear might persist. BTC's market share is at 56.26%, indicating that funds are still seeking refuge in Bitcoin, while altcoins show relatively weak performance.
From a funding perspective, the cooling expectations for Federal Reserve interest rate hikes are a medium-term positive, but the unexpected event of Iran closing the Hormuz Strait could trigger global risk-averse sentiment, leading to a short-term outflow of funds from risk assets. In the 24-hour liquidation data, short positions have suffered heavy losses, indicating that shorts have been squeezed, but whether the bulls can sustain this needs to be observed based on subsequent fund inflows.
Key Offensive and Defensive Positions
The first resistance level above is at 64500, which is where the 4-hour MA30 is located and also the area of today’s high point. If broken, the next target level is at the round figure of 65000, which coincides with the daily MA10 and a previously active trading area. Further resistance is in the range of 66000-66500, corresponding to the daily MA30.
The first support level below is at 64000, which is the merging area of the 1-hour MA5 and MA10. If broken, the next support is at 63700, which is where the 1-hour EMA55 is located; this is the dividing line between bulls and bears, and breaking below it would turn the trend bearish. Further support is at 63000, which is the area of today’s low and also the 4-hour MA10 support.
Trading Thought
Direction: Short-term bullish, but caution is needed for pullback risks.
Entry Conditions: If the price pulls back to the 64000-64100 region, and a long lower shadow or a bullish reversal pattern appears on the 1-hour K-line, while the MACD column does not continue to shorten, a small long position can be taken. If the price directly breaks through 64500 and stabilizes, a long position can be pursued.
Stop-Loss Position: The long position stop-loss is set below 63700, which is below the 1-hour EMA55. If the price breaks below EMA55, it indicates that the bullish signal is invalidated and one must exit.
Target Levels: The first target is at 64500, the second at 65000, and the third at 66000. If a long upper shadow or bearish reversal pattern appears near 64500, partial profit-taking can be considered.
Note: If the price oscillates repeatedly in the 64000-64500 range, and the 1-hour MACD column continues to shorten, it indicates insufficient bullish momentum; trading should be paused and wait for clearer signals.
Risk Warning
Geopolitical risks may trigger severe market fluctuations at any time. Please strictly control your position size, with a single position risk not exceeding 2% of the total capital.
Follow Qinglan Crypto Class to seize more trading opportunities! Please visit the official website www.qinglan.org
📊 Qinglan TPV Trading Strategy Backtest Reference
🕒 Last Backtest Time 06-21 07:00:01
Total Analysis: 2395 Backtests: 1860 Accuracy Rate: 71.2% (1324/1860)
免责声明:本文章仅代表作者个人观点,不代表本平台的立场和观点。本文章仅供信息分享,不构成对任何人的任何投资建议。用户与作者之间的任何争议,与本平台无关。如网页中刊载的文章或图片涉及侵权,请提供相关的权利证明和身份证明发送邮件到support@aicoin.com,本平台相关工作人员将会进行核查。