Original author: Token Terminal
Original translator: Saoirse, Foresight News
Ethereum is the core underlying settlement network for on-chain assets, relying on ETH for transaction fees and staking to maintain network security. Traditional finance has pain points such as slow settlement, many intermediaries, and high counterparty risk, while tokenized assets and stablecoins provide on-chain solutions. By 2025 to 2026, relevant regulations will gradually mature, and institutional layouts for on-chain businesses will officially have the conditions to land.
Various stablecoins, tokenized funds, commodities, and on-chain stocks are issued and settled on Ethereum, with layer two networks diverting transactions that ultimately return to layer one for confirmation, allowing ETH to continuously accumulate value. By market capitalization, Ethereum remains the largest hosting platform for tokenized assets globally, operated jointly by the Ethereum Foundation and developer community, with teams like Etherealize specifically connecting with traditional financial institutions to promote institutional funds entering the market. In the first quarter of 2026, Ethereum’s ecosystem showed a polarized trend, detailed below combining complete data from Token Terminal.
In the first quarter of 2026, the market displayed a distinct duality: the scale of on-chain usage reached a historical peak — active monthly users, total transaction volume, and throughput all set new records; however, the scale of assets denominated in dollars and transaction fee indicators contracted simultaneously, entirely diluting total market value, total locked assets, transaction volume, and both types of fee data all declined quarter-on-quarter. Key events in this quarter profoundly shaped this unique market condition:
In January, the second round of the Fusaka upgrade cycle, which included Blob parameter fork (BPO#2), significantly enhanced data storage capacity;
In February, the ERC-8004 standard went live on the mainnet, becoming a universal specification for AI intelligent entity identity and credit rating;
The Ethereum Foundation confirmed the three core goals for the 2026 protocol: expansion, optimization of user experience, and strengthening layer one security;
In March, an institutional Ethereum forum was held, with significantly increased participation from traditional financial institutions.
Key indicators for the first quarter of 2026 overview
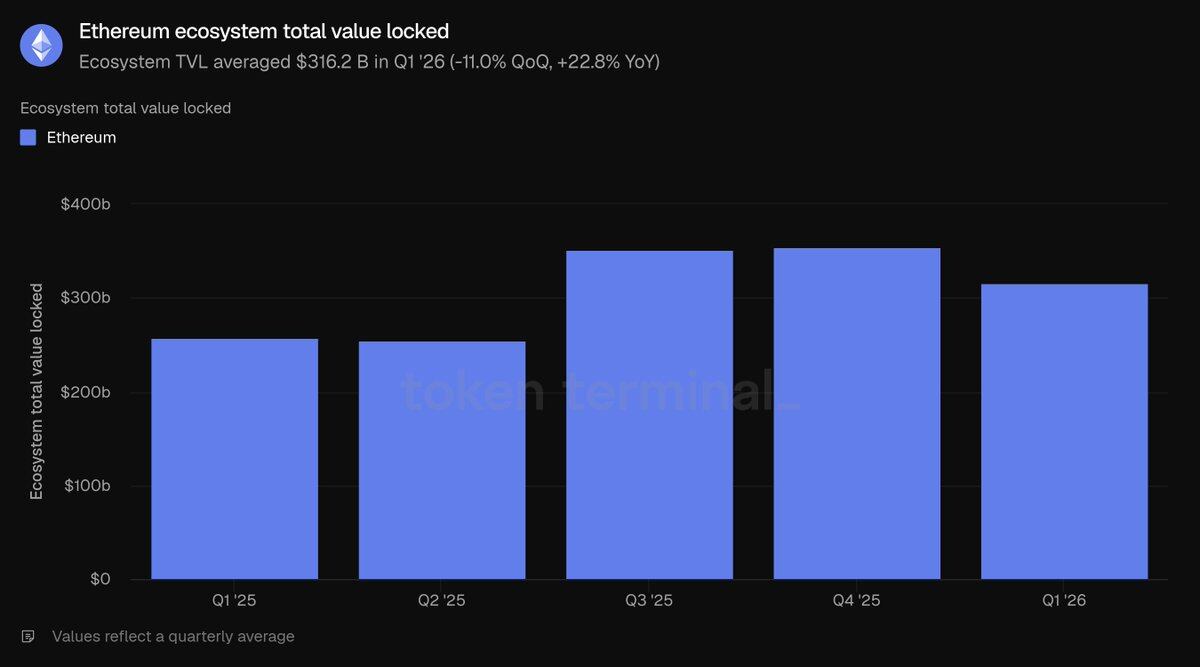
Total assets locked in the ecosystem: 316.2 billion dollars (quarter-on-quarter -11.0%, year-on-year +22.8%)
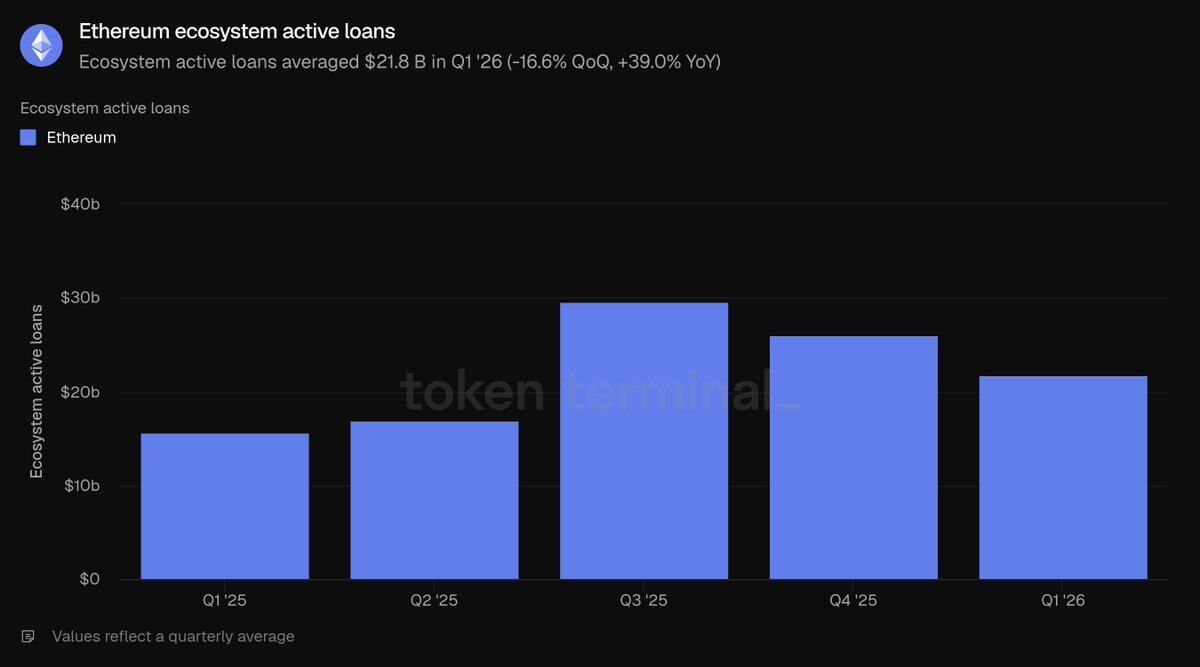
Total active loans outstanding in the ecosystem: 21.8 billion dollars (quarter-on-quarter -16.6%, year-on-year +39.0%)
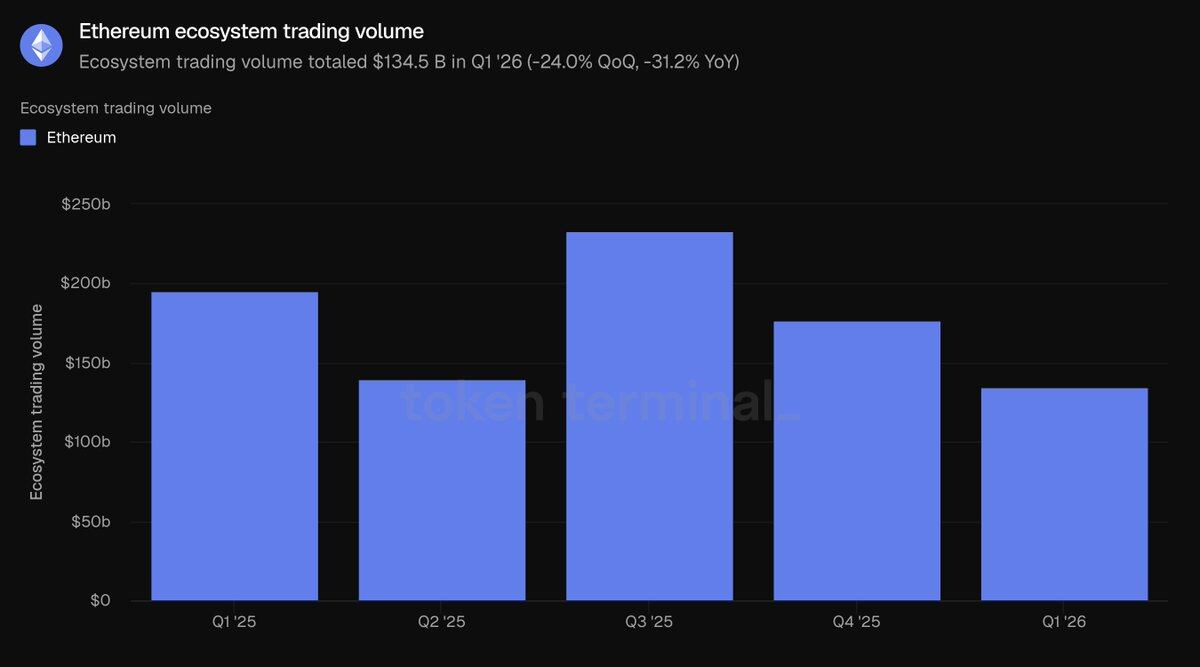
Total transaction volume on decentralized exchanges in the ecosystem: 134.5 billion dollars (quarter-on-quarter -24.0%, year-on-year -31.2%)
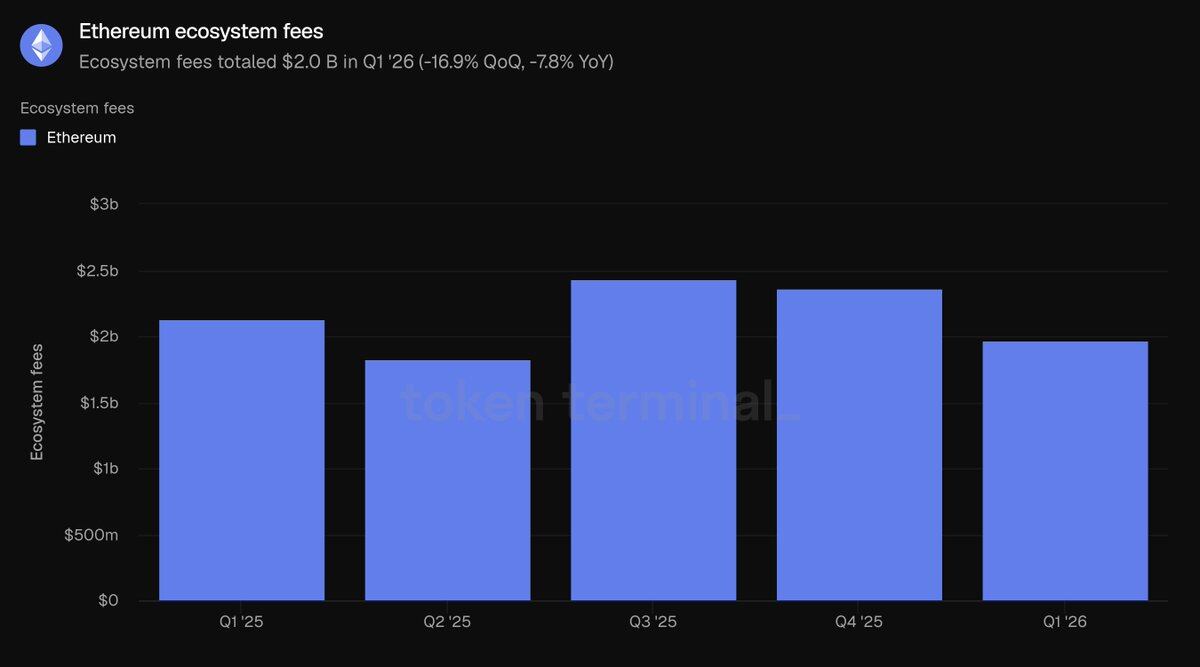
Total revenue from all ecosystem application transaction fees: 2 billion dollars (quarter-on-quarter -16.9%, year-on-year -7.8%)
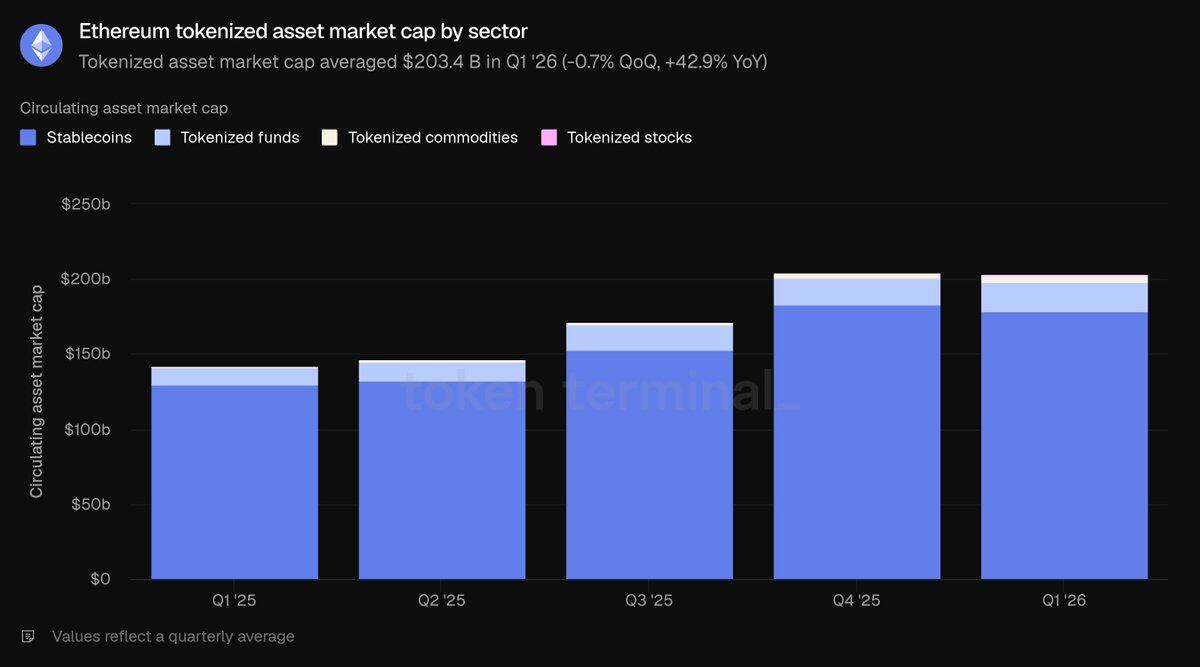
Total market cap of on-chain tokenized assets: 203.4 billion dollars (quarter-on-quarter -0.7%, year-on-year +42.9%)
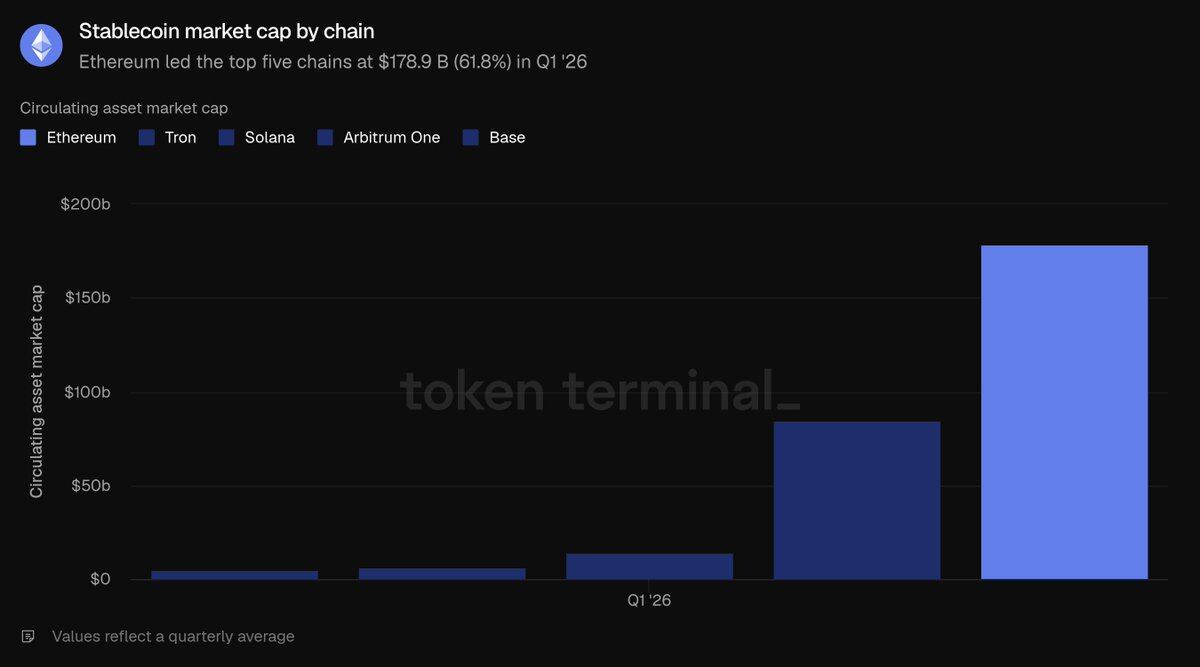
Stablecoins: 178.9 billion dollars (quarter-on-quarter -2.3%, year-on-year +37.6%)
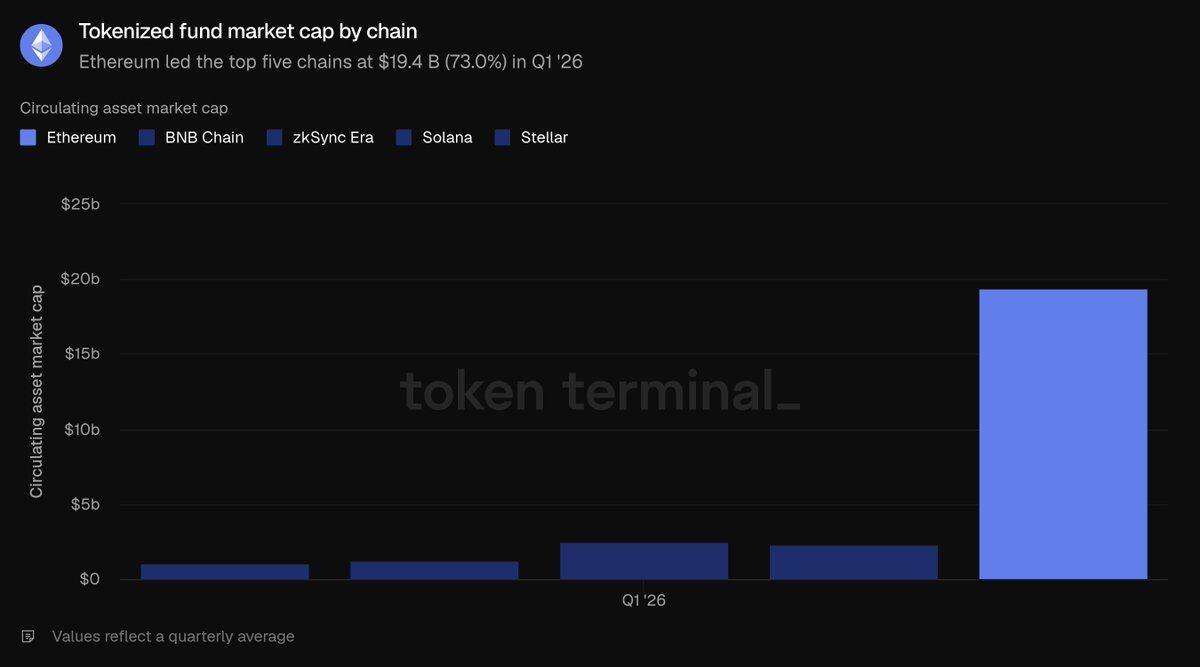
Tokenized funds: 19.4 billion dollars (quarter-on-quarter +4.9%, year-on-year +73.1%)
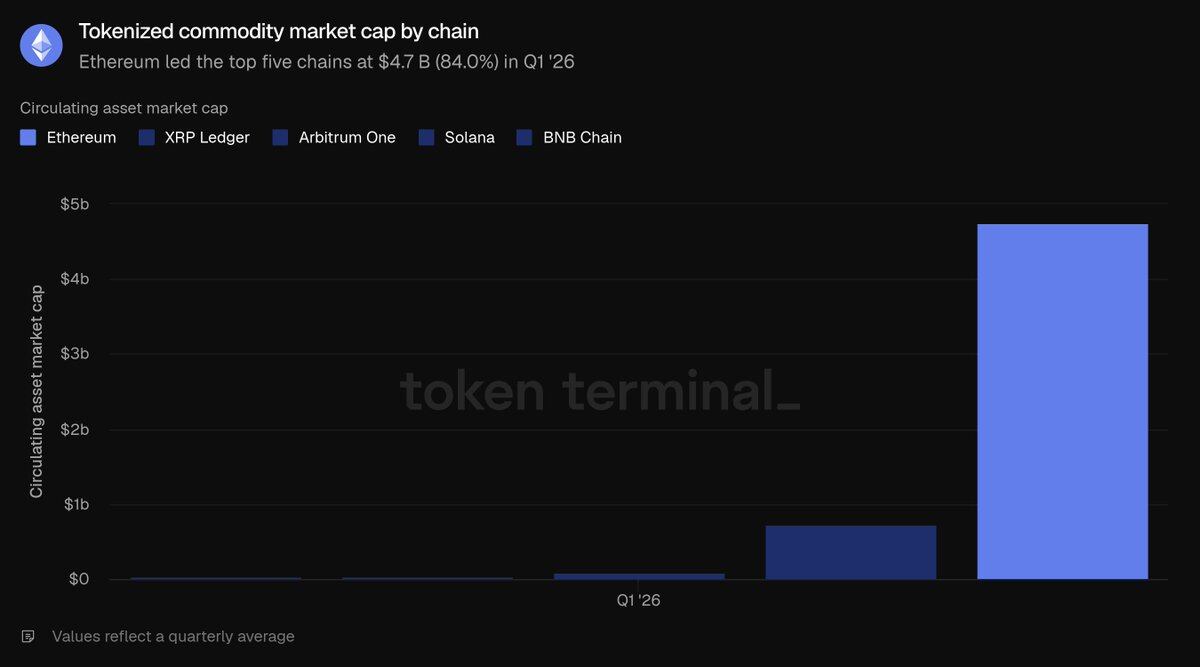
Tokenized commodities: 4.7 billion dollars (quarter-on-quarter +60.0%, year-on-year +325.9%)
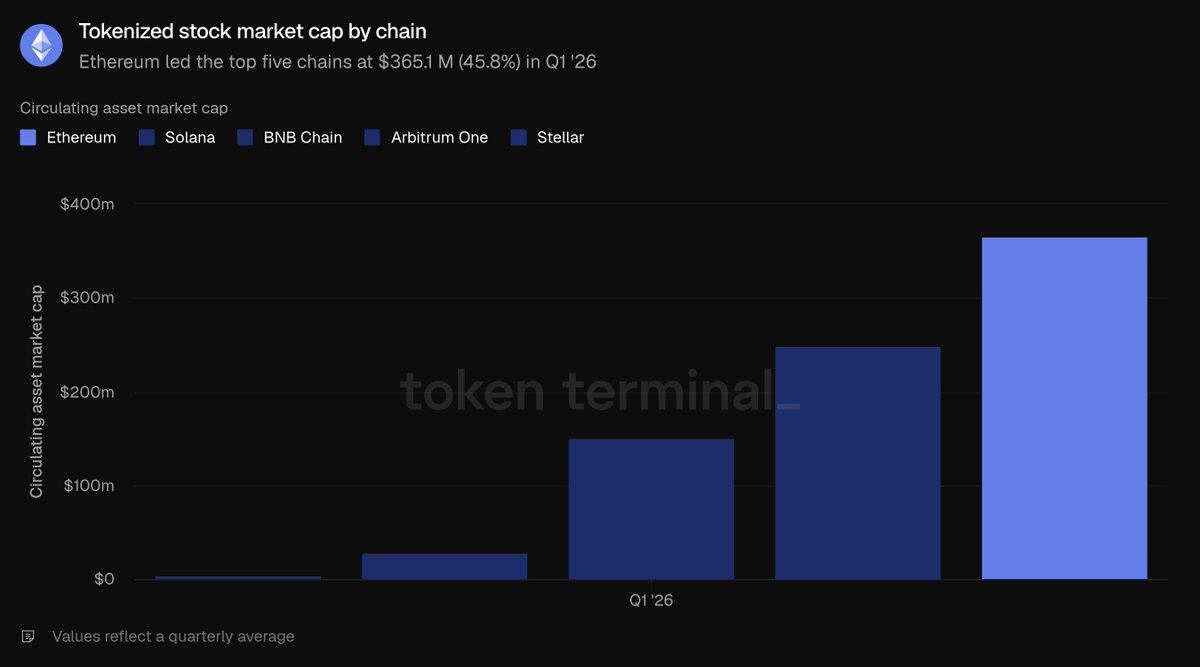
Tokenized stocks: 365.1 million dollars (quarter-on-quarter +16.5%)
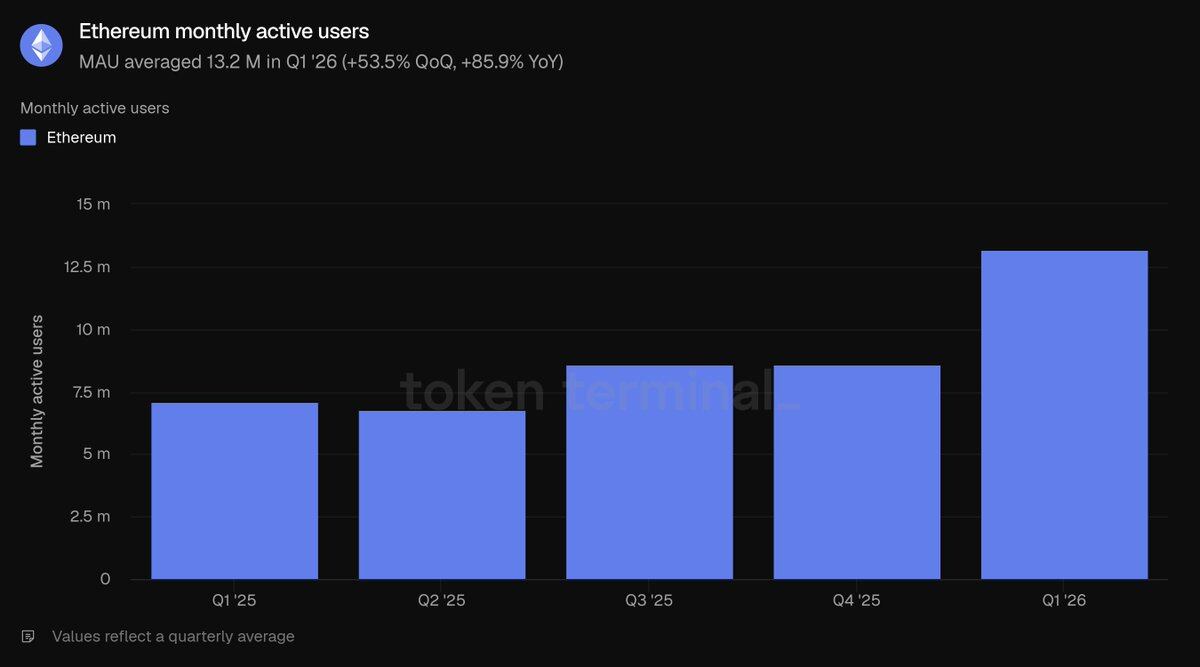
Monthly active user addresses: 13.2 million (quarter-on-quarter +53.5%, year-on-year +85.9%)
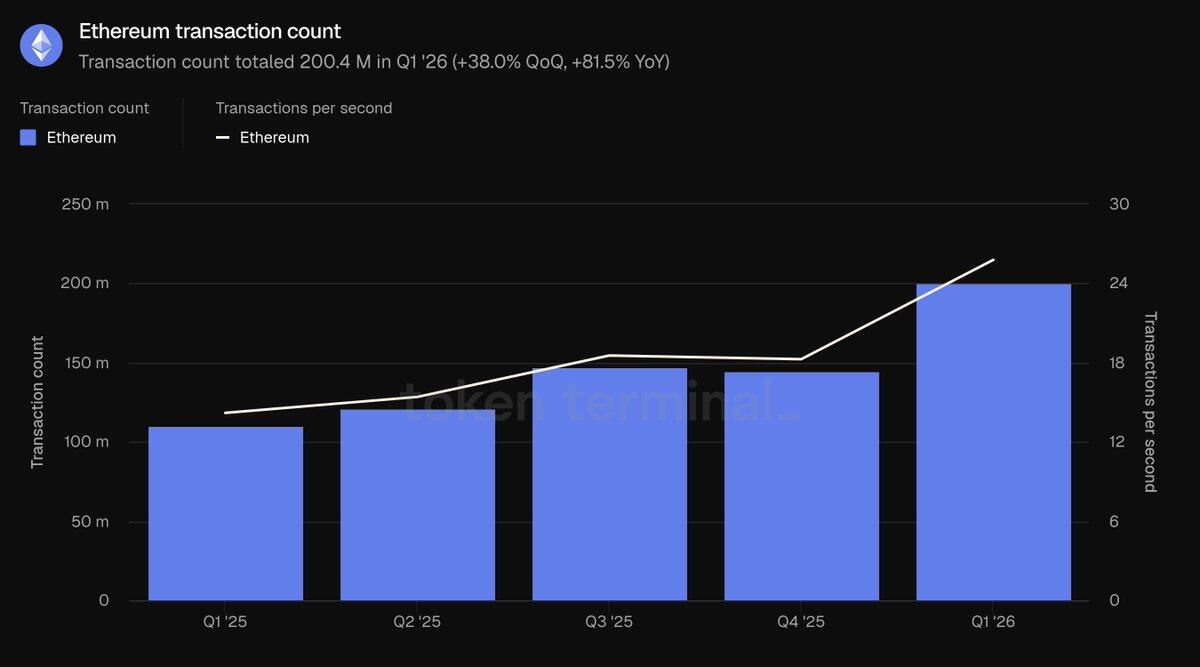
Total transaction count on layer one: 200.4 million (quarter-on-quarter +38.0%, year-on-year +81.5%)
Average transactions processed per second: 25.78 (quarter-on-quarter +41.2%, year-on-year +81.7%)
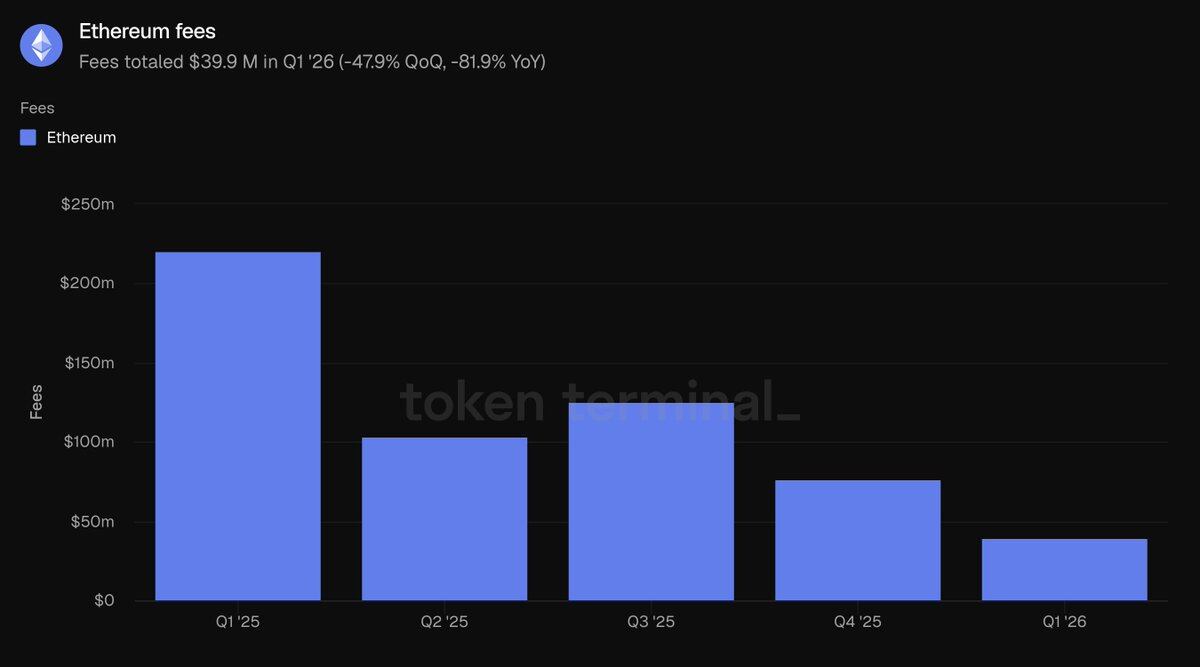
Total transaction fee revenue on layer one mainnet: 39.9 million dollars (quarter-on-quarter -47.9%, year-on-year -81.9%)
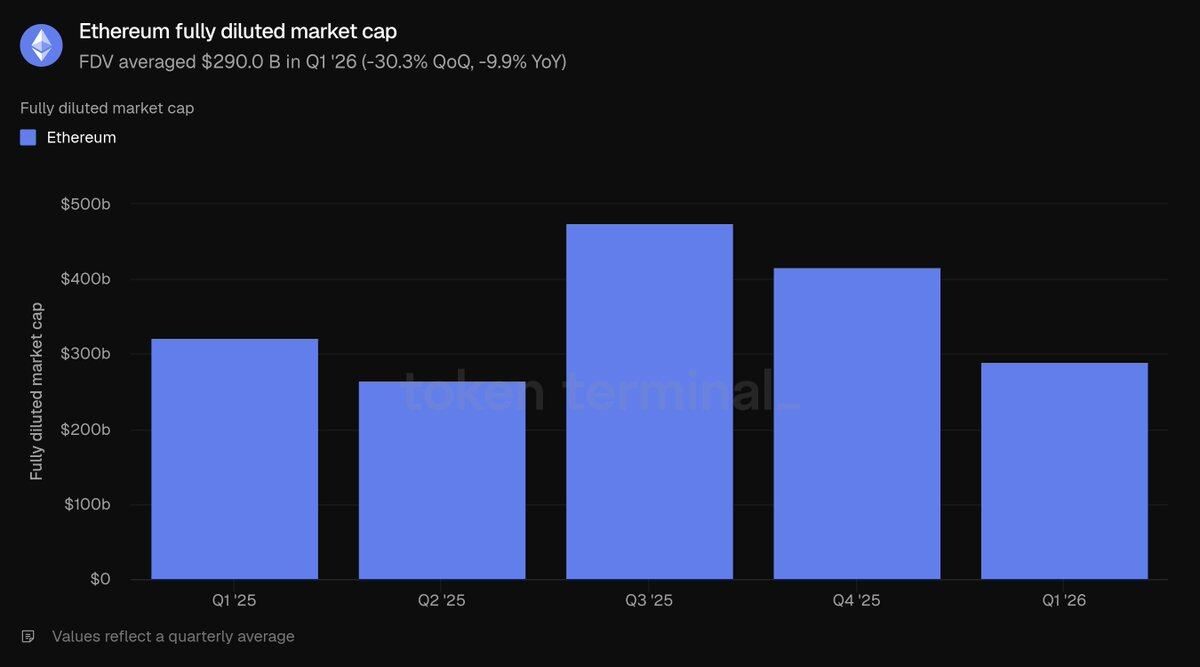
Fully diluted total market cap of ETH: 290 billion dollars (quarter-on-quarter -30.3%, year-on-year -9.9%)
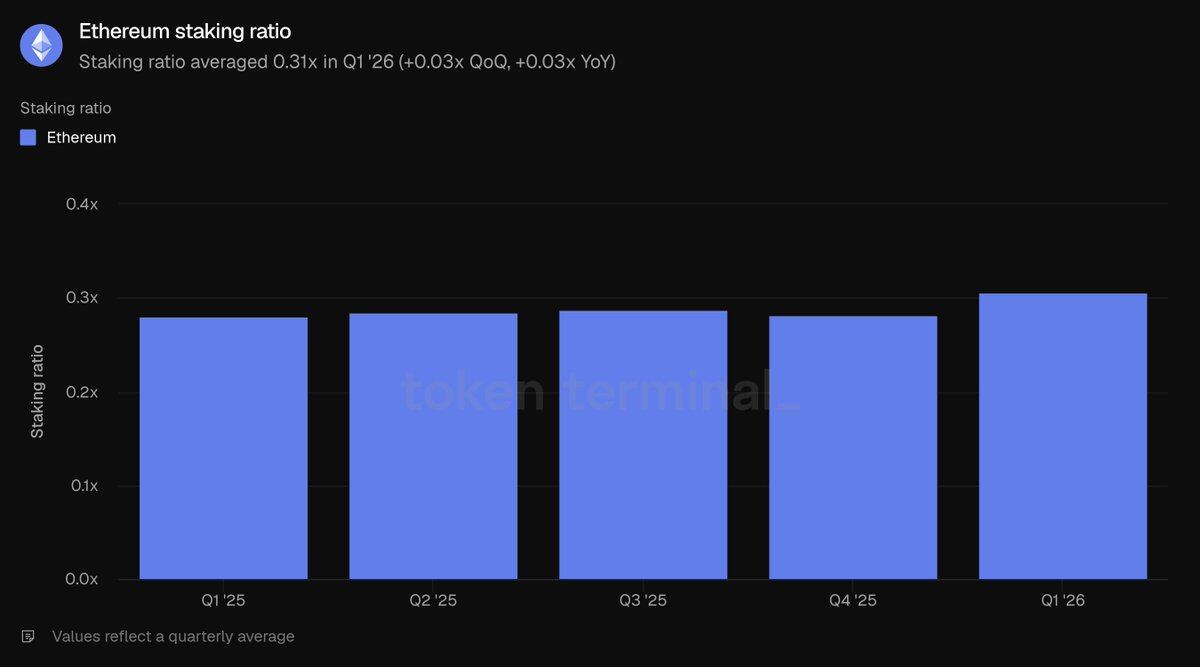
ETH staking ratio: 0.31 (up 0.03 quarter-on-quarter and year-on-year)
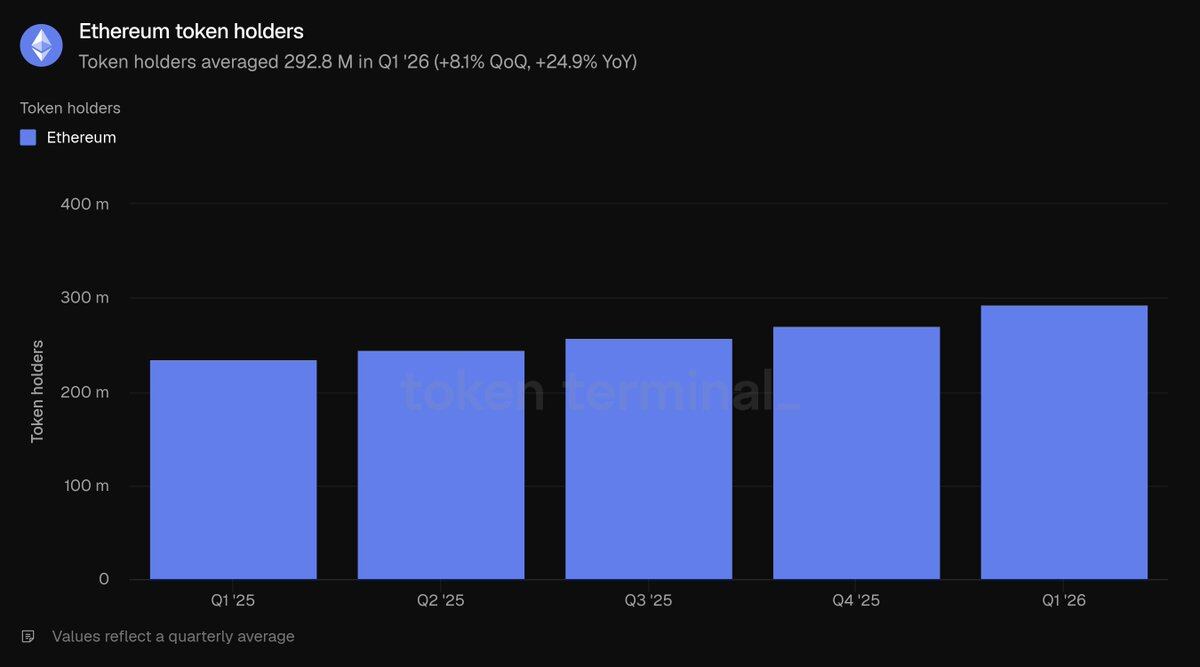
Total number of ETH holding addresses: 292.8 million (quarter-on-quarter +8.1%, year-on-year +24.9%)
Note: This report only includes the Ethereum layer one mainnet; layer two networks are regarded as independent public chains, and related data are not included in Ethereum's statistics.
Overall ecosystem development situation
Total locked assets refer to the dollar total value of assets deposited in various on-chain applications, serving as a leading indicator for revenue-generating businesses such as lending, trading, and staking; this section counts on-chain liquidity funds accessible to all Ethereum ecosystem users at any time. In the first quarter of 2026, the average total locked assets in the Ethereum ecosystem reached 316.2 billion dollars, a decrease of 11.0% quarter-on-quarter and an increase of 22.8% year-on-year. The quarter-on-quarter shrinkage is due to the overall price correction of crypto assets, while the significant year-on-year growth demonstrates substantial expansion of the ecosystem compared to the same period last year.
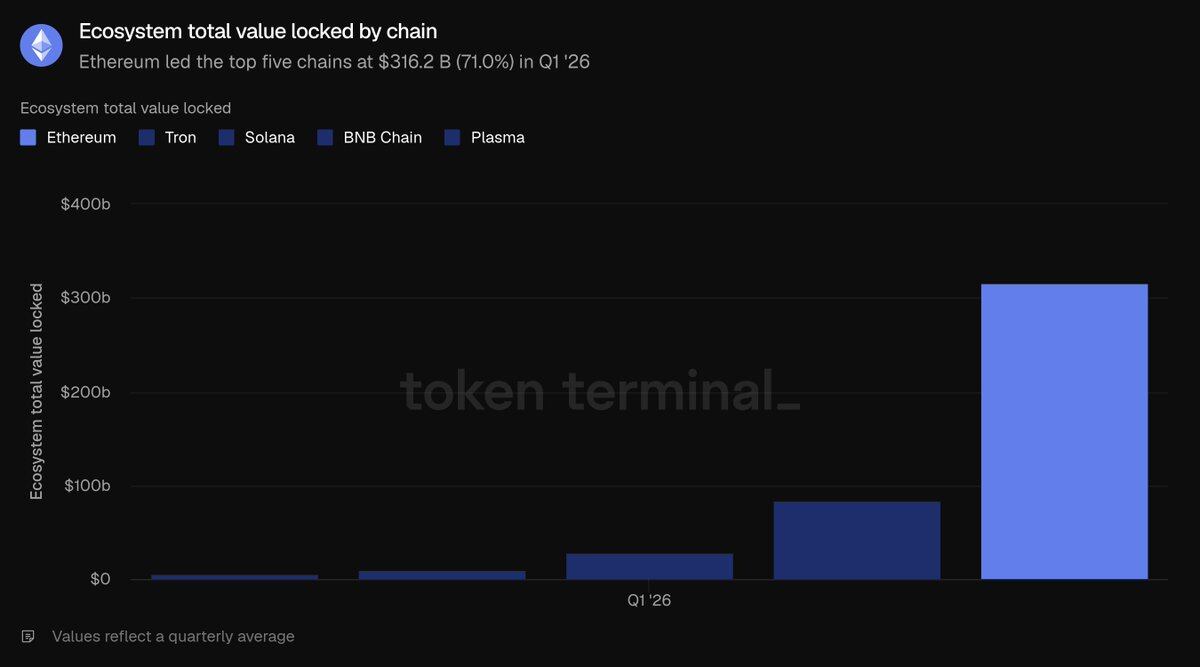
Among the top five public chains, Ethereum's locked asset scale leads significantly: 316.2 billion dollars far surpasses the combined total of TRON (84.5 billion), Solana (28.8 billion), BNB Chain (10.3 billion), and Plasma (5.7 billion), occupying 71% of the total locked amount across the five public chains. Funds are primarily concentrated in two tracks: liquidity staking led by Lido and lending centered around Aave; re-staking protocols like EigenLayer and ether.fi, alongside platforms like Ethena and Sky for synthetic dollar stablecoins, also hold significant portions of the funds. The high concentration of capital is Ethereum's most pronounced structural advantage.
The active lending metric represents the scale of deposits that generate interest income for users, directly reflecting lending business revenue; this counts the total unpaid loans across all Ethereum lending applications. In the first quarter, the average active lending scale in the ecosystem stood at 21.8 billion dollars, a decrease of 16.6% quarter-on-quarter and an increase of 39.0% year-on-year. The lending balance shrank alongside the total locked assets, reflecting a cooling of the overall market risk appetite, though the scale remains significantly higher than the same period last year.
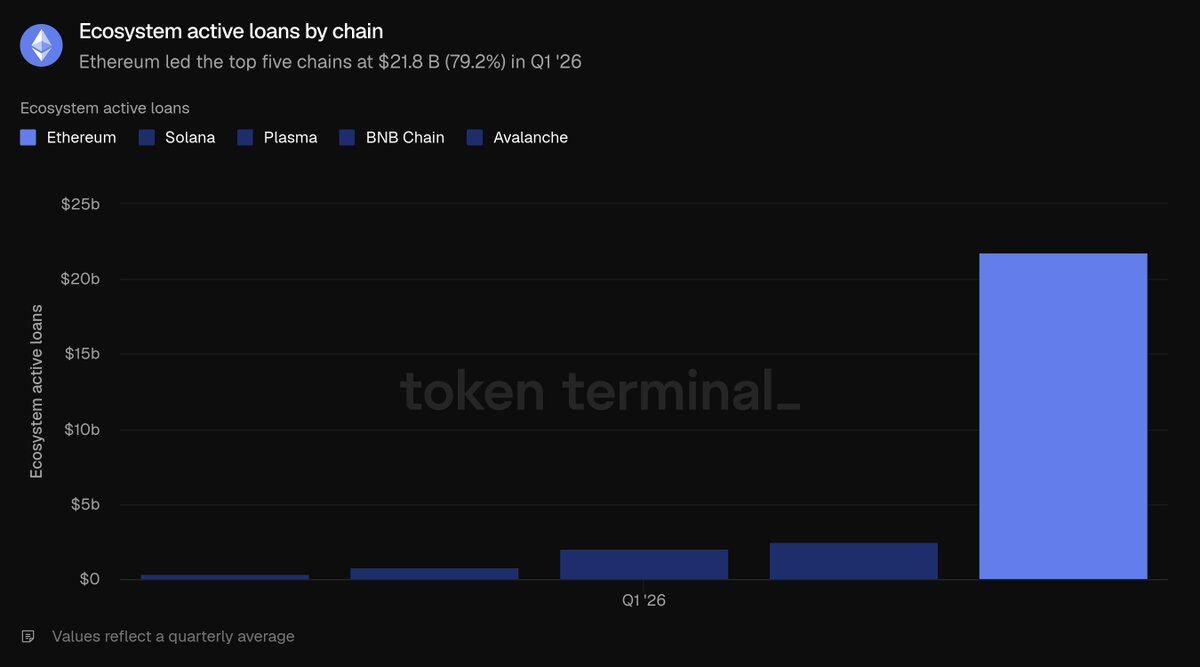
The Ethereum lending market is concentrated in a few liquidity pools, with Aave dominating: the active lending scale at the end of the quarter was about 13.5 billion dollars, making up the vast majority of the ecosystem's share; followed by Morpho (about 1.9 billion), Spark under Sky (about 1 billion), and Maple (about 840 million). The contraction in lending scale this quarter was primarily driven by Aave, as the declining prices of crypto assets led to reduced lending demand, with its total lending volume shrinking by about 24%. Horizontally comparing the five public chains, Ethereum's 21.8 billion active lending significantly leads Solana (2.5 billion), Plasma (2.1 billion), BNB Chain (760.8 million), and Avalanche (392.4 million), accounting for 79.2% of total lending volume across the five public chains, making it the leading track in this sector for Ethereum.
Decentralized exchange trading volume refers to the total amount of transactions completed on on-chain spot exchanges; traders pay transaction fees when trading, and the trading volume is highly correlated with platform revenue, summarizing data from all Ethereum ecosystem DEX trades. In the first quarter, total trading volume in the ecosystem was 134.5 billion dollars, a decrease of 24% quarter-on-quarter and a decline of 31.2% year-on-year. The drop in trading volume outpaced the shrinkage of locked assets, confirming that market risk appetite significantly diminished during this quarter's asset downturn.
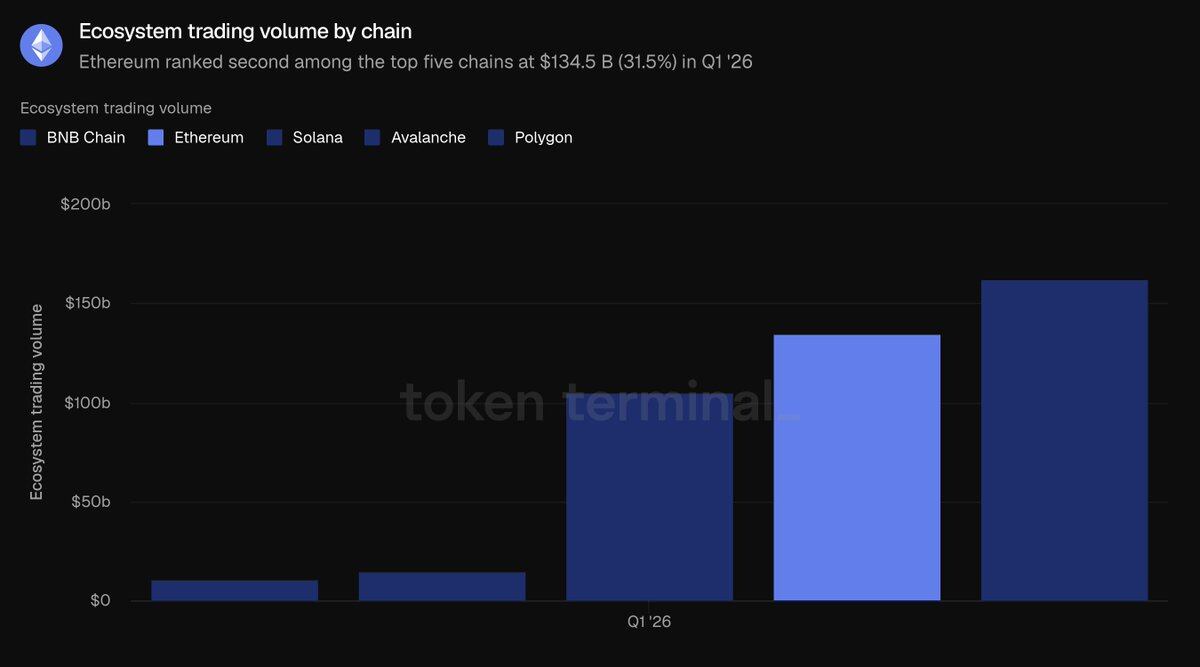
Ethereum DEX trading volume is highly concentrated in leading platforms: Uniswap's trading volume in the first quarter was about 85.5 billion dollars, accounting for two-thirds of the ecosystem total; followed by Curve (about 22.1 billion) and CoW Swap (about 12.4 billion). Trading volume is the only indicator where Ethereum did not top the five public chains: BNB Chain's total trading volume of 162.5 billion dollars exceeds Ethereum's 134.5 billion, with Solana closely following (104.9 billion), and Avalanche (14.5 billion), Polygon (10.7 billion) ranking further behind. Ethereum's trading volume accounts for 31.5% of the total of the five chains, second only to BNB Chain's 38%.
Eco fees refer to all costs incurred by users using various applications, including borrower interest and trader transaction fees, reflecting the economic value created by the ecosystem; this counts the total fees across all Ethereum applications. In the first quarter, total ecosystem fees amounted to 2 billion dollars, with a quarter-on-quarter decline of -16.9% and a year-on-year drop of -7.8%, reflecting a simultaneous retreat alongside the decrease in transaction and lending activity.
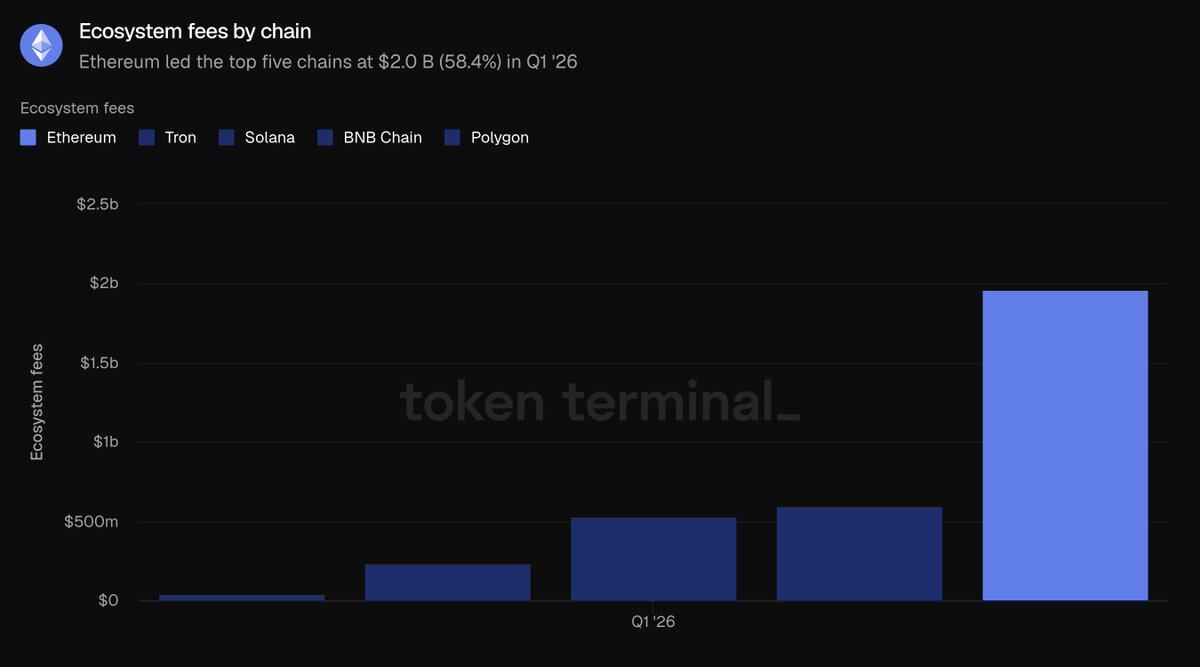
The 2 billion dollars in Ethereum ecosystem fees far surpass TRON (599.3 million), Solana (532.5 million), BNB Chain (231.9 million), and Polygon (38.8 million), accounting for 58.4% of the total fees from the five major public chains. Even with this quarter's data decline, Ethereum remains the leading source of application fees in the industry. Comprehensive of all metrics in this sector: Ethereum leads the industry in total locked funds, lending scale, and ecosystem fees, with only DEX trading volume falling short of BNB Chain.
Tokenized asset sector
The total market value of circulating assets refers to the overall value of on-chain tokenized assets calculated by multiplying circulating supply by the closing price of the day; stablecoins take the total circulating issuance, tokenized funds take the on-chain managed asset scale, and tokenized stocks take the total value of on-chain issued shares, this sector only counts assets issued on Ethereum.
In the first quarter, Ethereum's average total market cap of tokenized assets reached 203.4 billion dollars, virtually flat quarter-on-quarter (only a decrease of 0.7%) and a substantial increase of 42.9% year-on-year. Stablecoins accounted for 87.9% of the overall scale, with the remaining share divided among token funds, commodities, and stocks.
Stablecoins
In the first quarter, Ethereum's average stablecoin scale was 178.9 billion dollars, a slight decline of 2.3% quarter-on-quarter and a year-on-year increase of 37.6%, being the only category of tokenized sub-sector to see a quarter-on-quarter contraction. The market is monopolized by two major issuers: at the end of the quarter, Tether USDT (94.1 billion) and Circle USDC (54.5 billion) accounted for the vast majority of Ethereum's stablecoin market value; other major products include Sky USDS (12.4 billion), Ethena USDe (5.9 billion), PayPal PYUSD (2.9 billion); new compliant coins like Ripple's RLUSD (1.1 billion) have also been launched. Horizontally comparing the five major public chains, Ethereum leads in stablecoin scale at 178.9 billion, surpassing TRON (84.5 billion), Solana (14.5 billion), Arbitrum One (6.8 billion), and Base (4.7 billion), accounting for 61.8% of total stablecoins across the five chains.
Tokenized funds
In the first quarter, Ethereum's average tokenized fund scale was 19.4 billion dollars, an increase of 4.9% quarter-on-quarter and skyrocketing 73.1% year-on-year. The sector is divided into two main types:
Income-generating on-chain dollar products (largest scale): Sky sUSDS (about 6.4 billion), Ethena sUSDe (about 3.5 billion);
Traditional financial compliant funds (core carriers of institutional narratives): BlackRock BUIDL (issued via Securitize, about 1 billion), WisdomTree government money fund (about 815 million), Superstate USTB (about 620 million), Ondo OUSG (about 320 million) closely follows. Comparing the five major public chains, Ethereum's 19.4 billion tokenized fund leads significantly over ZKsync Era (2.5 billion), BNB Chain (2.3 billion), Solana (1.3 billion), Stellar (1.1 billion), accounting for 73%, making it the second most advantageous track in token assets for Ethereum.
Tokenized commodities
In the first quarter, Ethereum's average scale of tokenized commodities was 4.7 billion dollars, with a quarter-on-quarter increase of 60% and a year-on-year surge of 325.9%, marking the fastest-growing tokenized category. The sector is almost entirely composed of on-chain gold: Tether Gold XAUT (about 2.6 billion) and Paxos Gold PAXG (about 2.4 billion) collectively hold all market shares. Horizontally comparing five related public chains, Ethereum's 4.7 billion scale far exceeds Ripple (736.6 million), Arbitrum One (95.9 million), BNB Chain (38.4 million), and Solana (29.8 million), accounting for 84%, making it the strongest segment for Ethereum’s dominance.
Tokenized stocks
Tokenized stocks is the smallest sub-category, with Ethereum's average scale in the first quarter being 365.1 million dollars, nearly zero in the same period last year, and a quarter-on-quarter increase of 16.5%. The sector is nearly monopolized by Ondo Finance, which issues on-chain assets for the S&P 500, NASDAQ 100 broad index, and dozens of individual stocks, constituting the vast majority of Ethereum’s tokenized stock market. Comparing the five major public chains, Ethereum's 365.1 million slightly leads Solana (249 million), BNB Chain (150.5 million), Arbitrum One (29 million), and Stellar (4.2 million), accounting for only 45.8% of the total of five chains in the tokenized stock sector where Ethereum does not have an absolute majority share.
In summary, within the tokenized asset sector, the stablecoin stock slightly receded, but Ethereum's monopoly position in the token fund and commodity sector continues to solidify.
On-chain usage activity
Monthly active users are defined as independent addresses generating revenue-based on on-chain transactions monthly; this metric only counts interaction addresses on the Ethereum layer one mainnet. In the first quarter, the average monthly active users reached 13.2 million, a substantial increase of 53.5% quarter-on-quarter and an increase of 85.9% year-on-year, setting a new historical record, ending a slow growth trend from several previous quarters with a significant uptick in user growth.
Total transaction volume refers to the number of transactions written to the blockchain and confirmed, reflecting user interaction heat on-chain; the transactions processed per second (TPS) is the average confirmation rate during the period, measuring the network's real-time carrying capacity; both metrics only count transactions on the Ethereum layer one mainnet. In the first quarter, layer one transaction totals reached 200.4 million, a quarter-on-quarter increase of 38% and a year-on-year increase of 81.5%; average TPS rose to 25.78, a quarter-on-quarter increase of 41.2%. Both data points set new historical highs, demonstrating that user scale growth has genuinely translated into incremental on-chain real business.
This section’s transaction fees specifically refer to the basic network costs for users initiating transactions on Ethereum layer one, differentiating it from the total ecosystem application fee metric previously mentioned. In the first quarter, total transaction fees on layer one amounted to 39.9 million dollars, with a dramatic drop of 47.9% quarter-on-quarter and a significant decrease of 81.9% year-on-year. The increase in activity and the considerable decrease in fees are the core data contrasts of this quarter: total transactions increased by 38%, yet total fees shrank by nearly half; the core reason is that the Blob expansion significantly enhanced block storage capacity, ensuring ample block space supply, and lowering the cost per transaction markedly.
The core conclusion of this section is that the benefits of expansion have arrived: user counts and transaction numbers have both reached new highs, while overall network usage costs have decreased. When the rate of network throughput expansion exceeds the rate of market transaction demand growth, it will exhibit "rising activity, falling fees" characteristics.
Fundamentals of the native token ETH
Fully diluted total market cap calculation logic: ETH token price × total maximum supply under the current token economic model (including circulating, locked, unlocked, and tokens to be issued). In the first quarter, the average fully diluted market cap of ETH was 290 billion dollars, significantly decreasing by 30.3% quarter-on-quarter and declining by 9.9% year-on-year, marking the largest quarter-on-quarter drop among all valuation indicators reported and serving as the core factor driving down the dollar-denominated asset scale across the entire ecosystem.
Staking ratio: the total value of staked ETH secured for proof-of-stake network security, relative to the overall market cap of ETH; 0.31 indicates that approximately 31% of ETH’s market value is staked. In the first quarter, the average staking ratio was 0.31, higher than the previous quarter and last year’s 0.28. Even as ETH’s overall market cap significantly corrected, the proportion of tokens participating in staking for network security still increased, indicating that user willingness for long-term staking remained stable despite the price downturn.
Token holders metric: total number of independent wallet addresses holding ETH. In the first quarter, the average number of ETH holding addresses was 292.8 million, up 8.1% quarter-on-quarter and 24.9% year-on-year, steadily increasing for five consecutive quarters. Against the background of declining fully diluted market value, the expanding holding addresses demonstrate that the group holding ETH has further diversified, and ordinary users' willingness to lay down capital has not cooled with the short-term market chill.
Comments and interpretations by the Etherealize team
The most core contradictory phenomenon this quarter: Ethereum’s layer one mainnet on-chain usage scale reached a historical high, while network transaction fees simultaneously declined. Ethereum actively promotes network expansion, sacrificing short-term fee revenue for long-term logic: more affordable block space will unleash massive potential market demand, ultimately driving long-term revenue growth for the entire network.
Data from Token Terminal's "Q1 2026 Ethereum Report" proves that this long-term logic is being validated: year-on-year growth of monthly active users by 85.9%, total transaction volume rising by 81.5%, and network throughput improving by 81.7%. This is a typical manifestation of Jevons Paradox. The team predicts that the overall increase in network transaction demand will completely cover the short-term income loss caused by the decline in single transaction fees. Drawing an analogy with the semiconductor industry: when Gordon Moore proposed Moore’s Law in 1975, the industry revenue scale was limited, and today it has grown by several orders of magnitude. The expansion benefits have not yet been fully released: the Q3 Glamsterdam upgrade plan will increase the Gas limit by more than three times; the long-term roadmap for Ethereum aims to achieve thousands of TPS by 2029, creating a high-speed layer one public chain with second-level transaction finality.
The team supports BlackRock CEO Larry Fink's view from December last year: the stage that the tokenized industry is currently at is akin to the Internet in 1996 — at that time, Amazon's online book sales were merely 16 million dollars. The market commonly believed that Amazon was only surviving due to the Internet bubble as a consistently loss-making online bookstore; however, Jeff Bezos foresaw that the Internet would completely reshape the retail industry, choosing to forsake short-term profitability while fully focusing on creating network effects and scale advantages. Ethereum is now making the same trade-off to solidify its positioning as the baseline settlement layer for global finance.
The development of the Internet brings another important insight: open, permissionless networks will ultimately triumph over closed private networks. In 1995, Bill Gates predicted in "The Road Ahead" that digital commerce would rely on proprietary private networks like "information superhighway," rather than the open Internet. At that time, Microsoft built MSN, America Online, CompuServe, and Prodigy, all operating closed garden walls with millions of paid users; the French Minitel terminal system, until the end of 1996, had more users than the global Internet. However, all these closed systems ultimately failed. No major enterprise wants to establish operations on networks controlled by competitors; more crucially, no enterprise can permanently keep up with the innovation speed of permissionless open ecosystems. History continuously confirms this rule: Linux surpassing proprietary Unix systems, open web displacing corporate intranets, and Wikipedia replacing the Encyclopedia Britannica. In each initial phase of revolution, proprietary products gain first mover advantages due to more accurate features, sufficient marketing, and commercial resources; but once the open ecosystem accumulates enough development tools, developers, and neutral trusted properties, first-mover advantages quickly dissipate.
Today, this industry regularity is replaying in the field of financial infrastructure, and all data in this report can support the evidence that Ethereum has crossed the ecological tipping point: mastering absolute market share across all core tracks. Institutional participation in tokenized finance choosing Ethereum is not based on ideological preference but due to liquidity, composability, and mature institutional landing cases focusing here. Report data shows that Ethereum occupies 79.2% of the active lending in DeFi, 61.8% of stablecoins, 73% of token funds, and 84% of tokenized commodity market shares among the five major public chains. Every newly added tokenized asset further enriches ecosystem liquidity, continuously attracting more institutions to join; the neutral and unbiased baseline is the only stable and balanced solution in the industry — large financial institutions will never uniformly choose competing private chains to complete asset settlements. Additionally, institutions gradually realize that privacy interactions, access restrictions, KYC compliance, and asset transfer controls can all be implemented through privacy computing environments and permissioned token standards on Ethereum's upper layer while fully accessing public liquidity across the network; conversely, closed private chains cannot tap into the massive liquidity and diverse applications of the open ecosystem.
After the quarter ended, the pace of institutional layouts accelerated further, with numerous significant implementations appearing in May: In asset management: BlackRock has added two new tokenized fund applications; JPMorgan issued its second Ethereum-based currency fund JLTXX; Fidelity International launched a Moody's AAA-rated dollar liquidity fund FILQ, available in ERC-20 token format. In the stablecoin sector: the Japan Blockchain Foundation's yen stablecoin EJPY is set to deploy on Ethereum; a consortium of 12 major European banks (including BNP Paribas, ING, UniCredit, Banco Sabadell, etc.) is preparing a compliant euro stablecoin.
The Internet in the 1990s seemed distant, yet by 2005 it had become a societal necessity. If Fink's judgment on the developmental stage of the tokenized industry is accurate, the next few years may prove to be the most opportunistic phase in Ethereum's developmental history. The team previously proposed in the "Efficient Currency" report the core view that network fees are the foundation of ETH's inherent value; the long-term optimistic logic is that by leveraging more refined monetary properties, ETH is expected to attract over 30 trillion dollars in monetary store value premium from gold and Bitcoin. Ethereum's industry-leading position can be established without relying on high transaction fees.
免责声明:本文章仅代表作者个人观点,不代表本平台的立场和观点。本文章仅供信息分享,不构成对任何人的任何投资建议。用户与作者之间的任何争议,与本平台无关。如网页中刊载的文章或图片涉及侵权,请提供相关的权利证明和身份证明发送邮件到support@aicoin.com,本平台相关工作人员将会进行核查。


